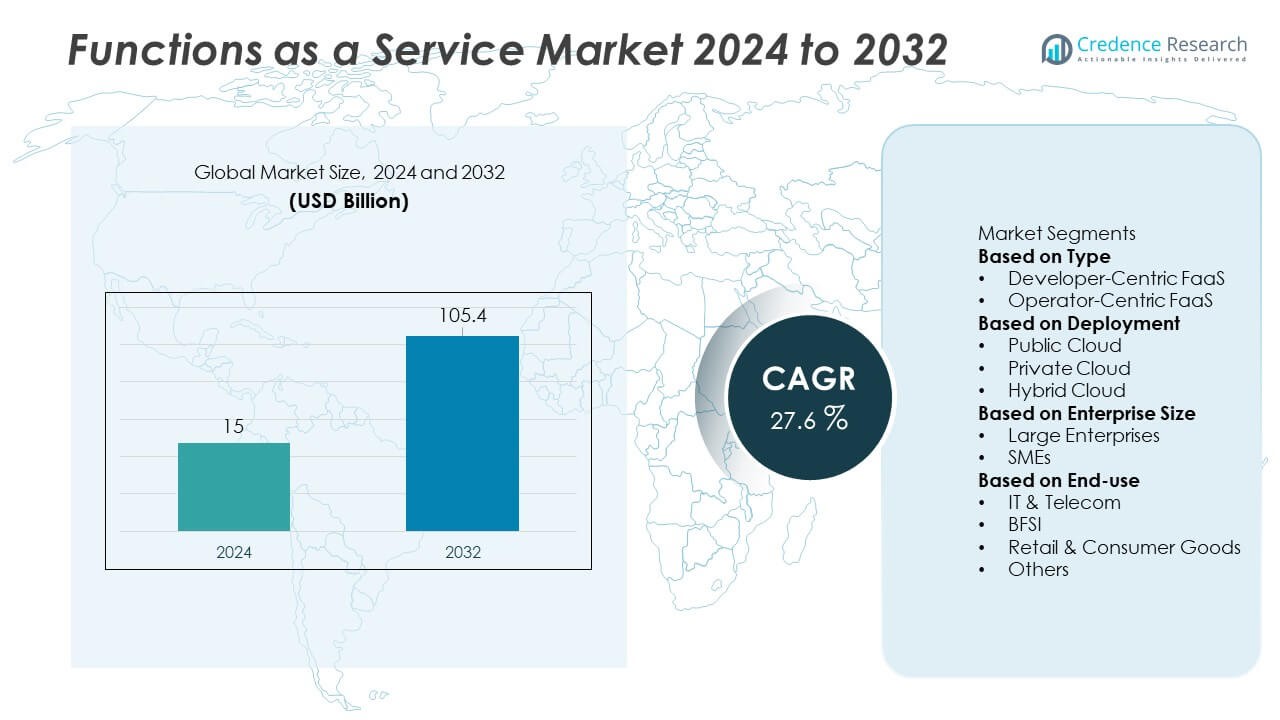
Home » Information and Communications Technology » Functions as a Service (FaaS) Market

Functions as a Service (FaaS) Market – By User Type ( Developer-Centric FaaS, Operator-Centric FaaS) By Service Type ( Automation and Integration Service, Microservice Monitoring and Management Service, API Management Service, Support and Maintenance, Training and Consulting, Others (Metering and Billing)) By Application ( Web-based and Mobile Application, Research and Academic Application, Others – Growth, Future Prospects, And Competitive Landscape, 2016 – 2028

Price: $4999

Published: | Report ID: 5867 | Report Format : PDF

Market Introduction of Functions as a Service (FaaS) Market

Function as a service (FaaS) is a group of cloud computing services that gives users a platform to create, use, and manage application functions without having to deal with the hassle of setting up and maintaining the infrastructure generally involved in creating and launching an app. This concept is frequently used when creating microservices applications and is one method of creating a “serverless” architecture. FaaS use cases are linked to “on-demand” capabilities, which enables the supporting infrastructure to be shut down and not be charged when not in use.

Design Element 2

Access crucial information at unmatched prices!

Request your free sample report today & start making informed decisions powered by Credence Research!

Download Free Sample
CTA Design Element 3

What is the Market Size of Functions as a Service (FaaS) in terms of value?

The global Functions as a Service (FaaS) Market is projected to increase at a significant CAGR of 29.50% in the coming years. In 2021, the global Functions as a Service (FaaS) market was valued at USD 6829.4 million and projected to reach USD 32210.774 million by 2028. Functions as a Service (FaaS) will increase substantially in the coming years. It is presumed to generate revenue opportunities for the key industry players worth USD 25381.37 million during the forecast period between 2022 and 2028.

Which is the key Deployment Model segment in the Functions as a Service (FaaS) Market?

The hybrid cloud segment registered a revenue share of over 35.0% of the total Functions as a Service (FaaS) in 2021. Due to their increased usage compared to other clouds, hybrid clouds are predicted to fuel the market expansion. When a firm needs to free up local resources for more sensitive data or applications or when it has to handle short-term spikes in demand, hybrid cloud deployment can help.

Hybrid cloud deployment allows businesses to scale out their on-premises infrastructure to the public cloud to handle any overflow without providing third-party data centers access to all of their data in response to the growth in fluctuating demand for computing and processing. End-users’ worries about the security of their data and past reluctance to adopt this solution have been satisfactorily addressed by these developments. Retailers are constantly looking to implement hybrid cloud technology. In its most recent enterprise cloud index survey, Nutanix, one of the leading providers of enterprise cloud computing solutions, found that 87.5% of the merchants that responded chose hybrid cloud as their optimal I.T. operating model.

Interesting Facts about Functions as a Service (FaaS) Industry

  • The top countries in the Functions as a Service (FaaS) market are the U.S., Mexico, Canada, China, Germany, and France.
  • The market is expanding due to the increased need for solutions to server management problems, the explosive growth of the app development industry, and the transition from DevOps to serverless computing.
  • The obstacles related to third-party APIs, such as lock-in issues, security and compliance issues, and other architectural complications, are the restraints of the market.
  • In terms of volume and value, the North American region dominated the global Functions as a Service (FaaS) market in 2021. It is anticipated that this dominance will persist over the forecast period.
  • Healthcare and Life Sciences to witness high growth during the forecast period.

Who are the Top players/companies in the Functions as a Service (FaaS) market in terms of value?

The key players in the global Functions as a Service (FaaS) market in terms of value include Microsoft Corporation (U.S.), IBM (U.S.), Google Inc. (U.S.), Infosys Ltd. (India), TIBCO Software Inc. (U.S.), Amazon Web Services(U.S.), Rogue Wave Software Inc. (U.S.), SAP SE (Germany), Dynatrace LLC (U.S.), and Fiorano Software and Affiliates (U.S.). To improve their production of Functions as a Service (FaaS) and increase their competitive market share on a global scale, these main players are focusing on new product advancements as well as technological innovation. A few regional and national firms are also making significant investments to diversify their product offerings and boost sales. For Instance, in June 2020, Microsoft Corporation and NTT DATA Corporation recently announced the expansion of their partnership with a focus on quickening enterprise customers’ digital transformations and making Microsoft Azure their go-to cloud platform to boost productivity at work.

Who are the Top 10 Countries in the Functions as a Service (FaaS) Market?

The major countries in the global Functions as a Service (FaaS) market are China, the U.S., India, Canada, the U.K., Mexico, South Korea, Germany, France, and Italy. China is the major Functions as a Service (FaaS) market, with a major volume share in the global market in 2021. Moreover, the market in developed countries is majorly driven by the increased number of infrastructure development projects and urbanization. Besides, the Functions as a Service (FaaS) market in developing countries in South Asia and South East Asian countries is projected to witness major growth in the coming years.

Which is the key Industry Vertical used in the Functions as a Service (FaaS) Market?

The Healthcare and Life Sciences category dominated the Functions as a Service (FaaS) market in 2021. The demand for solutions that can quickly develop and implement business process linkages and healthcare data transformations drives the healthcare and life sciences industry. Medical professionals, patients, employees, administrators, and the general public make up the complex organizations that comprise healthcare and life sciences facilities. They need effective data management systems for various tasks, including managing patients, hospitals’ resources, doctor-patient relationships, medical supplies, and keeping patient health records data. The industry has changed to a paradigm that aids in coordinating and supporting workflows for medical data. The cloud assists the healthcare sector in storing vast amounts of data, makes it easier for doctors and hospitals to share information and enhances data tracking and analytic functions. This aids in research, prices, physician or student performance, and treatment. The healthcare and life sciences vertical is currently more concerned with value generation than volume. Organizations in the public and private healthcare sectors are under pressure to boost population health while cutting expenses.

Additionally, enterprises might need to share healthcare data, which increases the demand for a reliable platform. To share information and collaborate in an organized way to accommodate growth and improve agility, organizations can integrate their systems with other healthcare networks using FaaS service types. This helps healthcare providers further optimize and boost the effectiveness of their patients’ services.

What are the Major Driving Factors for Functions as a Service (FaaS) Market?

To assess the market’s general attractiveness, trends in the function-as-a-service market are detailed. The top influencing variables highlight the FaaS market opportunity throughout the forecast period. The market is expanding due to the increased need for solutions to server management problems, the explosive growth of the app development industry, and the transition from DevOps to serverless computing. Even though DevOps is one of the most popular methods for fusing development and operations, its application is occasionally seen as challenging. The growing shift to serverless computing is a result of these DevOps-related concerns. The market is expected to develop due to the growing trend toward serverless computing, fueling demand for function as a service.

What are the Major Restraints for Functions as a Service (FaaS) Market?

The main hindrance to expanding the global Functions as a Service (FaaS) industry is the difficulties associated with third-party APIs, such as lock-in problems, security and compliance problems, and other architectural difficulties. Issues relating to the incompatibility of using various apps in a cloud environment are hindering the industry.

Shape Your Report to Specific Countries or Regions & Enjoy 30% Off!

Which Region Dominated the World Functions as a Service (FaaS) Market?

In 2021, North America dominated the global Functions as a Service (FaaS) market and accounted for a major market revenue share. The largest market share belongs to North America. The region is among the leading innovators and pioneers in the adoption of new technologies like 5G, autonomous driving, IoT, Blockchain, gaming, and artificial intelligence. This trend will probably fuel the adoption of function as a service in the area. Additionally, the region is home to FaaS vendors, contributing to the market’s expansion. IBM Corporation, Microsoft Corporation, Oracle Corporation, Amazon Web Services, etc., are a few of them. As the number of data sources expands, new business insights are growing and helping the market being researched in the U.S. to grow. FaaS may significantly increase computing performance and the outcomes that directly affect company performance. The region’s market demand is also rising due to the increased demand for company agility and flexibility.

Increasing demand for corporate flexibility and agility, a high penetration rate into different industry verticals, and the prevalence of FaaS providers in the U.S. are some of the key drivers fueling the expansion of this market. Due to significant investments in cloud service providers in this area to improve customer experiences and optimize business processes, APAC is anticipated to develop faster shortly.

Segmentation of Global Functions as a Service (FaaS) Market-

Global Functions as a Service (FaaS) Market – By User Type

  • Developer-Centric FaaS
  • Operator-Centric FaaS

Global Functions as a Service (FaaS) Market – By Service Type

  • Automation and Integration Service
  • Microservice Monitoring and Management Service
  • API Management Service
  • Support and Maintenance
  • Training and Consulting
  • Others (Metering and Billing)

Global Functions as a Service (FaaS) Market – By Application

  • Web-based and Mobile Application
  • Research and Academic Application
  • Others (Stream Processing and Media Processing)

Global Functions as a Service (FaaS) Market – By Deployment Model

  • Public Cloud
  • Private Cloud
  • Hybrid Cloud

Global Functions as a Service (FaaS) Market – By Organization Size

  • Small and Medium Enterprise (SME)
  • Large enterprise

Global Functions as a Service (FaaS) Market – By Industry Vertical

  • BFSI
  • Telecommunication and ITES
  • Consumer Goods and Retail
  • Healthcare and Life Sciences
  • Government and Public Sector
  • Manufacturing
  • Media and Entertainment
  • Others

Global Functions as a Service (FaaS) Market – By Region

  • North America
    • U.S.
    • Canada
  • Europe
    • Germany
    • France
    • U.K.
    • Italy
    • Spain
    • Rest of Europe
  • Asia Pacific
    • China
    • Japan
    • India
    • South Korea
    • South-east Asia
    • Rest of Asia Pacific
  • Latin America
    • Brazil
    • Mexico
    • Rest of Latin America
  • Middle East & Africa
    • GCC Countries
    • South Africa
    • Rest of Middle East and Africa

1. Preface
1.1. Report Description
1.1.1. Purpose of the Report
1.1.2. Target Audience
1.1.3. USP and Key Offerings
1.2. Research Scope
1.3. Research Methodology
1.3.1. Phase I – Secondary Research
1.3.2. Phase II – Primary Research
1.3.3. Phase III – Expert Panel Review
1.3.4. Approach Adopted
1.3.4.1. Top-Down Approach
1.3.4.2. Bottom-Up Approach
1.3.5. Assumptions
1.4. Market Segmentation

2. Executive Summary
2.1. Market Snapshot: Global Functions as a Service (FaaS) Market

3. Market Dynamics & Factors Analysis
3.1. Introduction
3.1.1. Global Functions as a Service (FaaS) Market Value, 2016-2028, (US$ Mn)
3.2. Market Dynamics
3.2.1. Key Growth Trends
3.2.2. Major Industry Challenges
3.2.3. Key Growth Pockets
3.3. Attractive Investment Proposition,2021
3.3.1. User Type
3.3.2. Service Type
3.3.3. Application
3.3.4. Deployment Model
3.3.5. Organization Size
3.3.6. Industry Vertical
3.3.7. Geography
3.4. Porter’s Five Forces Analysis
3.4.1. Threat of New Entrants
3.4.2. Bargaining Power of Buyers/Consumers
3.4.3. Bargaining Power of Suppliers
3.4.4. Threat of Substitute Types
3.4.5. Intensity of Competitive Rivalry
3.5. Value Chain Analysis

4. Market Positioning of Key Players, 2021
4.1. Company market share of key players, 2021
4.2. Competitive Benchmarking
4.3. Geographical Presence Analysis
4.4. Major Strategies Adopted by Key Players
4.4.1. Key Strategies Analysis
4.4.2. Mergers and Acquisitions
4.4.3. Partnerships
4.4.4. Product Launch
4.4.5. Geographical Expansion
4.4.6. Others

5. COVID 19 Impact Analysis
5.1. Global Functions as a Service (FaaS) Market Pre Vs Post COVID 19, 2019 – 2028
5.2. Impact on Import & Export
5.3. Impact on Demand & Supply

6. North America
6.1. North America Functions as a Service (FaaS) Market, by Country, 2016-2028(US$ Mn)
6.1.1. U.S.
6.1.2. Canada
6.1.3. Mexico
6.2. North America Functions as a Service (FaaS) Market, by User Type, 2016-2028(US$ Mn)
6.2.1. Overview
6.2.2. Developer-Centric FaaS
6.2.3. Operator-Centric FaaS
6.3. North America Functions as a Service (FaaS) Market, by Service Type, 2016-2028(US$ Mn)
6.3.1. Overview
6.3.2. Automation and Integration Service
6.3.3. Microservice Monitoring and Management Service
6.3.4. API Management Service
6.3.5. Support and Maintenance
6.3.6. Training and Consulting
6.3.7. Others (Metering and Billing)
6.4. North America Functions as a Service (FaaS) Market, by Application, 2016-2028(US$ Mn)
6.4.1. Overview
6.4.2. Web-based and Mobile Application
6.4.3. Research and Academic Application
6.5. North America Functions as a Service (FaaS) Market, by Deployment Model, 2016-2028(US$ Mn)
6.5.1. Overview
6.5.2. Public Cloud
6.5.3. Private Cloud
6.5.4. Hybrid Cloud
6.6. North America Functions as a Service (FaaS) Market, by Organization Size, 2016-2028(US$ Mn)
6.6.1. Overview
6.6.2. Small and Medium Enterprise (SME)
6.6.3. Large enterprise
6.7. North America Functions as a Service (FaaS) Market, by Industry Vertical, 2016-2028(US$ Mn)
6.7.1. Overview
6.7.2. BFSI
6.7.3. Telecommunication and ITES
6.7.4. Consumer Goods and Retail
6.7.5. Healthcare and Life Sciences
6.7.6. Government and Public Sector
6.7.7. Manufacturing
6.7.8. Media and Entertainment
6.7.9. Others

7. Europe
7.1. Europe Functions as a Service (FaaS) Market, by Country, 2016-2028(US$ Mn)
7.1.1. UK
7.1.2. France
7.1.3. Germany
7.1.4. Italy
7.1.5. Russia
7.1.6. Ukraine
7.1.7. Spain
7.1.8. Belgium
7.1.9. Netherland
7.1.10. Austria
7.1.11. Sweden
7.1.12. Poland
7.1.13. Denmark
7.1.14. Switzerland
7.1.15. Rest of Europe
7.2. Europe Functions as a Service (FaaS) Market, by User Type, 2016-2028(US$ Mn)
7.2.1. Overview
7.2.2. Developer-Centric FaaS
7.2.3. Operator-Centric FaaS
7.3. Europe Functions as a Service (FaaS) Market, by Service Type, 2016-2028(US$ Mn)
7.3.1. Overview
7.3.2. Automation and Integration Service
7.3.3. Microservice Monitoring and Management Service
7.3.4. API Management Service
7.3.5. Support and Maintenance
7.3.6. Training and Consulting
7.3.7. Others (Metering and Billing)
7.4. Europe Functions as a Service (FaaS) Market, by Application, 2016-2028(US$ Mn)
7.4.1. Overview
7.4.2. Web-based and Mobile Application
7.4.3. Research and Academic Application
7.5. Europe Functions as a Service (FaaS) Market, by Deployment Model, 2016-2028(US$ Mn)
7.5.1. Overview
7.5.2. Public Cloud
7.5.3. Private Cloud
7.5.4. Hybrid Cloud
7.6. Europe Functions as a Service (FaaS) Market, by Organization Size, 2016-2028(US$ Mn)
7.6.1. Overview
7.6.2. Small and Medium Enterprise (SME)
7.6.3. Large enterprise
7.7. Europe Functions as a Service (FaaS) Market, by Industry Vertical, 2016-2028(US$ Mn)
7.7.1. Overview
7.7.2. BFSI
7.7.3. Telecommunication and ITES
7.7.4. Consumer Goods and Retail
7.7.5. Healthcare and Life Sciences
7.7.6. Government and Public Sector
7.7.7. Manufacturing
7.7.8. Media and Entertainment
7.7.9. Others

8. Asia Pacific
8.1. Asia Pacific Functions as a Service (FaaS) Market, by Country, 2016-2028(US$ Mn)
8.1.1. China
8.1.2. Japan
8.1.3. South Korea
8.1.4. India
8.1.5. Australia
8.1.6. New Zealand
8.1.7. Taiwan
8.1.8. Indonesia
8.1.9. Malaysia
8.1.10. Philippine
8.1.11. Rest of Asia Pacific
8.2. Asia Pacific Functions as a Service (FaaS) Market, by User Type, 2016-2028(US$ Mn)
8.2.1. Overview
8.2.2. Developer-Centric FaaS
8.2.3. Operator-Centric FaaS
8.3. Asia Pacific Functions as a Service (FaaS) Market, by Service Type, 2016-2028(US$ Mn)
8.3.1. Overview
8.3.2. Automation and Integration Service
8.3.3. Microservice Monitoring and Management Service
8.3.4. API Management Service
8.3.5. Support and Maintenance
8.3.6. Training and Consulting
8.3.7. Others (Metering and Billing)
8.4. Asia Pacific Functions as a Service (FaaS) Market, by Application, 2016-2028(US$ Mn)
8.4.1. Overview
8.4.2. Web-based and Mobile Application
8.4.3. Research and Academic Application
8.5. Asia Pacific Functions as a Service (FaaS) Market, by Deployment Model, 2016-2028(US$ Mn)
8.5.1. Overview
8.5.2. Public Cloud
8.5.3. Private Cloud
8.5.4. Hybrid Cloud
8.6. Asia Pacific Functions as a Service (FaaS) Market, by Organization Size, 2016-2028(US$ Mn)
8.6.1. Overview
8.6.2. Small and Medium Enterprise (SME)
8.6.3. Large enterprise
8.7. Asia Pacific Functions as a Service (FaaS) Market, by Industry Vertical, 2016-2028(US$ Mn)
8.7.1. Overview
8.7.2. BFSI
8.7.3. Telecommunication and ITES
8.7.4. Consumer Goods and Retail
8.7.5. Healthcare and Life Sciences
8.7.6. Government and Public Sector
8.7.7. Manufacturing
8.7.8. Media and Entertainment
8.7.9. Others

9. Latin America
9.1. Latin America Functions as a Service (FaaS) Market, by Country, 2016-2028(US$ Mn)
9.1.1. Brazil
9.1.2. Argentina
9.1.3. Peru
9.1.4. Chile
9.1.5. Colombia
9.1.6. Rest of Latin America
9.2. Latin America Functions as a Service (FaaS) Market, by User Type, 2016-2028(US$ Mn)
9.2.1. Overview
9.2.2. Developer-Centric FaaS
9.2.3. Operator-Centric FaaS
9.3. Latin America Functions as a Service (FaaS) Market, by Service Type, 2016-2028(US$ Mn)
9.3.1. Overview
9.3.2. Automation and Integration Service
9.3.3. Microservice Monitoring and Management Service
9.3.4. API Management Service
9.3.5. Support and Maintenance
9.3.6. Training and Consulting
9.3.7. Others (Metering and Billing)
9.4. Latin America Functions as a Service (FaaS) Market, by Application, 2016-2028(US$ Mn)
9.4.1. Overview
9.4.2. Web-based and Mobile Application
9.4.3. Research and Academic Application
9.5. Latin America Functions as a Service (FaaS) Market, by Deployment Model, 2016-2028(US$ Mn)
9.5.1. Overview
9.5.2. Public Cloud
9.5.3. Private Cloud
9.5.4. Hybrid Cloud
9.6. Latin America Functions as a Service (FaaS) Market, by Organization Size, 2016-2028(US$ Mn)
9.6.1. Overview
9.6.2. Small and Medium Enterprise (SME)
9.6.3. Large enterprise
9.7. Latin America Functions as a Service (FaaS) Market, by Industry Vertical, 2016-2028(US$ Mn)
9.7.1. Overview
9.7.2. BFSI
9.7.3. Telecommunication and ITES
9.7.4. Consumer Goods and Retail
9.7.5. Healthcare and Life Sciences
9.7.6. Government and Public Sector
9.7.7. Manufacturing
9.7.8. Media and Entertainment
9.7.9. Others
9.7.10.

10. Middle East
10.1. Middle East Functions as a Service (FaaS) Market, by Country, 2016-2028(US$ Mn)
10.1.1. UAE
10.1.2. KSA
10.1.3. Israel
10.1.4. Turkey
10.1.5. Iran
10.1.6. Rest of Middle East
10.2. Middle East Functions as a Service (FaaS) Market, by User Type, 2016-2028(US$ Mn)
10.2.1. Overview
10.2.2. Developer-Centric FaaS
10.2.3. Operator-Centric FaaS
10.3. Middle East Functions as a Service (FaaS) Market, by Service Type, 2016-2028(US$ Mn)
10.3.1. Overview
10.3.2. Automation and Integration Service
10.3.3. Microservice Monitoring and Management Service
10.3.4. API Management Service
10.3.5. Support and Maintenance
10.3.6. Training and Consulting
10.3.7. Others (Metering and Billing)
10.4. Middle East Functions as a Service (FaaS) Market, by Application, 2016-2028(US$ Mn)
10.4.1. Overview
10.4.2. Web-based and Mobile Application
10.4.3. Research and Academic Application
10.5. Middle East Functions as a Service (FaaS) Market, by Deployment Model, 2016-2028(US$ Mn)
10.5.1. Overview
10.5.2. Public Cloud
10.5.3. Private Cloud
10.5.4. Hybrid Cloud
10.6. Middle East Functions as a Service (FaaS) Market, by Organization Size, 2016-2028(US$ Mn)
10.6.1. Overview
10.6.2. Small and Medium Enterprise (SME)
10.6.3. Large enterprise
10.7. Middle East Functions as a Service (FaaS) Market, by Industry Vertical, 2016-2028(US$ Mn)
10.7.1. Overview
10.7.2. BFSI
10.7.3. Telecommunication and ITES
10.7.4. Consumer Goods and Retail
10.7.5. Healthcare and Life Sciences
10.7.6. Government and Public Sector
10.7.7. Manufacturing
10.7.8. Media and Entertainment
10.7.9. Others
10.7.10.

11. Africa
11.1. Africa Functions as a Service (FaaS) Market, by Country, 2016-2028(US$ Mn)
11.1.1. South Africa
11.1.2. Egypt
11.1.3. Nigeria
11.1.4. Rest of Africa
11.2. Africa Functions as a Service (FaaS) Market, by User Type, 2016-2028(US$ Mn)
11.2.1. Overview
11.2.2. Developer-Centric FaaS
11.2.3. Operator-Centric FaaS
11.3. Africa Functions as a Service (FaaS) Market, by Service Type, 2016-2028(US$ Mn)
11.3.1. Overview
11.3.2. Automation and Integration Service
11.3.3. Microservice Monitoring and Management Service
11.3.4. API Management Service
11.3.5. Support and Maintenance
11.3.6. Training and Consulting
11.3.7. Others (Metering and Billing)
11.4. Africa Functions as a Service (FaaS) Market, by Application, 2016-2028(US$ Mn)
11.4.1. Overview
11.4.2. Web-based and Mobile Application
11.4.3. Research and Academic Application
11.5. Africa Functions as a Service (FaaS) Market, by Deployment Model, 2016-2028(US$ Mn)
11.5.1. Overview
11.5.2. Public Cloud
11.5.3. Private Cloud
11.5.4. Hybrid Cloud
11.6. Africa Functions as a Service (FaaS) Market, by Organization Size, 2016-2028(US$ Mn)
11.6.1. Overview
11.6.2. Small and Medium Enterprise (SME)
11.6.3. Large enterprise
11.7. Africa Functions as a Service (FaaS) Market, by Industry Vertical, 2016-2028(US$ Mn)
11.7.1. Overview
11.7.2. BFSI
11.7.3. Telecommunication and ITES
11.7.4. Consumer Goods and Retail
11.7.5. Healthcare and Life Sciences
11.7.6. Government and Public Sector
11.7.7. Manufacturing
11.7.8. Media and Entertainment
11.7.9. Others

12. Global
12.1. Global Functions as a Service (FaaS) Market, by User Type, 2016-2028(US$ Mn)
12.1.1. Overview
12.1.2. Developer-Centric FaaS
12.1.3. Operator-Centric FaaS
12.2. Global Functions as a Service (FaaS) Market, by Service Type, 2016-2028(US$ Mn)
12.2.1. Overview
12.2.2. Automation and Integration Service
12.2.3. Microservice Monitoring and Management Service
12.2.4. API Management Service
12.2.5. Support and Maintenance
12.2.6. Training and Consulting
12.2.7. Others (Metering and Billing)
12.3. Global Functions as a Service (FaaS) Market, by Application, 2016-2028(US$ Mn)
12.3.1. Overview
12.3.2. Web-based and Mobile Application
12.3.3. Research and Academic Application
12.4. Global Functions as a Service (FaaS) Market, by Deployment Model, 2016-2028(US$ Mn)
12.4.1. Overview
12.4.2. Public Cloud
12.4.3. Private Cloud
12.4.4. Hybrid Cloud
12.5. Global Functions as a Service (FaaS) Market, by Organization Size, 2016-2028(US$ Mn)
12.5.1. Overview
12.5.2. Small and Medium Enterprise (SME)
12.5.3. Large enterprise
12.6. Global Functions as a Service (FaaS) Market, by Industry Vertical, 2016-2028(US$ Mn)
12.6.1. Overview
12.6.2. BFSI
12.6.3. Telecommunication and ITES
12.6.4. Consumer Goods and Retail
12.6.5. Healthcare and Life Sciences
12.6.6. Government and Public Sector
12.6.7. Manufacturing
12.6.8. Media and Entertainment
12.6.9. Others
12.6.10.

13. Company Profiles
13.1. IBM
13.2. Google Inc.
13.3. Microsoft Corporation
13.4. Amazon Web Services
13.5. SAP SE
13.6. Dynatrace LLC
13.7. Infosys Ltd.
13.8. Rogue Wave Software Inc.
13.9. TIBCO Software Inc.
13.10. Fiorano Software and Affiliates
13.11. Others

List of Figures

FIG. 1 Global Functions as a Service (FaaS) Market: Research Methodology
FIG. 2 Market Size Estimation – Top Down & Bottom up Approach
FIG. 3 Global Functions as a Service (FaaS) Market Segmentation
FIG. 4 Global Functions as a Service (FaaS) Market, by User Type, 2021 (US$ Mn)
FIG. 5 Global Functions as a Service (FaaS) Market, by Service Type, 2021 (US$ Mn)
FIG. 6 Global Functions as a Service (FaaS) Market, by Application, 2021 (US$ Mn)
FIG. 7 Global Functions as a Service (FaaS) Market, by Deployment Model, 2021 (US$ Mn)
FIG. 8 Global Functions as a Service (FaaS) Market, by Organization Size, 2021 (US$ Mn)
FIG. 9 Global Functions as a Service (FaaS) Market, by Industry Vertical, 2021 (US$ Mn)
FIG. 10 Global Functions as a Service (FaaS) Market, by Geography, 2021 (US$ Mn)
FIG. 11 Attractive Investment Proposition, by User Type, 2021
FIG. 12 Attractive Investment Proposition, by Service Type, 2021
FIG. 13 Attractive Investment Proposition, by Application, 2021 (US$ Mn)
FIG. 14 Attractive Investment Proposition, by Deployment Model, 2021 (US$ Mn)
FIG. 15 Attractive Investment Proposition, by Organization Size, 2021 (US$ Mn)
FIG. 16 Attractive Investment Proposition, by Industry Vertical, 2021 (US$ Mn)
FIG. 17 Attractive Investment Proposition, by Geography, 2021
FIG. 18 Global Market Positioning of Key Functions as a Service (FaaS) Market Manufacturers, 2019
FIG. 19 Global Functions as a Service (FaaS) Market Value Contribution, By User Type, 2021 & 2028 (Value %)
FIG. 20 Global Functions as a Service (FaaS) Market, by Developer-Centric FaaS, Value, 2016-2028 (US$ Mn)
FIG. 21 Global Functions as a Service (FaaS) Market, by Operator-Centric FaaS, Value, 2016-2028 (US$ Mn)
FIG. 22 Global Functions as a Service (FaaS) Market Value Contribution, By Service Type, 2021 & 2028 (Value %)
FIG. 23 Global Functions as a Service (FaaS) Market, by Automation and Integration Service, Value, 2016-2028 (US$ Mn)
FIG. 24 Global Functions as a Service (FaaS) Market, by Microservice Monitoring and Management Service, Value, 2016-2028 (US$ Mn)
FIG. 25 Global Functions as a Service (FaaS) Market, by API Management Service, Value, 2016-2028 (US$ Mn)
FIG. 26 Global Functions as a Service (FaaS) Market, by Support and Maintenance, Value, 2016-2028 (US$ Mn)
FIG. 27 Global Functions as a Service (FaaS) Market, by Training and Consulting, Value, 2016-2028 (US$ Mn)
FIG. 28 Global Functions as a Service (FaaS) Market, by Others, Value, 2016-2028 (US$ Mn)
FIG. 29 Global Functions as a Service (FaaS) Market Value Contribution, By Application, 2021 & 2028 (Value %)
FIG. 30 Global Functions as a Service (FaaS) Market, by Web-based and Mobile Application, Value, 2016-2028 (US$ Mn)
FIG. 31 Global Functions as a Service (FaaS) Market, by Research and Academic Application, Value, 2016-2028 (US$ Mn)
FIG. 32 Global Functions as a Service (FaaS) Market, by Others (Stream Processing and Media Processing), Value, 2016-2028 (US$ Mn)
FIG. 33 Global Functions as a Service (FaaS) Market Value Contribution, By Deployment Model, 2021 & 2028 (Value %)
FIG. 34 Global Functions as a Service (FaaS) Market, by Public Cloud, Value, 2016-2028 (US$ Mn)
FIG. 35 Global Functions as a Service (FaaS) Market, by Private Cloud, Value, 2016-2028 (US$ Mn)
FIG. 36 Global Functions as a Service (FaaS) Market, by Hybrid Cloud, Value, 2016-2028 (US$ Mn)
FIG. 37 Global Functions as a Service (FaaS) Market Value Contribution, By Organization Size, 2021 & 2028 (Value %)
FIG. 38 Global Functions as a Service (FaaS) Market, by Small and Medium Enterprise (SME), Value, 2016-2028 (US$ Mn)
FIG. 39 Global Functions as a Service (FaaS) Market, by Large enterprise,Value, 2016-2028 (US$ Mn)
FIG. 40 Global Functions as a Service (FaaS) Market Value Contribution, By Industry Vertical, 2021 & 2028 (Value %)
FIG. 41 Global Functions as a Service (FaaS) Market, by BFSI, Value, 2016-2028 (US$ Mn)
FIG. 42 Global Functions as a Service (FaaS) Market, by Telecommunication and ITES,Value, 2016-2028 (US$ Mn)
FIG. 43 Global Functions as a Service (FaaS) Market, by Consumer Goods and Retail, Value, 2016-2028 (US$ Mn)
FIG. 44 Global Functions as a Service (FaaS) Market, by Healthcare and Life Sciences,Value, 2016-2028 (US$ Mn)
FIG. 45 Global Functions as a Service (FaaS) Market, by Government and Public Sector, Value, 2016-2028 (US$ Mn)
FIG. 46 Global Functions as a Service (FaaS) Market, by Manufacturing,Value, 2016-2028 (US$ Mn)
FIG. 47 Global Functions as a Service (FaaS) Market, by Media and Entertainment, Value, 2016-2028 (US$ Mn)
FIG. 48 Global Functions as a Service (FaaS) Market, by Others, Value, 2016-2028 (US$ Mn)
FIG. 49 U.S. Functions as a Service (FaaS) Market, 2016-2028 (US$ Mn)
FIG. 50 Canada Functions as a Service (FaaS) Market, 2016-2028 (US$ Mn)
FIG. 51 Mexico Functions as a Service (FaaS) Market, 2016-2028 (US$ Mn)
FIG. 52 U.K. Functions as a Service (FaaS) Market, 2016-2028 (US$ Mn)
FIG. 53 Germany Functions as a Service (FaaS) Market, 2016-2028 (US$ Mn)
FIG. 54 France Functions as a Service (FaaS) Market, 2016-2028 (US$ Mn)
FIG. 55 Italy Functions as a Service (FaaS) Market, 2016-2028 (US$ Mn)
FIG. 56 Spain Functions as a Service (FaaS) Market, 2016-2028 (US$ Mn)
FIG. 57 Russia Functions as a Service (FaaS) Market, 2016-2028 (US$ Mn)
FIG. 58 BENELUX Functions as a Service (FaaS) Market, 2016-2028 (US$ Mn)
FIG. 59 Poland Functions as a Service (FaaS) Market, 2016-2028 (US$ Mn)
FIG. 60 Austria Functions as a Service (FaaS) Market, 2016-2028 (US$ Mn)
FIG. 61 Rest of Europe Functions as a Service (FaaS) Market, 2016-2028 (US$ Mn)
FIG. 62 Japan Functions as a Service (FaaS) Market, 2016-2028 (US$ Mn)
FIG. 63 China Functions as a Service (FaaS) Market, 2016-2028 (US$ Mn)
FIG. 64 India Functions as a Service (FaaS) Market, 2016-2028 (US$ Mn)
FIG. 65 South Korea Functions as a Service (FaaS) Market, 2016-2028 (US$ Mn)
FIG. 66 Australia Functions as a Service (FaaS) Market, 2016-2028 (US$ Mn)
FIG. 67 Southeast Asia Functions as a Service (FaaS) Market, 2016-2028 (US$ Mn)
FIG. 68 Rest of Asia Pacific Functions as a Service (FaaS) Market, 2016-2028 (US$ Mn)
FIG. 69 Middle East & Africa Functions as a Service (FaaS) Market, 2016-2028 (US$ Mn)
FIG. 70 South Africa Functions as a Service (FaaS) Market, 2016-2028 (US$ Mn)
FIG. 71 Nigeria Functions as a Service (FaaS) Market, 2016-2028 (US$ Mn)
FIG. 72 Egypt Functions as a Service (FaaS) Market, 2016-2028 (US$ Mn)
FIG. 73 GCC Functions as a Service (FaaS) Market, 2016-2028 (US$ Mn)
FIG. 74 Israel Functions as a Service (FaaS) Market, 2016-2028 (US$ Mn)
FIG. 75 Latin America Functions as a Service (FaaS) Market, 2016-2028 (US$ Mn)
FIG. 76 Brazil Functions as a Service (FaaS) Market, 2016-2028 (US$ Mn)
FIG. 77 Argentina Functions as a Service (FaaS) Market, 2016-2028 (US$ Mn)
FIG. 78 Colombia Functions as a Service (FaaS) Market, 2016-2028 (US$ Mn)
FIG. 79 Peru Functions as a Service (FaaS) Market, 2016-2028 (US$ Mn)
FIG. 80 Chile Functions as a Service (FaaS) Market, 2016-2028 (US$ Mn)

List of Tables

TABLE 1 Market Snapshot: Global Functions as a Service (FaaS) Market
TABLE 2 Global Functions as a Service (FaaS) Market, by User Type, 2016-2028 (US$ Mn)
TABLE 3 Global Functions as a Service (FaaS) Market, by Service Type, 2016-2028 (US$ Mn)
TABLE 4 Global Functions as a Service (FaaS) Market, by Application, 2016-2028 (US$ Mn)
TABLE 5 Global Functions as a Service (FaaS) Market, by Deployment Model, 2016-2028 (US$ Mn)
TABLE 6 Global Functions as a Service (FaaS) Market, by Organization Size, 2016-2028 (US$ Mn)
TABLE 7 Global Functions as a Service (FaaS) Market, by Organization Size, 2016-2028 (US$ Mn)
TABLE 8 Global Functions as a Service (FaaS) Market, by Geography, 2016-2028 (US$ Mn)
TABLE 9 North America Functions as a Service (FaaS) Market, by User Type, 2016-2028 (US$ Mn)
TABLE 10 North America Functions as a Service (FaaS) Market, by Service Type, 2016-2028 (US$ Mn)
TABLE 11 North America Functions as a Service (FaaS) Market, by Application, 2016-2028 (US$ Mn)
TABLE 12 North America Functions as a Service (FaaS) Market, by Deployment Model, 2016-2028 (US$ Mn)
TABLE 13 North America l Functions as a Service (FaaS) Market, by Organization Size, 2016-2028 (US$ Mn)
TABLE 14 North America Functions as a Service (FaaS) Market, by Organization Size, 2016-2028 (US$ Mn)
TABLE 15 North America Functions as a Service (FaaS) Market, by Country, 2016-2028 (US$ Mn)
TABLE 16 Europe Functions as a Service (FaaS) Market, by User Type, 2016-2028 (US$ Mn)
TABLE 17 Europe Functions as a Service (FaaS) Market, by Service Type, 2016-2028 (US$ Mn)
TABLE 18 Europe Functions as a Service (FaaS) Market, by Application, 2016-2028 (US$ Mn)
TABLE 19 Europe Functions as a Service (FaaS) Market, by Deployment Model, 2016-2028 (US$ Mn)
TABLE 20 Europe Functions as a Service (FaaS) Market, by Organization Size, 2016-2028 (US$ Mn)
TABLE 21 Europe Functions as a Service (FaaS) Market, by Organization Size, 2016-2028 (US$ Mn)
TABLE 22 Europe Functions as a Service (FaaS) Market, by Country/Region, 2016-2028 (US$ Mn)
TABLE 23 Asia Pacific Functions as a Service (FaaS) Market, by User Type, 2016-2028 (US$ Mn)
TABLE 24 Asia Pacific Functions as a Service (FaaS) Market, by Service Type, 2016-2028 (US$ Mn)
TABLE 25 Asia Pacific Functions as a Service (FaaS) Market, by Application, 2016-2028 (US$ Mn)
TABLE 26 Asia Pacific Functions as a Service (FaaS) Market, by Deployment Model, 2016-2028 (US$ Mn)
TABLE 27 Asia Pacific Functions as a Service (FaaS) Market, by Organization Size, 2016-2028 (US$ Mn)
TABLE 28 Asia Pacific Functions as a Service (FaaS) Market, by Organization Size, 2016-2028 (US$ Mn)
TABLE 29 Asia Pacific Functions as a Service (FaaS) Market, by Country/Region, 2016-2028 (US$ Mn)
TABLE 30 Latin America Functions as a Service (FaaS) Market, by User Type, 2016-2028 (US$ Mn)
TABLE 31 Latin America Functions as a Service (FaaS) Market, by Service Type, 2016-2028 (US$ Mn)
TABLE 32 Latin America Functions as a Service (FaaS) Market, by Application, 2016-2028 (US$ Mn)
TABLE 33 Latin America Functions as a Service (FaaS) Market, by Deployment Model, 2016-2028 (US$ Mn)
TABLE 34 Latin America Functions as a Service (FaaS) Market, by Organization Size, 2016-2028 (US$ Mn)
TABLE 35 Latin America Functions as a Service (FaaS) Market, by Organization Size, 2016-2028 (US$ Mn)
TABLE 36 Latin America Functions as a Service (FaaS) Market, by Country/Region, 2016-2028 (US$ Mn)
TABLE 37 Middle East Functions as a Service (FaaS) Market, by User Type, 2016-2028 (US$ Mn)
TABLE 38 Middle East Functions as a Service (FaaS) Market, by Service Type, 2016-2028 (US$ Mn)
TABLE 39 Middle East Functions as a Service (FaaS) Market, by Application, 2016-2028 (US$ Mn)
TABLE 40 Middle East Functions as a Service (FaaS) Market, by Deployment Model, 2016-2028 (US$ Mn)
TABLE 41 Middle East l Functions as a Service (FaaS) Market, by Organization Size, 2016-2028 (US$ Mn)
TABLE 42 Middle East Functions as a Service (FaaS) Market, by Organization Size, 2016-2028 (US$ Mn)
TABLE 43 Middle East Functions as a Service (FaaS) Market, by Country/Region, 2016-2028 (US$ Mn)
TABLE 44 Africa Functions as a Service (FaaS) Market, by User Type, 2016-2028 (US$ Mn)
TABLE 45 Africa Functions as a Service (FaaS) Market, by Service Type, 2016-2028 (US$ Mn)
TABLE 46 Africa Functions as a Service (FaaS) Market, by Application, 2016-2028 (US$ Mn)
TABLE 47 Africa Functions as a Service (FaaS) Market, by Deployment Model, 2016-2028 (US$ Mn)
TABLE 48 Africa Functions as a Service (FaaS) Market, by Organization Size, 2016-2028 (US$ Mn)
TABLE 49 Africa Functions as a Service (FaaS) Market, by Organization Size, 2016-2028 (US$ Mn)
TABLE 50 Africa Functions as a Service (FaaS) Market, by Country/Region, 2016-2028 (US$ Mn)

Frequently Asked Questions

How does COVID-19 Impact the global Functions as a Service (FaaS) market?

Due to the epidemic, several businesses switched to work-from-home policies, which increased the load on online data. Cloud computing had a big uptick as a result of giving businesses the flexibility, scalability, and other benefits them required. In the upcoming years, it is projected that the Function as a Service (FaaS) market will continue to develop rapidly even when businesses start operating from offices again.

Which is the leading market for Functions as a Service (FaaS)?

North America accounted for the highest share in the global Functions as a Service (FaaS) market.

What are the key drivers for the growth of the Functions as a Service (FaaS) market?

The market is expanding as a result of the increased need for solutions to server management problems, the explosive growth of the app development industry, and the transition from DevOps to serverless computing are the major factors driving the growth of the market.

Which is the major segment in Functions as a Service (FaaS) Market by Deployment Model?

Hybrid Cloud had a major share in 2021 with around 35% of the market revenue share.

Which is the major segment in Functions as a Service (FaaS) Market by Vertical?

The Healthcare and Life Sciences segment had a major share in the global market in 2021.

South Korea Wifi Chipset Market

Published:
Report ID: 36535

Saudi Arabia Managed Security Services Market

Published:
Report ID: 36393

Microwave Oven Market

Published:
Report ID: 36314

Artificial Intelligence in Supply Chain Market

Published:
Report ID: 36184

China Wifi Chipset Market

Published:
Report ID: 35900

Inkjet Coders Market

Published:
Report ID: 6669

Rich Communication Services Market

Published:
Report ID: 35774

Middle East and Africa Real-Time Payments Market

Published:
Report ID: 35770

Vietnam Managed Security Services (MSS) Market

Published:
Report ID: 35766

Middle East and Africa EdTech and Smart Classroom Market

Published:
Report ID: 35756

Digital Business Support System (DBSS) Market

Published:
Report ID: 35732

Purchase Options

$2999
Delivery Format: Excel.
$4999
Designed for the individual purchaser.
$6999
Users located at a single corporate site or regional office.
$7999
Allowed for unlimited sharing globally within one company.
Smallform of Sample request

Have a question?

User Profile

Don’t settle for less – trust Mitul to help you find the best solution.

Report delivery within 24 to 48 hours

– Other Info –

What people say?-

User Review

I am very impressed with the information in this report. The author clearly did their research when they came up with this product and it has already given me a lot of ideas.

Jana Schmidt
CEDAR CX Technologies

– Connect with us –

Phone

+91 6232 49 3207


support

24/7 Research Support


sales@credenceresearch.com

– Research Methodology –

Going beyond the basics: advanced techniques in research methodology

– Trusted By –

Pepshi, LG, Nestle
Motorola, Honeywell, Johnson and johnson
LG Chem, SIEMENS, Pfizer
Unilever, Samsonite, QIAGEN