
Market Overview
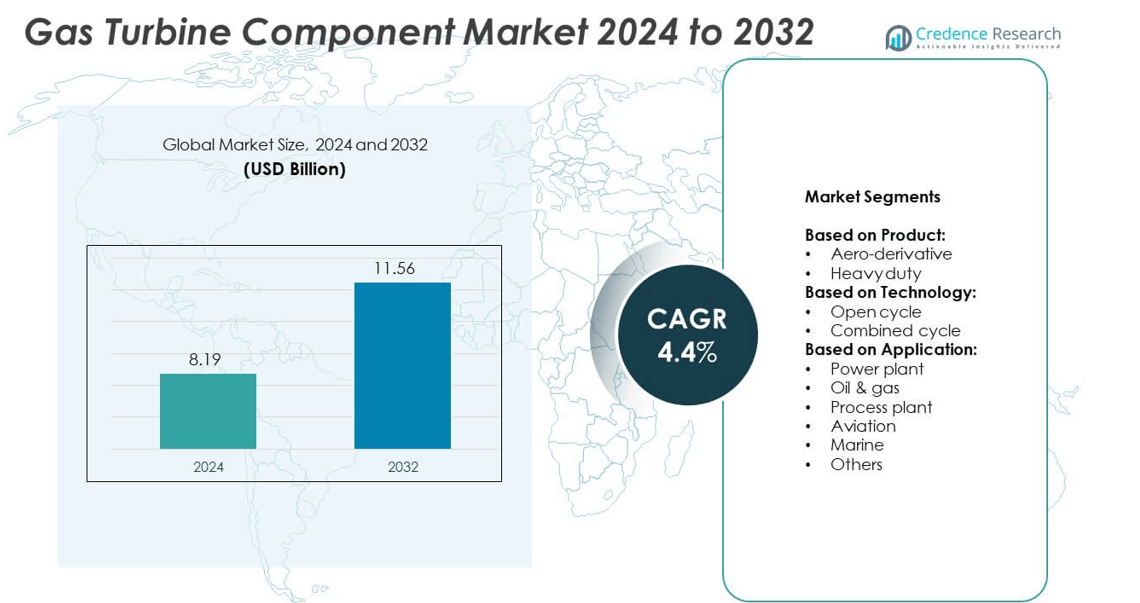
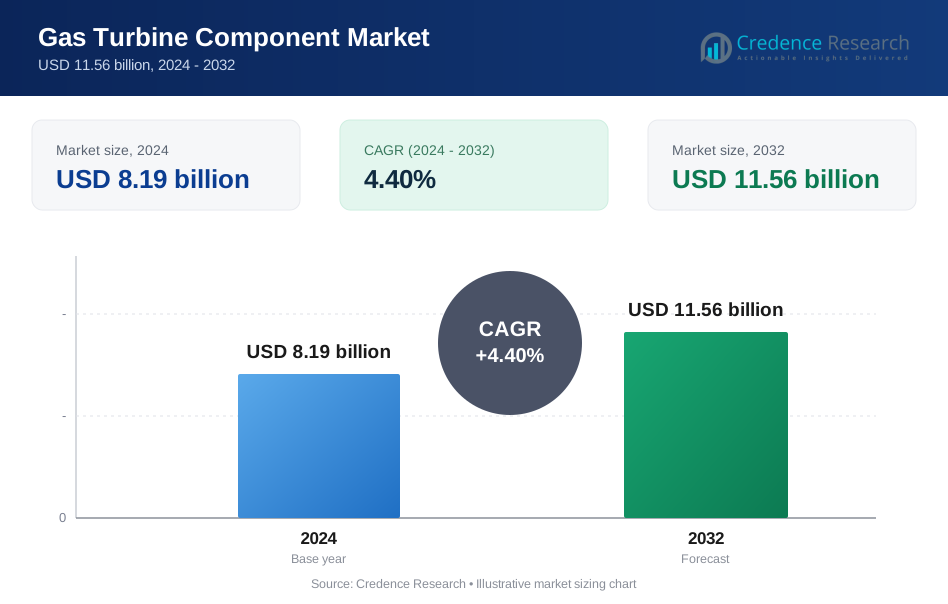
The gas turbine component market was valued at USD 8.19 billion in 2024 and is projected to reach USD 11.56 billion by 2032, growing at a CAGR of 4.4% during the forecast period.
| REPORT ATTRIBUTE | DETAILS |
|---|---|
| Historical Period | 2020-2023 |
| Base Year | 2024 |
| Forecast Period | 2025-2032 |
| Gas Turbine Component Market Size 2024 | USD 8.19 billion |
| Gas Turbine Component Market, CAGR | 4.4% |
| Gas Turbine Component Market Size 2032 | USD 11.56 billion |
The gas turbine component market grows with rising power demand, renewable integration, and efficiency upgrades. Governments invest in combined cycle plants to replace coal-based capacity and meet emission targets. Advanced materials and thermal coatings improve turbine performance and durability. Digital monitoring and predictive maintenance reduce downtime and optimize operations. Industrialization in emerging economies fuels demand for reliable power solutions. Rapid adoption of distributed generation and cogeneration systems supports market expansion across utilities, oil and gas, and industrial sectors worldwide.
North America leads the gas turbine component market with strong investment in power plant upgrades and combined cycle projects. Europe focuses on decarbonization and adoption of hydrogen-ready turbines to meet climate goals. Asia-Pacific shows fastest growth driven by industrial expansion and urbanization. Key players such as Siemens Energy, Mitsubishi Power, GE Vernova, and Wartsila focus on advanced materials, digital solutions, and service agreements to strengthen their regional presence and meet demand for reliable and efficient power generation solutions.
Market Insights
- The gas turbine component market was valued at USD 8.19 billion in 2024 and is projected to reach USD 11.56 billion by 2032, growing at a CAGR of 4.4%.
- Rising electricity demand and replacement of coal-fired plants with gas-based generation drive strong market momentum.
- Advanced materials, thermal coatings, and additive manufacturing improve turbine efficiency and component durability.
- The market is competitive with players focusing on innovation, digital monitoring, and long-term service agreements to retain customers.
- High capital costs and fluctuations in natural gas prices act as key restraints, slowing new project investments.
- North America leads with strong infrastructure upgrades, while Asia-Pacific shows fastest growth driven by industrialization and power capacity expansion.
- Growing focus on hydrogen-ready turbines and hybrid systems creates future opportunities, aligning with global decarbonization and renewable integration efforts.
Market Drivers
Rising Global Power Demand and Capacity Expansion Projects
The gas turbine component market benefits from surging global electricity consumption and infrastructure upgrades. Governments and utilities focus on adding power generation capacity to meet rising demand. Gas turbines remain vital in thermal and combined cycle plants due to high efficiency and flexible operation. Expanding natural gas infrastructure strengthens the market by ensuring fuel availability. Growing adoption of distributed power systems further supports demand for compact and modular turbines. It helps meet peak power requirements and reduces transmission losses.
- For instance, GE Vernova’s 9HA.01 gas turbine delivers 448 MW net output, can ramp up from cold to full in under 30 minutes, and is 50% hydrogen-capable
Shift Toward Cleaner Energy and Lower Emission Technologies
Stringent emission norms drive investment in advanced turbine components. Power producers choose gas turbines to replace coal-fired units and lower greenhouse gas emissions. Modern turbines integrate low-NOx combustors and high-performance materials to meet regulations. It encourages manufacturers to develop durable and heat-resistant parts. Industrial sectors adopt cleaner energy sources to reduce their carbon footprint. Governments support gas-based power projects through favorable policies and incentives.
- For instance, Siemens Energy’s SGT-800 turbine offers power outputs of 57.0 MW(e) in simple cycle mode, exhaust mass flow near 136.6 kg/s, and less than 15 ppmvd NOₓ emissions under certain conditions
Rapid Technological Advancements and Efficiency Improvements
The gas turbine component market grows with innovation in aerodynamics and thermal management. Manufacturers focus on advanced cooling systems, coatings, and materials to boost efficiency. Digital monitoring systems enable predictive maintenance and minimize downtime. It extends component life and reduces operational costs for plant operators. OEMs invest in additive manufacturing to create complex, lightweight designs. These improvements enhance turbine performance in both base-load and peaking operations.
Growing Industrialization and Distributed Generation Demand
Industrial expansion across developing economies fuels demand for reliable power solutions. Gas turbines offer quick start-up and flexible load handling for industrial users. The market benefits from rising adoption of cogeneration and combined heat and power (CHP) systems. It allows facilities to generate both electricity and steam efficiently. Growth of microgrids and decentralized power networks creates opportunities for small and medium gas turbines. Rising urbanization further strengthens the need for uninterrupted energy supply.
Market Trends
Adoption of Advanced Materials and Coating Technologies
The gas turbine component market experiences strong demand for advanced alloys and ceramic coatings. These materials enhance resistance to high temperatures and corrosion in harsh operating conditions. Manufacturers focus on thermal barrier coatings to improve turbine life and reliability. It supports higher firing temperatures, boosting overall plant efficiency. Research initiatives target lightweight components to reduce stress on rotating parts. Integration of 3D-printed parts accelerates production and design flexibility.
- For instance, Mitsubishi Power’s H-100 Series gas turbines deliver 105 to 116 MW output in simple cycle mode, and 150 to 350 MW in combined cycle configurations.
Integration of Digitalization and Predictive Maintenance Solutions
Digital transformation shapes the gas turbine component market with smart monitoring systems. Operators deploy IoT-enabled sensors and analytics to track real-time performance. Predictive maintenance reduces unplanned outages and optimizes service schedules. It helps improve asset utilization and lowers maintenance costs. Cloud-based platforms support remote diagnostics and fleet management. Adoption of digital twins allows simulation of turbine behavior under different conditions.
- For instance, Ansaldo Energia’s AE94.3A turbines have accumulated over 5 million equivalent operating hours globally.
Growing Popularity of Combined Heat and Power Applications
Industrial and commercial users increasingly install CHP systems to maximize energy efficiency. The gas turbine component market benefits from rising demand for cogeneration solutions. CHP systems provide simultaneous electricity and thermal energy, reducing fuel consumption. It strengthens energy security and reduces operational expenses for end-users. Policies encouraging efficient energy use accelerate CHP installations in manufacturing hubs. Rising focus on waste heat recovery also drives component upgrades.
Shift Toward Flexible and Modular Turbine Designs
Manufacturers develop modular turbine components to support rapid installation and scalability. These designs allow easy upgrades and replacement of critical parts. The gas turbine component market grows with demand for compact solutions for distributed power. It enables quick deployment in remote areas and industrial zones. Modular systems reduce downtime during maintenance and improve lifecycle cost efficiency. Rising need for flexible generation to balance renewable energy integration drives adoption.
Market Challenges Analysis
High Capital Investment and Complex Maintenance Requirements
The gas turbine component market faces challenges due to significant upfront capital costs. Power producers hesitate to invest in new turbines without long-term demand certainty. High costs of advanced alloys, coatings, and precision manufacturing add pressure to budgets. It becomes difficult for smaller utilities and industrial operators to justify large expenditures. Maintenance requirements for turbines are complex and require skilled personnel. Extended downtimes during overhauls can disrupt power supply and increase operational costs.
Volatility in Natural Gas Prices and Competitive Pressure from Renewables
Fluctuating natural gas prices create uncertainty for project planning and cost forecasting. The gas turbine component market is sensitive to changes in fuel economics that affect power generation costs. It reduces attractiveness compared to low-cost renewable energy sources in some regions. Rising penetration of wind and solar energy limits new turbine installations for base-load power. Environmental groups push for faster transition away from fossil-based generation. Regulatory risks and carbon reduction targets can slow investment in gas-fired infrastructure.
Market Opportunities
Expansion of Renewable Integration and Flexible Power Solutions
The gas turbine component market holds strong opportunities with rising renewable energy integration. Gas turbines provide quick ramp-up capability to balance intermittent wind and solar output. It enables grid operators to maintain stability and meet peak demand efficiently. Flexible turbines paired with energy storage solutions create hybrid power systems. Demand for fast-start turbines grows in regions with high renewable penetration. Government incentives for reliable backup capacity encourage investment in advanced turbine components.
Growth in Emerging Economies and Industrial Applications
Rapid industrialization in Asia-Pacific, Middle East, and Africa fuels need for reliable power. The gas turbine component market benefits from expansion of combined cycle plants and distributed generation. It supports industrial clusters, refineries, and manufacturing zones seeking uninterrupted power supply. Rising urban population creates demand for efficient electricity infrastructure. Investments in LNG import terminals secure fuel supply for gas-based power projects. Opportunities also arise from modernization programs for aging power plants worldwide.
Market Segmentation Analysis:
By Product:
The gas turbine component market is divided into aero-derivative and heavy-duty products. Aero-derivative turbines are preferred for mobile and flexible power generation due to their lightweight design and quick start-up capabilities. These turbines serve peak load and emergency power applications efficiently. Heavy-duty turbines dominate large-scale power plants, offering high output and fuel efficiency for base-load operations. It supports continuous operations in utilities and industrial sectors where reliability is critical. Growing investments in combined heat and power (CHP) systems favor the use of both product types depending on capacity requirements.
- For instance, General Electric’s LM2500+G4 turbine delivers 35,320 kW (≈ 35.3 MW) shaft power in marine/industrial applications with a thermal efficiency around 39.3% at ISO conditions
By Technology:
The market is segmented into open cycle and combined cycle technologies. Open cycle turbines are valued for fast start-up and lower installation costs, making them suitable for emergency and peak load needs. Combined cycle technology leads demand due to its superior efficiency and ability to utilize exhaust heat for additional power generation. It reduces overall fuel consumption and operational costs for power producers. Rising focus on decarbonization encourages investment in combined cycle projects worldwide. Growth of renewable energy further drives demand for flexible and efficient cycle systems.
- For instance, Rolls-Royce’s MT30 marine gas turbine produces 36 MW nominal power output, with capability up to 40 MW under moderate inlet temperature conditions.
By Application:
Key applications include power plant, oil and gas, process plant, aviation, marine, and others. Power plants hold a dominant share due to growing demand for electricity and grid stability. Oil and gas applications rely on gas turbines for mechanical drive and offshore platform power generation. Process plants adopt turbines for cogeneration and continuous power needs. It also plays a crucial role in aviation, where aero-engines remain a major consumer of turbine components. Marine applications gain traction with adoption of gas turbines for naval and commercial vessels. Emerging applications in decentralized and hybrid power systems create further growth opportunities across all segments.
Segments:
Based on Product:
- Aero-derivative
- Heavy duty
Based on Technology:
- Open cycle
- Combined cycle
Based on Application:
- Power plant
- Oil & gas
- Process plant
- Aviation
- Marine
- Others
Based on the Geography:
- North America
- U.S.
- Canada
- Mexico
- Europe
- UK
- France
- Germany
- Italy
- Spain
- Russia
- Belgium
- Netherlands
- Austria
- Sweden
- Poland
- Denmark
- Switzerland
- Rest of Europe
- Asia Pacific
- China
- Japan
- South Korea
- India
- Australia
- Thailand
- Indonesia
- Vietnam
- Malaysia
- Philippines
- Taiwan
- Rest of Asia Pacific
- Latin America
- Brazil
- Argentina
- Peru
- Chile
- Colombia
- Rest of Latin America
- Middle East
- UAE
- KSA
- Israel
- Turkey
- Iran
- Rest of Middle East
- Africa
- Egypt
- Nigeria
- Algeria
- Morocco
- Rest of Africa
Regional Analysis
North America
North America holds a market share of 32% in the gas turbine component market, driven by strong demand for efficient power generation systems and modernization of aging power infrastructure. The region benefits from widespread availability of natural gas and investment in combined cycle power plants. It supports replacement of coal-fired capacity with gas-based generation, meeting emission regulations. The United States leads the market with continuous adoption of high-efficiency turbines in utility and industrial applications. Canada contributes through expansion of distributed power projects and oil sands operations that require reliable energy. Technological innovation and digital monitoring systems deployed across plants strengthen aftermarket component demand. Growing focus on grid reliability and integration of renewables fuels adoption of flexible and fast-start turbines across the region.
Europe
Europe accounts for 28% of the gas turbine component market, supported by rapid energy transition policies and strong decarbonization targets. Countries including Germany, the UK, France, and Italy actively replace coal power plants with gas-based and hybrid energy systems. It helps balance fluctuating renewable output and ensures stable electricity supply. The region focuses on high-efficiency combined cycle plants to reduce carbon emissions and comply with EU climate goals. Demand also rises from cogeneration plants serving industrial hubs and district heating networks. OEMs and component suppliers invest in advanced coating technologies and predictive maintenance solutions to meet strict efficiency requirements. Growth in hydrogen blending initiatives further boosts demand for next-generation turbine components capable of handling alternative fuels.
Asia-Pacific
Asia-Pacific holds a market share of 25%, emerging as the fastest-growing region due to rapid industrialization and urbanization. China and India drive major demand with large-scale power plant construction and modernization programs. It supports expansion of combined cycle capacity to meet surging electricity consumption. Southeast Asian nations invest in gas import terminals and pipeline networks to secure long-term fuel supply for turbines. Industrial sectors adopt gas turbines for cogeneration and captive power solutions to ensure uninterrupted operations. Japan and South Korea focus on upgrading older turbines with digital solutions to enhance performance and efficiency. The region also witnesses rising adoption of distributed generation systems and microgrids in remote and island areas.
Middle East & Africa
Middle East & Africa command 10% of the gas turbine component market, led by demand from oil and gas operations and independent power projects. Gulf countries invest heavily in gas-fired power plants to support population growth and industrial expansion. It drives strong demand for heavy-duty turbines and aftermarket components. African nations prioritize electrification projects that include modular and small gas turbines to improve rural access. Investment in LNG infrastructure supports steady fuel supply for power generation. The region also invests in turbines capable of operating in high-temperature environments, driving need for advanced cooling and coating solutions. OEMs partner with local service providers to offer maintenance and training support, strengthening market penetration.
Latin America
Latin America holds a market share of 5%, supported by power sector reforms and diversification of energy sources. Brazil, Mexico, and Argentina lead adoption of gas turbines in both utility-scale and industrial projects. It encourages investment in combined cycle plants to improve energy efficiency and reduce reliance on hydropower during droughts. Industrial hubs in Mexico adopt gas turbines for cogeneration and export-oriented manufacturing facilities. Rising urbanization drives demand for reliable power infrastructure in growing cities. Component suppliers focus on providing cost-effective solutions and long-term service agreements to address budget constraints. Government initiatives to expand natural gas pipeline networks strengthen the region’s potential for gas-based power growth.
Key Player Analysis
- Solar Turbines
- Kawasaki Heavy Industries
- Doncasters Group
- MTU Aero Engines
- Woodward
- Ansaldo Energia
- Sulzer
- Bharat Heavy Electricals Limited
- IHI Corporation
- Siemens Energy
- Rolls-Royce
- Doosan
- MAN Energy Solutions
- Precision Castparts
- Parker Hannifin
- Mitsubishi Power
- GE Vernova
- Wartsila
- Chromalloy Gas Turbine
- Baker Hughes
Competitive Analysis
The gas turbine component market is highly competitive with leading players including Solar Turbines, Kawasaki Heavy Industries, Doncasters Group, MTU Aero Engines, Woodward, Ansaldo Energia, Sulzer, Bharat Heavy Electricals Limited, IHI Corporation, Siemens Energy, Rolls-Royce, Doosan, MAN Energy Solutions, Precision Castparts, Parker Hannifin, Mitsubishi Power, GE Vernova, Wartsila, Chromalloy Gas Turbine, and Baker Hughes. These companies focus on developing advanced turbine blades, vanes, and combustion components to enhance efficiency and meet strict emission norms. Strong R&D investment supports innovation in thermal barrier coatings, ceramic matrix composites, and additive manufacturing technologies. Many players expand their aftermarket service networks to capture long-term maintenance contracts and improve lifecycle support. Strategic partnerships with utilities and EPC firms strengthen market presence and ensure steady order flow. Digitalization and predictive maintenance solutions are increasingly integrated into product offerings to reduce downtime and operational costs. Companies also target emerging economies where demand for power generation equipment is rising rapidly. Sustainability and hydrogen-ready solutions remain a major focus to align with global decarbonization targets. Competition drives continuous improvement in turbine performance, fuel flexibility, and cost efficiency, ensuring strong positioning across power generation, oil and gas, and industrial applications.
Recent Developments
- In 2024, Siemens Energy and UK utility SSE agreed to develop a 600 MW gas turbine capable of operating on 100% hydrogen.
- In 2024, GE Vernova completed acquisition of the remaining 55% stake in their joint venture GESAT in Saudi Arabia, making GE Vernova the sole owner.
- In 2023, Sulzer, in partnership with Crosstown H2R, unveiled advanced hydrogen combustion technology for aeroderivative, industrial, and power generation gas turbines aimed at decarbonization and flexible fuel use, including 100% hydrogen capability.
Report Coverage
The research report offers an in-depth analysis based on Product, Technology, Application and Geography. It details leading market players, providing an overview of their business, product offerings, investments, revenue streams, and key applications. Additionally, the report includes insights into the competitive environment, SWOT analysis, current market trends, as well as the primary drivers and constraints. Furthermore, it discusses various factors that have driven market expansion in recent years. The report also explores market dynamics, regulatory scenarios, and technological advancements that are shaping the industry. It assesses the impact of external factors and global economic changes on market growth. Lastly, it provides strategic recommendations for new entrants and established companies to navigate the complexities of the market.
Future Outlook
- The gas turbine component market will see steady growth with focus on efficiency upgrades.
- Demand for low-emission turbines will rise with stricter environmental regulations worldwide.
- Advanced materials and coatings will play a major role in extending component life.
- Digital monitoring and predictive maintenance adoption will reduce unplanned downtime.
- Combined cycle power plants will continue to dominate new installations for efficiency gains.
- Emerging economies will drive demand through rapid industrialization and power infrastructure expansion.
- Hydrogen-ready turbines will gain traction to support global decarbonization goals.
- Aftermarket services and component refurbishment will become a key revenue stream for suppliers.
- Distributed power systems and microgrids will create opportunities for small gas turbines.
- OEM partnerships with technology providers will accelerate development of next-generation turbine designs.
Request a Free Sample
Fill in your details and we'll send you a free sample report.
- Sample data tables & charts
- Research methodology
Need a Custom Version of This Report?
Tailor the scope, geography, or segments to your exact requirements.
- Custom geography or segment scope
- Direct access to our analyst team
Frequently Asked Questions
What is the current market size for Gas Turbine Component market, and what is its projected size in 2032?
Which Gas Turbine Component market segment held the largest share in 2024?
What are the primary factors fueling the growth of the Gas Turbine Component market?
Who are the leading companies in the Gas Turbine Component Market?
Table of Content
Chapter 1. Report Introduction
- 1.1 Report Description & Purpose
- 1.1.1 Report Title & Market Definition
- 1.1.2 Unique Selling Propositions (USP) & Key Differentiators
- 1.1.3 Value Proposition for Stakeholders
- 1.2 Research Objectives
- 1.2.1 Market Sizing Objectives (Volume & Revenue)
- 1.2.2 Segmentation Objectives
- 1.2.3 Competitive Intelligence Objectives
- 1.2.4 Forecast & Scenario Objectives
- 1.3 Report Scope
- 1.3.1 Gas Turbine Component Scope – Types & Subtypes Covered
- 1.3.2 Geographic Scope – Regions & Countries Covered
- 1.3.3 Historical Period, Base Year & Forecast Period (2024; forecast to 2032)
- 1.3.4 Inclusions & Exclusions
- 1.4 HS Code & Classification Framework
- 1.5 Currency, Units & Pricing Basis
- 1.6 Target Stakeholders
- 1.7 Limitations & Assumptions
Chapter 2. Executive Summary
- 2.1 Global Gas Turbine Component Market Snapshot
- 2.1.1 Market Size – Historical (2024) & Forecast (2024-2032) (2024: USD 8.19 billion → 2032: USD 11.56 billion)
- 2.1.2 Volume & Revenue – Global Totals
- 2.1.3 Key Market Highlights – Top Five Facts
- 2.2 Gas Turbine Component Market Segmentation Snapshot
- 2.2.1 Market Split by Region – 2024 vs. 2032
- 2.3 Competitive Snapshot
- 2.3.1 Top 10 Players by Revenue Share – 2024
- 2.3.2 Top 10 Players by Volume Share – 2024
- 2.3.3 Recent Strategic Developments (18-Month Summary)
- 2.4 Key Investment Highlights & Strategic Conclusions
Chapter 3. Gas Turbine Component Market Dynamics & Industry Analysis
- 3.1 Market Overview & Context
- 3.1.1 Gas Turbine Component Market Position in the Broader Automotive Value Chain
- 3.1.2 OEM vs. Replacement Market Dynamics
- 3.1.3 Market Maturity & Development Stage by Region
- 3.2 Gas Turbine Component Market Drivers
- 3.3 Gas Turbine Component Market Restraints & Challenges
- 3.4 Gas Turbine Component Market Opportunities
- 3.5 Porter's Five Forces Analysis
- 3.5.1 Threat of New Entrants
- 3.5.2 Bargaining Power of Suppliers
- 3.5.3 Bargaining Power of Buyers
- 3.5.4 Threat of Substitutes
- 3.5.5 Competitive Rivalry – Intensity Assessment
- 3.6 Gas Turbine Component Value Chain Analysis
- 3.6.1 Upstream – Raw Material/Input Suppliers
- 3.6.1.1 Raw Material/Input 1
- 3.6.1.2 Raw Material/Input 2
- 3.6.1.3 Raw Material/Input 3
- 3.6.2 Midstream – Production/Manufacturing/Service Delivery
- 3.6.2.1 Production/Process Overview
- 3.6.2.2 Key Facility Locations & Capacity by Manufacturer
- 3.6.3 Downstream – Distribution & End Consumer
- 3.6.3.1 Primary Channel – B2B/OEM
- 3.6.3.2 Secondary Channels – Dealer, Retail, Online, Direct
- 3.6.4 Value Chain Profitability Analysis
- 3.6.1 Upstream – Raw Material/Input Suppliers
- 3.7 PESTEL Analysis
- 3.7.1 Political Factors
- 3.7.2 Economic Factors
- 3.7.3 Social Factors
- 3.7.4 Technological Factors
- 3.7.5 Environmental Factors
- 3.7.6 Legal Factors
- 3.8 Gas Turbine Component Supply Chain Analysis
- 3.8.1 Raw Material/Input Supply Risk Assessment
- 3.8.2 Manufacturing Concentration Risk (Geographic Exposure)
- 3.8.3 Trade Disruption Impact Analysis
- 3.9 Regulatory & Policy Landscape
Note: The regulatory and policy landscape section covers regulations based on their applicability to the market, Gas Turbine Component category, geography, and scope of the study. Only regulatory frameworks with a material impact on operations, compliance, trade, sustainability, or market access are analyzed in detail.
Chapter 4. Key Investment Pockets & Opportunity Analysis
- 4.1 Gas Turbine Component Market Attractiveness Analysis
- 4.1.1 By Region – Investment Attractiveness Matrix (Volume × CAGR)
- 4.2 Absolute Revenue Growth Opportunity
- 4.2.1 By Region – Absolute USD Growth Through 2032
- 4.3 Incremental Volume Opportunity
- 4.3.1 By Region – Incremental Volume Through 2032
- 4.3.2 Segment – Incremental Volume
- 4.4 Emerging Submarket Opportunity Deep Dive (Subject to Applicability)
- 4.5 Emerging Market Opportunity Scorecards
- 4.5.1 United States
- 4.5.2 Europe
- 4.5.3 Asia
- 4.5.4 Middle East & Africa
Note: Emerging Market Opportunity Scorecards will be included based on relevance and strategic importance. Regions listed are indicative and may vary depending on data availability and market dynamics.
Chapter 5. Gas Turbine Component Import-Export Analysis & Trade Flows
- 5.1 Global Trade Overview
- 5.1.1 Global Export Value by Country (2024)
- 5.1.2 Global Export Volume by Country (2024)
- 5.1.3 Global Import Value by Country (2024)
- 5.1.4 Global Import Volume by Country (2024)
- 5.1.5 Net Trade Balance by Country (2024)
- 5.2 Export Analysis – Segment
- 5.2.1 Type 1 (HS Code)
- 5.2.2 Type 2 (HS Code)
- 5.2.3 Type 3 (HS Code)
- 5.2.4 Type 4 (HS Code)
- 5.2.5 Type 5 (HS Code)
- 5.3 Import Analysis – Segment
- 5.3.1 Type 1 (HS Code)
- 5.3.2 Type 2 (HS Code)
- 5.3.3 Type 3 (HS Code)
- 5.3.4 Type 4 (HS Code)
- 5.3.5 Type 5 (HS Code)
- 5.4 Average Unit Trade Prices
- 5.4.1 Average Export Price – Segment & Country
- 5.4.2 Average Import Price – Segment & Source Country
- 5.4.3 Price Trends (2024)
- 5.5 Key Trade Route Analysis
- 5.5.1 Trade Route 1
- 5.5.2 Trade Route 2
- 5.5.3 Trade Route 3
- 5.5.4 Trade Route 4
- 5.5.5 Trade Route 5
- 5.6 Trade Policy Impact Assessment
- 5.6.1 US Anti-Dumping & Section 301 Tariffs
- 5.6.2 EU Customs Union Impact
- 5.6.3 Major Free Trade Agreements
- 5.6.4 USMCA Rules of Origin
Note: Trade policy analysis will be included only where relevant to the Gas Turbine Component market.
Chapter 6. Competitive Landscape & Company Benchmarking
- 6.1 Gas Turbine Component Market Concentration & Structure
- 6.1.1 Herfindahl-Hirschman Index (HHI) – vs. 2024
- 6.1.2 Tier 1, Tier 2 & Tier 3 Market Structure
- 6.1.3 Global, Regional & Local Player Dynamics
- 6.2 Gas Turbine Component Market Share Analysis – 2024
- 6.2.1 Global Revenue Share by Company
- 6.2.2 Global Volume Share by Company
- 6.2.3 Regional Revenue Share
- 6.2.4 Market Share Evolution ( vs. 2024)
- 6.2.5 OEM Segment Share by Company
- 6.2.6 Replacement Segment Share by Company
- 6.3 Production/Delivery Capacity & Facility Analysis
- 6.3.1 Global Installed Capacity
- 6.3.2 Capacity Utilization Rates
- 6.3.3 Production/Output Volume
- 6.3.4 Facility Locations & Capacity Map
- 6.3.5 Planned Capacity Additions
- 6.4 Gas Turbine Component Competitive Benchmarking Matrix
- 6.4.1 Revenue, Volume, CAGR & Profitability Comparison
- 6.4.2 Channel Revenue Mix
- 6.4.3 Geographic Revenue Exposure
- 6.4.4 R&D Intensity
- 6.4.5 Sustainability Maturity
- 6.5 Strategic Developments in Gas Turbine Component (Last 24 Months)
- 6.5.1 Mergers, Acquisitions & Divestments
- 6.5.2 New Gas Turbine Component Launches
- 6.5.3 Facility Expansions
- 6.5.4 Strategic Alliances, Joint Ventures & Partnerships
- 6.5.5 Distribution Expansion & Market Entry
- 6.5.6 Sustainability & ESG Initiatives
- 6.6 Competitive Strategy Mapping
- 6.6.1 Leader, Challenger, Follower & Niche Classification
- 6.6.2 Pricing Strategy Comparison
- 6.6.3 Channel Strategy Matrix
Note: Strategic developments are included based on their materiality and the availability of reliable information.
Chapter 7. Global Gas Turbine Component Market – By Distribution Channel
- 7.1 Segment Overview
- 7.1.1 Volume & Revenue Split by Channel (2024 & 2032)
- 7.1.2 Channel Mix Evolution (2024-2032)
Chapter 8. Regional Market Analysis – Global Overview
- 8.1 Global Regional Overview
- 8.1.1 Regional Volume Share
- 8.1.2 Regional Revenue Share
- 8.1.3 Regional Volume by Region
- 8.1.4 Regional Revenue by Region
- 8.1.5 Regional Forecast Through 2032
- 8.2 Cross-Regional Segment Analysis
- 8.2.1 By Distribution Channel
- 8.2.2 By Brand/Price Tier
Chapter 9. North America Gas Turbine Component Market
- 9.1 United States
- 9.2 Canada
- 9.3 Mexico
Chapter 10. Europe Gas Turbine Component Market
- 10.1 Germany
- 10.2 France
- 10.3 Italy
- 10.4 United Kingdom
- 10.5 Spain
- 10.6 Poland
- 10.7 Russia
- 10.8 Netherlands
- 10.9 Belgium
- 10.10 Sweden
- 10.11 Denmark
- 10.12 Norway
- 10.13 Rest of Europe
Chapter 11. Asia Pacific Gas Turbine Component Market
- 11.1 China
- 11.2 India
- 11.3 Japan
- 11.4 South Korea
- 11.5 Thailand
- 11.6 Indonesia
- 11.7 Vietnam
- 11.8 Malaysia
- 11.9 Australia
- 11.10 Rest of Asia Pacific
Chapter 12. Latin America Gas Turbine Component Market
- 12.1 Brazil
- 12.2 Argentina
- 12.3 Colombia
- 12.4 Chile
- 12.5 Rest of Latin America
Chapter 13. Middle East Gas Turbine Component Market
- 13.1 Saudi Arabia
- 13.2 United Arab Emirates
- 13.3 Turkey
- 13.4 Israel
- 13.5 Iran
- 13.6 Rest of the Middle East
Chapter 14. Africa Gas Turbine Component Market
- 14.1 South Africa
- 14.2 Egypt
- 14.3 Nigeria
- 14.4 Morocco
- 14.5 Rest of Africa
Chapter 15. Gas Turbine Component Company Profiles
- 15.1 [Company 01]
- 15.1.1 Company Overview
- 15.1.2 Key Management Personnel
- 15.1.3 Products & Services Portfolio
- 15.1.4 Financial Performance
- 15.1.5 Key Market Focus & Geographic Presence
- 15.1.6 Recent Developments & Strategic Initiatives
Note: The company profile list is preliminary and may change based on research findings, market developments, data availability, and client requirements.
Chapter 16. Appendices
- Appendix A – List of Abbreviations & Acronyms
- Appendix B – Industry Classification Code Reference – Full Series
- Appendix C – Production & Capacity Data Tables
- Appendix D – End-Use & Demand Base Tables
- Appendix E – Consumption & Replacement Rate Assumptions
- Appendix F – ASP Reference Tables
- Appendix G – Manufacturing & Facility Database
- Appendix H – Import-Export Data Tables
- Appendix I – Regulatory Summary Tables
- Appendix J – Primary Research Participant List (Anonymized)
- Appendix K – Primary Research Questionnaire Framework
- Appendix L – Data Sources & Bibliography
- Appendix M – Market Size Divergence & Source Comparison
Chapter 17. Research Methodology
- 17.1 Research Framework & Philosophy
- 17.2 Secondary Research – Sources, Hierarchy & Data Extraction
- 17.3 Data Modeling – Bottom-Up & Top-Down Market Sizing
- 17.4 Primary Research – Stakeholder Framework, LOI & Sample Sizes
- 17.5 Forecast Methodology – Regression, Scenario & Sensitivity Analysis
- 17.6 Quality Control – Four-Layer Validation Framework
- 17.7 Limitations & Standard Assumptions
- 17.8 Disclaimer
