Market Overview
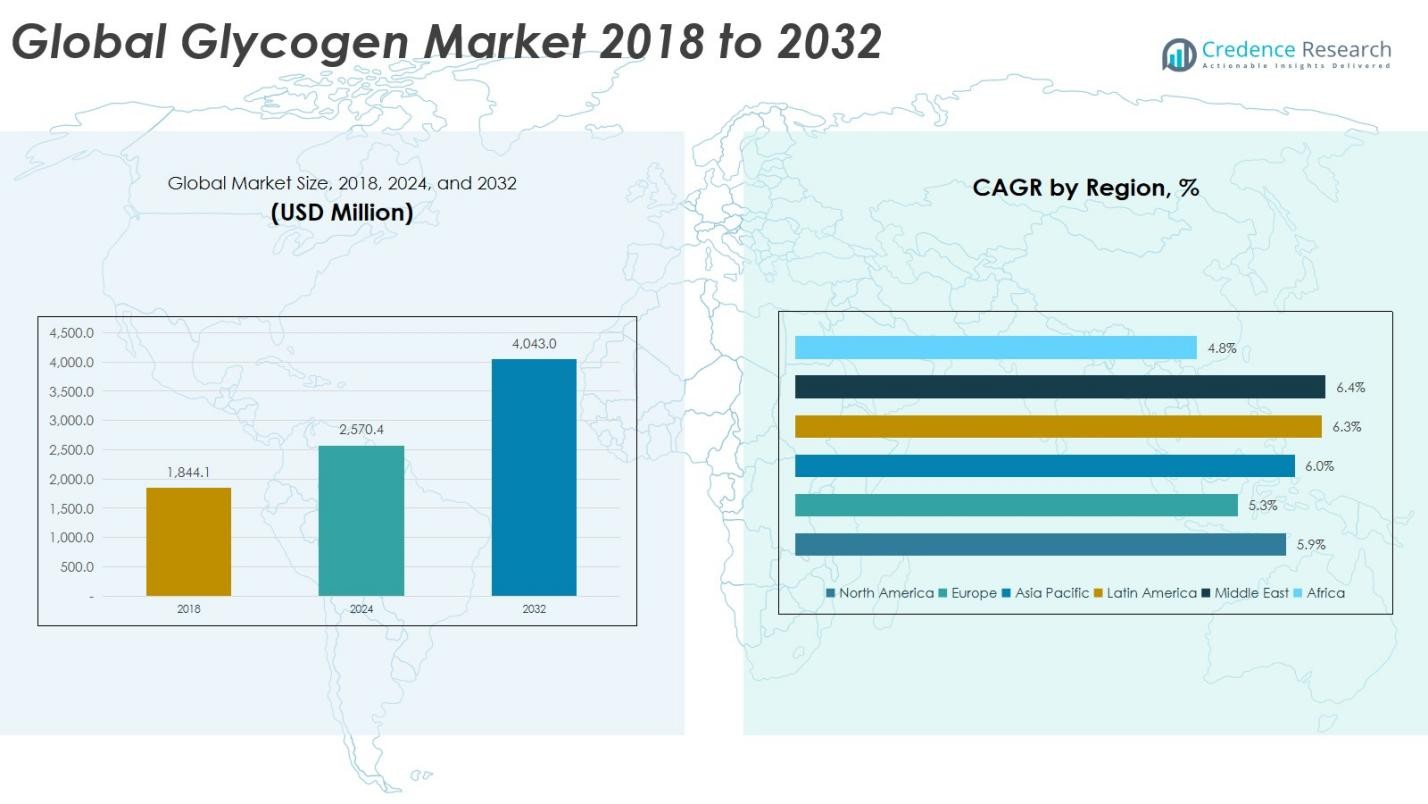
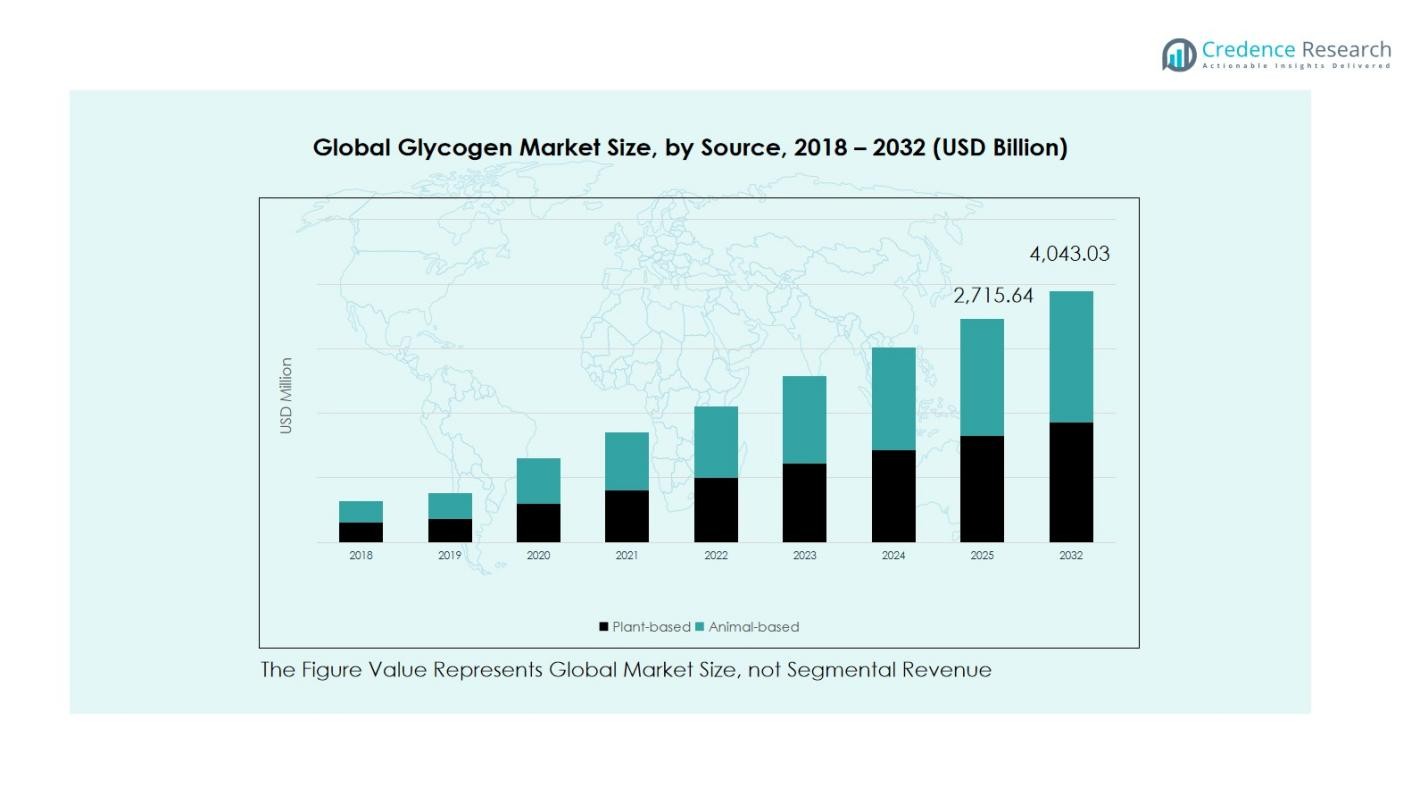
Glycogen Market size was valued at USD 1,844.1 Million in 2018 and is expected to reach USD 2,570.4 Million in 2024. The market is anticipated to grow further, reaching USD 4,043.0 Million by 2032, at a CAGR of 5.85% during the forecast period.
| REPORT ATTRIBUTE |
DETAILS |
| Historical Period |
2020-2023 |
| Base Year |
2024 |
| Forecast Period |
2025-2032 |
| Glycogen Market Size 2024 |
USD 2,570.4 Million |
| Glycogen Market, CAGR |
5.85% |
| Glycogen Market Size 2032 |
USD 4,043.0 Million |
The Glycogen Market is highly competitive, led by key players such as SpectGlycogen Chemical Mfg. Corporation, Thermo Fisher Scientific Inc, Tokyo Chemical Industry Co., Ltd, AMO Pharmaceuticals, Cayman Chemical Company, LG Chem, Mitsubishi Chemical, and Takeda Pharmaceutical. These companies are strengthening their market position through product innovation, strategic collaborations, and expansion into high-growth regions. Asia Pacific leads the market with a 23% share in 2024, driven by rising demand in personal care, sports nutrition, and functional food applications, followed by Europe with 18% share and North America at 16%. Strong adoption of plant-based glycogen, increasing consumer awareness of sustainable and bioactive ingredients, and robust pharmaceutical and cosmetic industries across these regions support market growth. The top players focus on R&D, mergers, and acquisitions to enhance product portfolios and maintain a competitive edge in the global Glycogen Market.
Access crucial information at unmatched prices!
Request your sample report today & start making informed decisions powered by Credence Research Inc.!
Download Sample
Market Insights
- The Glycogen Market was valued at USD 2,570.4 Million in 2024 and is projected to reach USD 4,043.0 Million by 2032, growing at a CAGR of 5.85%.
- Rising demand in personal care, cosmetics, sports nutrition, and pharmaceuticals is driving Glycogen Market growth, supported by consumer preference for natural and sustainable ingredients.
- Key market trends include the shift toward plant-based glycogen, expansion in functional foods and sports nutrition, and growing applications in biotechnology and research, boosting adoption globally.
- Competitive activity is intense with players such as SpectGlycogen Chemical Mfg. Corporation, Thermo Fisher Scientific Inc, Tokyo Chemical Industry Co., Ltd, and LG Chem focusing on R&D, product innovation, and strategic partnerships to enhance market presence.
- Regionally, Asia Pacific leads with a 23% market share, followed by Europe at 18% and North America at 16%, while plant-based glycogen holds the largest segment share at 58% globally.
Market Segmentation Analysis:
By Source
The plant-based segment dominates the glycogen market with a 58% share, driven by rising consumer preference for natural, sustainable ingredients in personal care, cosmetics, and food products. Its biocompatibility, antioxidant properties, and suitability for vegan-friendly formulations make it the preferred choice for manufacturers targeting health-conscious and environmentally aware consumers. Animal-based glycogen holds the remaining 42% share, primarily supporting pharmaceutical and sports nutrition applications due to its high bioavailability and functional efficacy. Demand is fueled by performance-enhancing supplements and therapeutic formulations, particularly in North America, Europe, and Japan.
For instance, Kerry Group launched a plant-based glycogen solution for functional foods, aligning with clean-label and vegan trends.
By Application
Personal care and cosmetics lead the market with 32% share, fueled by glycogen’s moisturizing and anti-aging benefits. Food applications account for 20%, driven by functional foods and energy products that support metabolism and gut health. Sports nutrition contributes 18%, leveraging glycogen for energy storage and post-workout recovery, while pharmaceuticals hold 15%, focusing on clinical formulations and therapeutic nutrition. The “Others” segment, also at 15%, covers biotechnology research, animal feed, and specialty chemicals, supported by technological innovations and niche industrial applications in North America and Asia Pacific.
For instance, Glico’s Bioglycogen®, a high-purity, enzymatically synthesized glycogen from corn starch, is used in cosmetics for deep moisturizing and anti-wrinkle effects, promoting skin ceramide production linked to aging care.
Key Growth Drivers
Rising Demand in Personal Care & Cosmetics
The increasing consumer preference for natural and sustainable skincare products is a major driver of the glycogen market. Glycogen’s moisturizing, anti-aging, and skin-protective properties make it highly desirable for premium creams, serums, and hair care products. The shift toward clean-label and plant-based formulations in North America and Europe has encouraged manufacturers to integrate glycogen into cosmetic applications. Continuous product innovation and marketing of bioactive ingredients further boost adoption, supporting steady market growth across the personal care and cosmetic sectors.
For instance, Veriphy Skincare’s PhytoSpherix® phytoglycogen, a 100% plant-based glycogen, energizes skin cells to promote collagen, elastin, and hyaluronic acid production, leading to improved hydration and a glowing complexion.
Growing Sports Nutrition and Functional Food Segment
The expanding sports nutrition and functional food markets are fueling glycogen demand. Glycogen enhances muscle energy storage, accelerates post-workout recovery, and supports metabolism, making it a preferred ingredient in protein powders, energy gels, and fortified foods. Rising health consciousness, increasing gym participation, and the popularity of endurance sports in North America and Europe contribute to sustained adoption. Manufacturers are capitalizing on these trends by developing glycogen-enriched nutritional products, strengthening its position as a functional ingredient in global dietary and sports nutrition markets.
For instance, Maurten, known for its hydrogel technology, enables athletes to consume up to 100 grams of carbohydrates per hour with improved absorption, optimizing glycogen use during endurance activities.
Pharmaceutical and Clinical Applications
The pharmaceutical industry drives glycogen demand through its use in therapeutic nutrition, drug formulations, and tissue engineering. Animal-based glycogen is preferred for its bioavailability and functional efficacy in clinical applications. The growing aging population, increasing R&D investments, and rising demand for advanced therapeutics in Europe and North America support market growth. Glycogen’s role as a functional excipient in injectable and oral formulations enhances treatment outcomes, making pharmaceutical and clinical applications a significant growth segment within the global glycogen market.
Key Trends & Opportunities
Shift Toward Plant-Based and Sustainable Ingredients
Consumers increasingly favor plant-derived glycogen due to sustainability, vegan preferences, and clean-label trends. Companies are innovating to create plant-based formulations for personal care, cosmetics, and functional foods, capitalizing on eco-conscious consumer behavior. This shift opens opportunities for expanding product portfolios, entering new markets, and differentiating through natural ingredients. Asia Pacific and Europe are particularly attractive regions due to high consumer awareness, regulatory support for sustainable products, and growing demand for bio-based ingredients across multiple industries.
For instance, Mibelle Biochemistry offers PhytoSpherix™, a plant-based glycogen extracted from non-GMO sweet corn, which stimulates ATP production, boosts collagen and hyaluronic acid synthesis, and provides long-lasting skin hydration and anti-aging benefits.
Expansion of Biotechnology and Research Applications
Glycogen’s applications in biotechnology and laboratory research are rising, including cellular studies and enzyme research. Increasing investment in biotech R&D, coupled with the need for functional substrates in research, presents growth opportunities. The demand for glycogen in specialized applications such as tissue engineering and drug delivery is expanding globally, particularly in North America and Asia Pacific. Companies can leverage these opportunities by offering high-purity glycogen and collaborating with research institutions, creating new revenue streams and diversifying market applications beyond conventional industries.
For instance, glycogen engineering in mesenchymal stem cells (MSCs) by overexpressing synthesis enzymes has significantly enhanced their starvation resistance and improved therapeutic efficacy in pulmonary fibrosis models, demonstrating potential in regenerative medicine.
Key Challenges
High Production Costs and Complex Extraction Processes
Glycogen production, particularly from high-quality plant or animal sources, involves complex extraction, purification, and processing steps. These processes increase production costs, impacting pricing and limiting large-scale adoption, especially in cost-sensitive regions. Manufacturers must balance product quality with cost efficiency, which can slow market growth. Additionally, maintaining consistent purity and functional properties is critical for pharmaceutical and food applications, presenting operational and financial challenges that require advanced technology and skilled workforce to overcome.
Regulatory and Ethical Concerns
Animal-derived glycogen faces regulatory scrutiny and ethical concerns, particularly in regions with strict animal welfare and labeling requirements. Compliance with food, cosmetic, and pharmaceutical regulations adds complexity to market entry and increases time-to-market. Ethical considerations also drive demand for plant-based alternatives, potentially reducing the market share of animal-based glycogen. Companies must navigate diverse regional regulations while ensuring transparency in sourcing, which presents ongoing challenges in maintaining market trust and aligning production with evolving legal and consumer expectations.
Regional Analysis
North America
North America accounted for a market share of 16% in 2024, with glycogen demand rising from USD 422.12 million in 2018 to USD 590.68 million in 2024. The region is projected to reach USD 933.94 million by 2032, growing at a CAGR of 5.9% during the forecast period. Growth is driven by strong adoption in personal care, cosmetics, and sports nutrition applications, alongside high consumer awareness of natural and functional ingredients. The U.S. dominates the market due to well-established pharmaceutical and nutraceutical industries, while Canada and Mexico contribute steadily to regional expansion through increasing demand for plant-based and therapeutic glycogen products.
Europe
Europe held a market share of 18% in 2024, with glycogen demand increasing from USD 492.94 million in 2018 to USD 668.01 million in 2024, and expected to reach USD 1,010.76 million by 2032 at a CAGR of 5.3%. The market is supported by rising demand in personal care, pharmaceuticals, and functional foods. Germany, France, and the UK lead the regional market due to advanced R&D infrastructure and high consumer focus on bioactive and sustainable ingredients. Growing awareness of clean-label and plant-based products further drives glycogen adoption across cosmetics and nutritional applications.
Asia Pacific
Asia Pacific represents the largest regional market with a market share of 23% in 2024, expanding from USD 631.25 million in 2018 to USD 888.44 million in 2024, and is forecast to reach USD 1,415.46 million by 2032 at a CAGR of 6.0%. Growth is fueled by increasing consumer spending on personal care, sports nutrition, and functional foods, particularly in China, Japan, and India. Rising health consciousness, urbanization, and the expansion of pharmaceutical and biotechnology industries support market adoption. The region also benefits from the growing preference for plant-based glycogen and sustainable ingredients, creating significant opportunities for manufacturers.
Latin America
Latin America accounted for a market share of 6% in 2024, with market size rising from USD 178.33 million in 2018 to USD 255.94 million in 2024, projected to reach USD 418.05 million by 2032 at a CAGR of 6.3%. Growth is driven by increasing demand in functional foods, sports nutrition, and pharmaceuticals across Brazil and Argentina. Urbanization and rising health awareness among consumers are boosting glycogen adoption, while regional manufacturers focus on developing plant-based and clean-label products. Expansion of retail channels and increasing investments in biotechnology and nutraceutical sectors further support market growth.
Middle East
The Middle East held a market share of 3% in 2024, with glycogen demand increasing from USD 80.04 million in 2018 to USD 115.19 million in 2024, expected to reach USD 188.81 million by 2032 at a CAGR of 6.4%. Growth is driven by rising healthcare expenditure, increasing adoption of pharmaceuticals, and growing interest in functional foods and personal care products. GCC countries, Israel, and Turkey lead regional consumption, supported by investments in biotechnology and research initiatives. Rising awareness of plant-based and bioactive ingredients is creating opportunities for market expansion in personal care, food, and nutritional applications.
Africa
Africa accounts for a market share of 1.5% in 2024, with glycogen market size growing from USD 39.46 million in 2018 to USD 52.14 million in 2024, projected to reach USD 76.01 million by 2032 at a CAGR of 4.8%. Growth is driven by increasing urbanization, rising demand in pharmaceuticals and functional foods, and expanding healthcare infrastructure in South Africa and Egypt. Adoption is supported by growing awareness of bioactive ingredients and nutritional supplements, though market penetration remains lower than other regions. Investment in biotechnology and cosmetic industries presents opportunities for long-term market development.
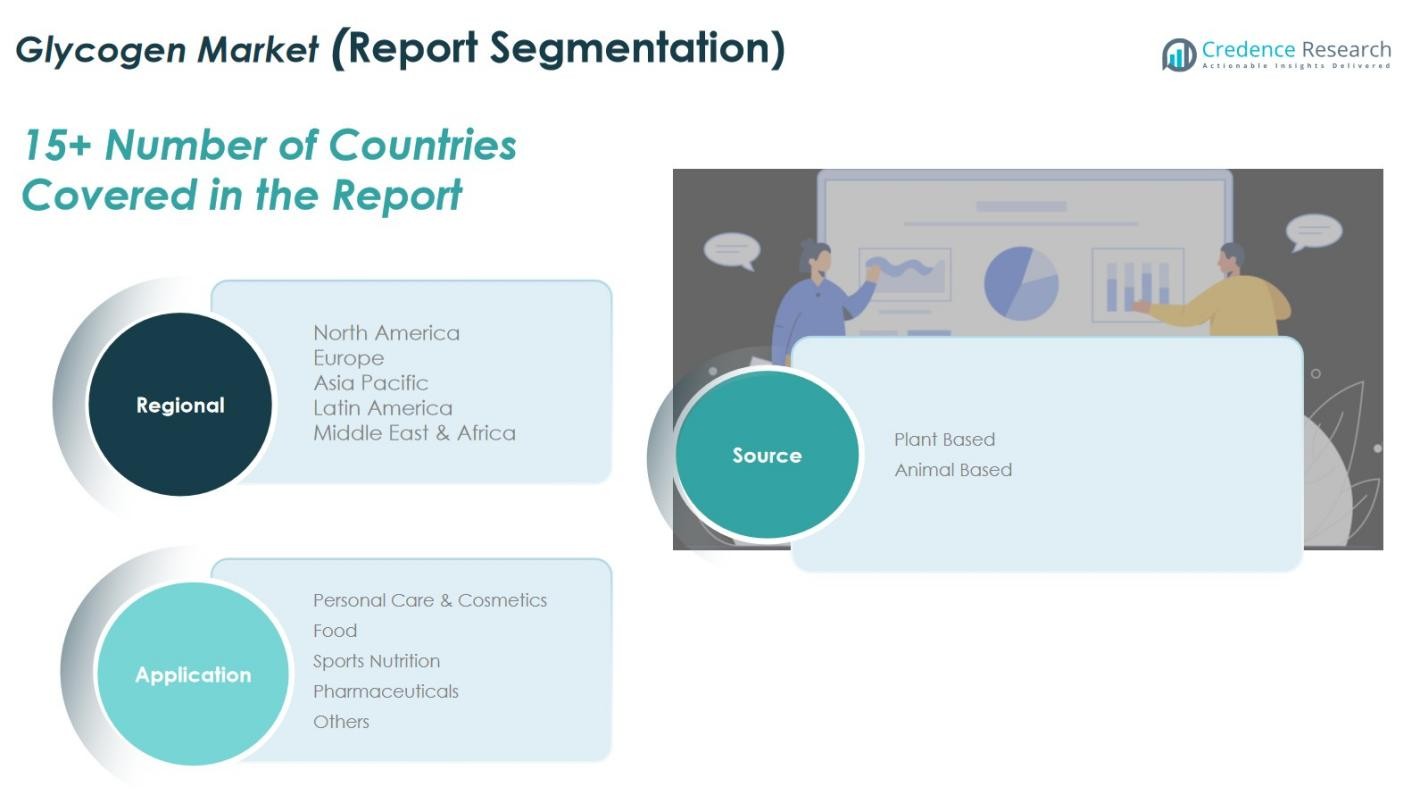
Market Segmentations:
By Source:
By Application:
- Personal Care & Cosmetics
- Food
- Sports Nutrition
- Pharmaceuticals
- Others
By Region:
- North America
- Europe
- Germany
- France
- U.K.
- Italy
- Spain
- Rest of Europe
- Asia Pacific
- China
- Japan
- India
- South Korea
- South-east Asia
- Rest of Asia Pacific
- Latin America
- Brazil
- Argentina
- Rest of Latin America
- Middle East & Africa
- GCC Countries
- South Africa
- Rest of the Middle East and Africa
Competitive Landscape
The competitive landscape of the glycogen market features key players such as SpectGlycogen Chemical Mfg. Corporation, Thermo Fisher Scientific Inc, Tokyo Chemical Industry Co., Ltd, AMO Pharmaceuticals, Cayman Chemical Company, LG Chem, Mitsubishi Chemical, and Takeda Pharmaceutical. Market competition is intensifying as companies focus on product innovation, strategic partnerships, and expansion into high-growth regions. Players are increasingly investing in research and development to improve purity, bioavailability, and plant-based alternatives to meet evolving consumer demands. North America, Europe, and Asia Pacific witness strong competitive activity due to high demand in personal care, pharmaceuticals, and sports nutrition. Additionally, companies are adopting mergers, acquisitions, and collaborations to enhance their product portfolios, strengthen distribution networks, and gain technological advantages. With growing consumer preference for sustainable and functional ingredients, competition is expected to remain robust, driving innovation and efficiency across the global glycogen market.
Key Player Analysis
- SpectGlycogen Chemical Mfg. Corporation
- Thermo Fisher Scientific Inc
- Tokyo Chemical Industry Co., Ltd
- AMO Pharmaceuticals
- Cayman Chemical Company
- LG Chem
- Mitsubishi Chemical
- Takeda Pharmaceutical
- Other Key Players
Recent Developments
- In May 2024, Shionogi & Co., Ltd. and Maze Therapeutics, Inc. entered into an exclusive worldwide license agreement for MZE001, an investigational oral glycogen synthase 1 (GYS1) inhibitor targeting Pompe disease.
- In April 2024, Glanbia plc acquired Aroma Holding Company, a U.S.-based flavoring business, enhancing its presence in the nutrition and flavoring sector.
- In February 2024, Glanbia partnered with McLaren Racing as the official sports nutrition partner, featuring its Optimum Nutrition brand on the team’s gear and apparel.
Shape Your Report to Specific Countries or Regions & Enjoy 30% Off!
Report Coverage
The research report offers an in-depth analysis based on Source, Application and Region. It details leading market players, providing an overview of their business, product offerings, investments, revenue streams, and key applications. Additionally, the report includes insights into the competitive environment, SWOT analysis, current market trends, as well as the primary drivers and constraints. Furthermore, it discusses various factors that have driven market expansion in recent years. The report also explores market dynamics, regulatory scenarios, and technological advancements that are shaping the industry. It assesses the impact of external factors and global economic changes on market growth. Lastly, it provides strategic recommendations for new entrants and established companies to navigate the complexities of the market.
Future Outlook
- The glycogen market is expected to grow steadily, driven by increasing demand in personal care, cosmetics, and pharmaceutical applications.
- Plant-based glycogen will continue gaining traction due to rising consumer preference for sustainable and vegan products.
- Growth in sports nutrition and functional food sectors will create new opportunities for glycogen adoption globally.
- Expansion of biotechnology and laboratory research applications will support demand for high-purity glycogen.
- Companies are likely to focus on R&D to improve bioavailability and efficacy of glycogen-based products.
- Increasing awareness of clean-label and natural ingredients will boost glycogen incorporation in cosmetics and food.
- Emerging markets in Asia Pacific and Latin America will offer significant growth potential due to rising health consciousness.
- Strategic partnerships, mergers, and acquisitions will shape the competitive landscape and market expansion.
- Technological advancements in extraction and processing methods will enhance production efficiency and quality.
- Regulatory support for functional ingredients and natural formulations will sustain long-term market growth.


