
Market Overview
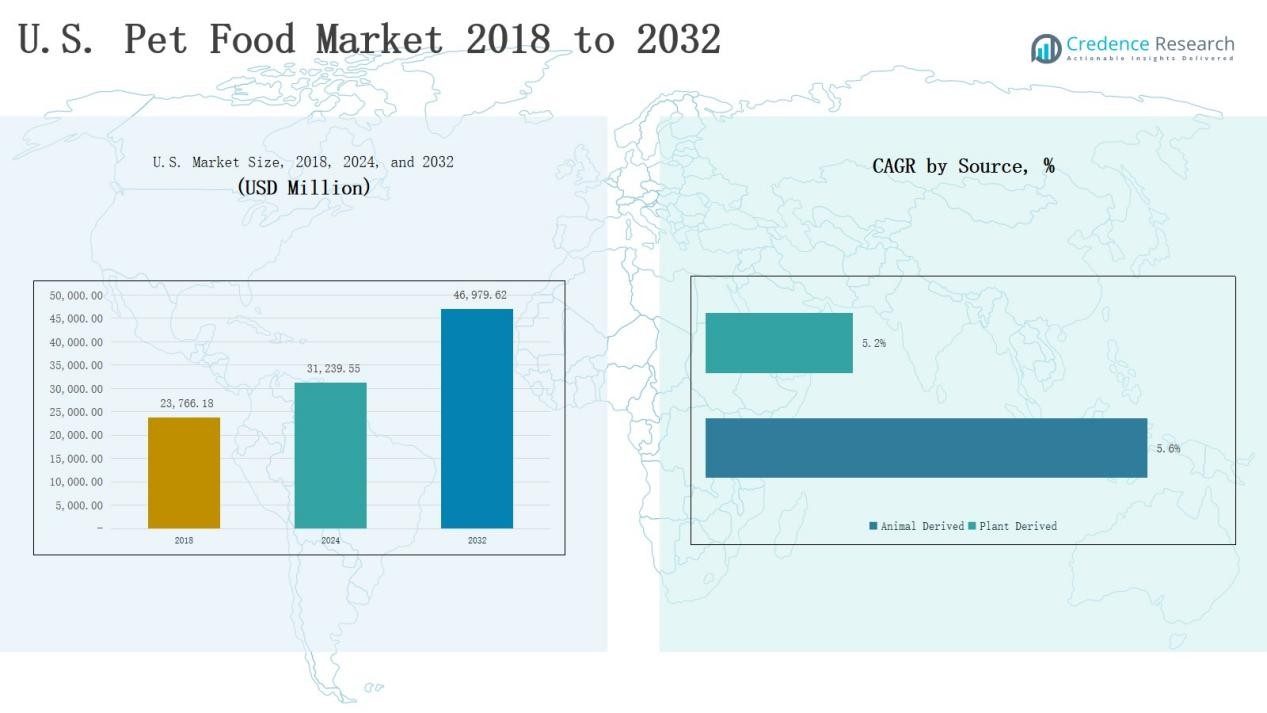
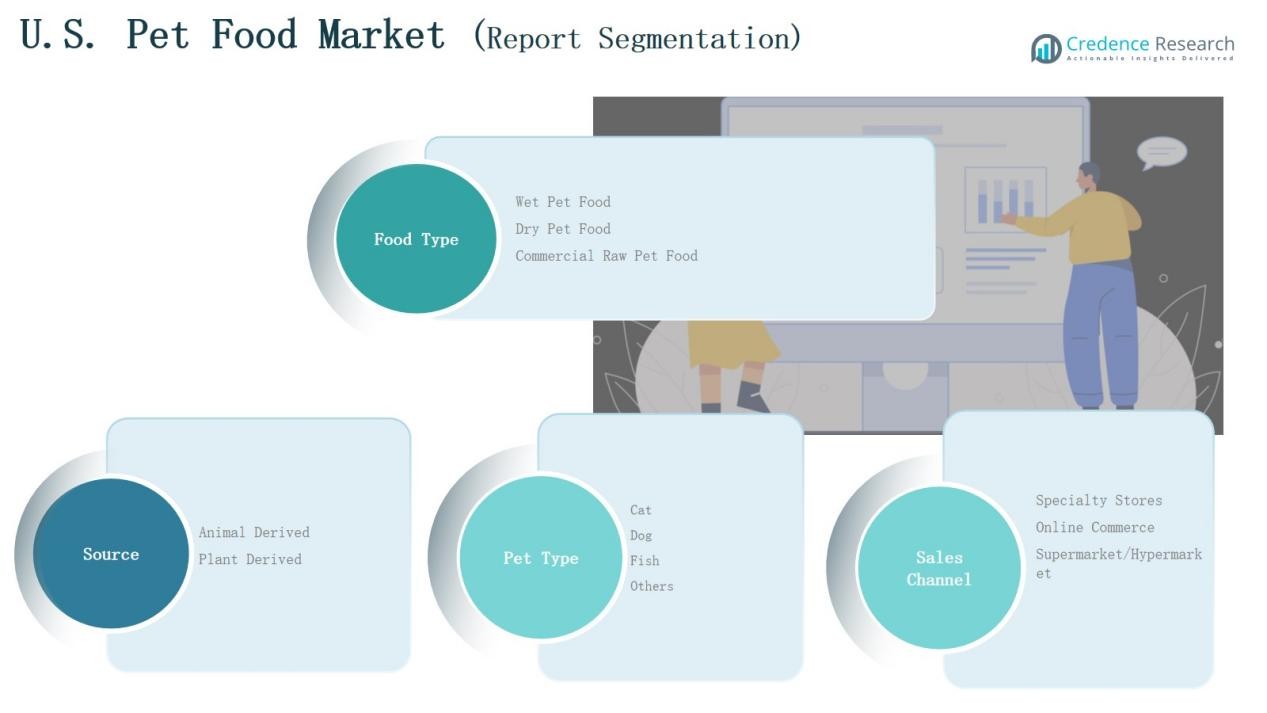
The U.S. Pet Food Market size was valued at USD 23,766.18 million in 2018, increased to USD 31,239.55 million in 2024, and is anticipated to reach USD 46,979.62 million by 2032, growing at a CAGR of 5.02% during the forecast period.
| REPORT ATTRIBUTE | DETAILS |
|---|---|
| Historical Period | 2020-2023 |
| Base Year | 2024 |
| Forecast Period | 2025-2032 |
| U.S. Pet Food Market Size 2024 | USD 31,239.55 Million |
| U.S. Pet Food Market, CAGR | 5.02% |
| U.S. Pet Food Market Size 2032 | USD 46,979.62 Million |
The U.S. Pet Food Market is dominated by major companies such as Mars, Incorporated, Nestlé Purina PetCare, Hill’s Pet Nutrition, General Mills, Inc., and J.M. Smucker Co., which lead through strong product portfolios, advanced nutrition research, and extensive retail distribution. These players focus on premium, functional, and sustainable formulations to meet evolving consumer preferences. United Petfood, Simmons Pet Food, and Archer Daniels Midland Company (ADM) strengthen competition through private-label and ingredient innovations. Regionally, the South led the market in 2024 with a 32% share, driven by high pet ownership, large production bases, and growing demand for customized, high-protein diets across diverse consumer segments.
Market Insights
- The U.S. Pet Food Market was valued at USD 23,766.18 million in 2018, reached USD 31,239.55 million in 2024, and is projected to hit USD 46,979.62 million by 2032, growing at a CAGR of 5.02%.
- Leading companies such as Mars, Incorporated, Nestlé Purina PetCare, Hill’s Pet Nutrition, General Mills, and J.M. Smucker Co. dominate through innovation, premium formulations, and extensive retail presence.
- By food type, dry pet food led with a 61% share in 2024, driven by convenience, affordability, and the inclusion of functional ingredients that support pet health.
- By source, animal-derived food held a 68% share, supported by strong demand for protein-rich, grain-free, and meat-first products across premium and mainstream categories.
- Regionally, the South led the market with a 32% share in 2024, backed by high pet adoption, strong production capacity, and increasing demand for customized, high-protein diets.
Market Segment Insights
By Food Type
Dry pet food dominated the U.S. Pet Food Market in 2024 with a 61% share. Its long shelf life, easy storage, and convenience for portion control support high adoption among pet owners. The segment benefits from cost efficiency and the inclusion of functional ingredients such as probiotics and omega fatty acids. Increasing demand for premium dry formulations that promote oral health and digestion continues to strengthen this segment’s position across both dog and cat food categories.
- For instance, Hill’s Pet Nutrition introduced its Science Diet Perfect Digestion dry range, enhanced with ActivBiome+ to support gut health in both dogs and cats.
By Source
Animal-derived pet food accounted for a 68% share of the U.S. Pet Food Market in 2024. Consumers prefer protein-rich diets made from poultry, beef, and fish sources that align with pets’ natural feeding habits. Growth is supported by rising demand for high-protein, grain-free, and meat-first products. Expanding supply chains for sustainable animal protein and the introduction of freeze-dried meat inclusions further enhance the dominance of this segment in both premium and mass-market categories.
- For instance, Mars Petcare introduced Cesar Wholesome Bowls, featuring chicken and beef sources without grains or artificial preservatives, catering to rising demand for clean-label meat products.
By Pet Type
The dog food segment led the U.S. Pet Food Market in 2024, capturing a 57% share. High dog ownership rates and growing awareness of breed-specific nutritional needs drive segment expansion. Demand for tailored formulations addressing joint, coat, and digestive health continues to rise. The trend toward human-grade ingredients and grain-free recipes further strengthens sales in both dry and wet dog food categories, supported by increasing expenditure on canine health and well-being.
Key Growth Drivers
Rising Pet Humanization and Premiumization
Pet owners increasingly treat pets as family members, fueling demand for premium, nutritionally advanced food products. The shift toward human-grade, organic, and functional ingredients supports higher spending on pet health and wellness. Brands introducing fortified formulations with probiotics, antioxidants, and natural proteins attract health-conscious consumers. This humanization trend also boosts sales of gourmet and specialized diets, strengthening the market’s premium segment across both dog and cat food categories.
- For instance, The Honest Kitchen offers human-grade pet food where every ingredient meets standards for human consumption, resulting in reported improvements of 80% in pets' digestion and 77% in wellbeing and energy levels.
Expanding E-Commerce and Direct-to-Consumer Channels
Online retail growth has transformed purchasing patterns in the U.S. Pet Food Market. E-commerce platforms offer subscription models, doorstep delivery, and personalized product recommendations. Pet owners prefer digital platforms for convenience and access to niche brands unavailable in stores. Direct-to-consumer brands use data analytics to create tailored feeding plans, improving loyalty. Enhanced logistics networks and temperature-controlled packaging strengthen online pet food accessibility and encourage steady repeat purchases across major urban markets.
- For instance, HelloFresh launched "The Pets Table" dog food subscription in summer 2023, offering “human-grade” meals as part of its strategy to broaden fully integrated food solutions.
Growing Demand for Functional and Natural Ingredients
Health-conscious consumers seek clean-label pet food free from artificial additives, preservatives, and fillers. Functional ingredients, such as omega-3 fatty acids, glucosamine, and probiotics, drive strong demand for products targeting immunity, joint, and digestive health. Manufacturers are reformulating recipes with superfoods and plant-based protein blends to align with sustainability and ethical sourcing goals. This trend supports innovation in both wet and dry food formats, expanding premium and specialty pet food portfolios.
Key Trends & Opportunities
Surge in Plant-Based and Alternative Protein Formulations
Plant-based and insect-derived proteins are gaining traction as sustainable alternatives to meat-based diets. Consumers increasingly favor eco-friendly formulations that reduce the carbon footprint of pet ownership. Companies are introducing products featuring pea, lentil, and algae proteins that maintain high nutritional value. This trend offers long-term growth opportunities in vegan and hypoallergenic pet food lines, driven by environmental awareness and expanding availability of plant-based protein sources in the U.S. market.
- For instance, PawCo, founded by a former Impossible Foods scientist, launched a fresh vegan dog food formula called GreenMeat™ using yeast and pea protein, offering a nutritionally complete diet exceeding AAFCO standards.
Personalization and Data-Driven Nutrition
Technology adoption enables pet food companies to provide personalized meal plans based on breed, age, and health conditions. AI-driven tools and smart feeding devices allow tracking of consumption patterns and nutritional needs. Subscription-based models use this data to tailor ingredient composition for optimal wellness. The trend toward individualized nutrition enhances customer engagement and supports premium product demand, offering brands new opportunities to differentiate within the competitive U.S. pet food landscape.
- For instance, FurrMeals offers a subscription plan with flexible customization options where owners can select ingredients and adjust plans based on their pet’s preferences and sensitivities.
Key Challenges
Fluctuating Raw Material Prices
Volatile costs of key ingredients such as meat, grains, and fats pose challenges for manufacturers. Rising feed and transportation expenses pressure profit margins, especially for small and mid-scale producers. Price instability disrupts supply chain planning, leading to inconsistent product pricing for consumers. Companies are increasingly exploring ingredient diversification and local sourcing strategies to reduce dependency on global commodity markets and ensure consistent cost management across product categories.
Stringent Regulatory and Labeling Requirements
Compliance with FDA and AAFCO standards requires continuous monitoring and reformulation of products. Frequent regulatory updates on ingredient approval, labeling claims, and safety testing increase operational complexity. Smaller firms face resource constraints in adapting to evolving nutritional labeling and sustainability disclosure rules. Ensuring traceability from raw materials to packaging remains critical to maintaining consumer trust and preventing recalls or reputational risks in the competitive pet food sector.
Rising Competition and Market Saturation
The U.S. Pet Food Market faces intense competition among established and emerging brands. Major players dominate through extensive distribution networks, while new entrants struggle to gain visibility. Constant innovation pressures increase marketing and R&D costs. With premiumization reaching maturity, differentiation through unique formulations or sustainability credentials becomes essential. Companies must invest in brand loyalty, supply chain agility, and digital engagement to sustain growth in this highly saturated marketplace.
Regional Analysis
Northeast
The Northeast held 21% of the U.S. Pet Food Market in 2024. High pet ownership in urban centers such as New York, Boston, and Philadelphia supports steady demand. Consumers favor premium, organic, and human-grade food products that align with wellness-focused lifestyles. Specialty stores and boutique pet retailers dominate distribution, emphasizing fresh and sustainable formulations. The strong presence of educated consumers drives awareness about nutrition and ingredient sourcing. It continues to attract global brands targeting affluent, health-conscious pet owners.
Midwest
The Midwest accounted for 25% of the U.S. Pet Food Market in 2024. The region benefits from abundant livestock supply, efficient manufacturing bases, and established distribution networks. Cost-effective dry food production supports volume growth, while rural pet ownership contributes to steady consumption. Local producers focus on value-driven offerings tailored for multiple pet types. It also shows rising demand for natural and protein-rich formulations. The expanding e-commerce infrastructure further increases accessibility across semi-urban areas.
South
The South led the U.S. Pet Food Market with a 32% share in 2024. High household pet adoption and the presence of major production hubs such as Texas and Georgia strengthen its dominance. Consumers display growing interest in grain-free, high-protein, and customized diets. Strong retail chains and online marketplaces enable broad product availability across both premium and economy categories. It also benefits from rising disposable incomes and increasing awareness of pet wellness. Ongoing industry investment reinforces regional market leadership.
West
The West region captured 22% of the U.S. Pet Food Market in 2024. States such as California and Washington drive strong demand for sustainable and plant-based pet food products. Consumers prioritize eco-friendly packaging and locally sourced ingredients, promoting innovation among manufacturers. The region’s focus on pet health and environmental responsibility supports growth in natural and functional product lines. It also benefits from high online sales penetration and technology-driven consumer engagement. Strong retail presence and premiumization sustain continued expansion.
Market Segmentations:
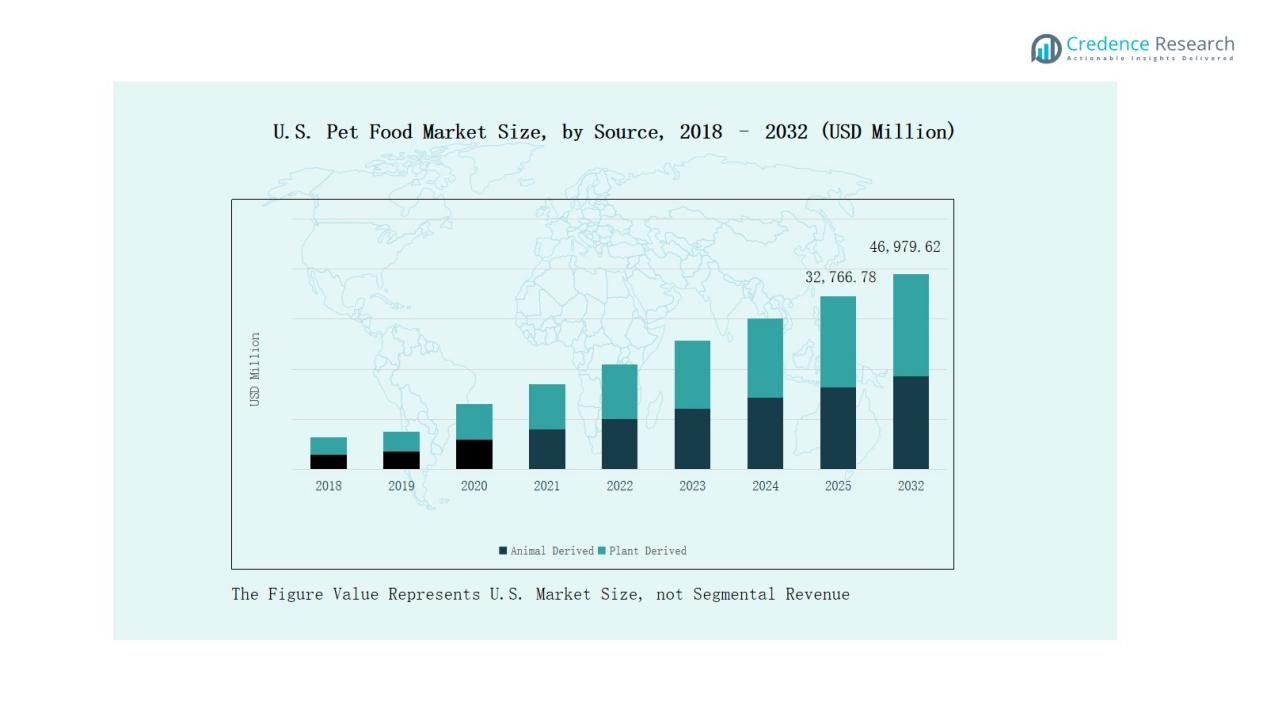
By Food Type
- Wet Pet Food
- Dry Pet Food
- Commercial Raw Pet Food
By Source
- Animal Derived
- Plant Derived
By Pet Type
- Dog
- Cat
- Fish
- Others
By Sales Channel
- Specialty Stores
- Supermarket/Hypermarket
- Online Commerce
By Region
- Northeast
- Midwest
- South
- West
Competitive Landscape
The U.S. Pet Food Market is highly competitive, with major players such as Mars, Incorporated, Nestlé Purina PetCare, Hill’s Pet Nutrition, General Mills, and J.M. Smucker Co. dominating through extensive product portfolios and robust distribution networks. These companies focus on innovation, launching functional, organic, and breed-specific formulations to capture evolving consumer preferences. Private-label and regional brands are expanding their presence by offering affordable, nutritionally balanced alternatives. Competition is further intensified by the rapid growth of e-commerce and direct-to-consumer brands, which leverage personalized marketing and subscription-based sales. Strategic acquisitions, partnerships with retailers, and investments in sustainable packaging are key strategies among leading firms to strengthen market share. Continuous emphasis on R&D, transparency, and ingredient quality remains central to brand differentiation, while emerging niche players gain traction by catering to rising demand for clean-label and plant-based pet food products across urban and suburban markets.
Key Players
- Hill’s Pet Nutrition Inc.
- Mars, Incorporated
- Nestlé Purina PetCare
- General Mills, Inc.
- M. Smucker Co.
- United Petfood
- Simmons Pet Food
- Elmira Pet Products
- Real Pet Food Co.
- Archer Daniels Midland Company (ADM)
- Unicharm Corporation
Recent Developments
- In June 2025, General Mills launched its new “Love Made Fresh” line under the Blue Buffalo brand, marking its entry into the fresh pet food segment.
- In 2024, Nestlé Purina PetCare opened a 1.3-million-square-foot manufacturing facility in Eden, North Carolina, expanding its U.S. production capacity.
- In late 2024, General Mills announced an acquisition agreement for Tiki Pets and Cloud Star brands from Whitebridge Pet Brands.
Report Coverage
The research report offers an in-depth analysis based on Food Type, Source, Pet Type, Sales Channel and Region. It details leading market players, providing an overview of their business, product offerings, investments, revenue streams, and key applications. Additionally, the report includes insights into the competitive environment, SWOT analysis, current market trends, as well as the primary drivers and constraints. Furthermore, it discusses various factors that have driven market expansion in recent years. The report also explores market dynamics, regulatory scenarios, and technological advancements that are shaping the industry. It assesses the impact of external factors and global economic changes on market growth. Lastly, it provides strategic recommendations for new entrants and established companies to navigate the complexities of the market.
Future Outlook
- Demand for premium and human-grade pet food will continue to grow across major cities.
- Plant-based and alternative protein formulations will gain wider consumer acceptance.
- Personalized nutrition and data-driven meal planning will shape future product innovation.
- Sustainability and eco-friendly packaging will become key brand differentiators.
- E-commerce and subscription-based delivery models will expand their market share.
- Functional ingredients supporting immunity and joint health will drive new product launches.
- Pet ownership growth among millennials and Gen Z will sustain long-term demand.
- Strategic mergers and acquisitions will increase market consolidation among leading players.
- Regulatory focus on labeling transparency and quality control will strengthen brand trust.
- Technological integration in production and logistics will enhance efficiency and product traceability.

Request a Free Sample
Fill in your details and we'll send you a free sample report.
- Sample data tables & charts
- Research methodology
Need a Custom Version of This Report?
Tailor the scope, geography, or segments to your exact requirements.
- Custom geography or segment scope
- Direct access to our analyst team
Frequently Asked Questions
What is the current market size for the U.S. Pet Food Market, and what is its projected size in 2032?
At what Compound Annual Growth Rate is the U.S. Pet Food Market projected to grow between 2025 and 2032?
Which U.S. Pet Food Market segment held the largest share in 2024?
What are the primary factors fueling the growth of the U.S. Pet Food Market?
Who are the leading companies in the U.S. Pet Food Market?
Which region commanded the largest share of the U.S. Pet Food Market in 2024?
Table of Content
Chapter 1. Report Introduction
- 1.1 Report Description & Purpose
- 1.1.1 Report Title & Market Definition
- 1.1.2 Unique Selling Propositions (USP) & Key Differentiators
- 1.1.3 Value Proposition for Stakeholders
- 1.2 Research Objectives
- 1.2.1 Market Sizing Objectives (Volume & Revenue) (Volume Where Applicable)
- 1.2.2 Segmentation Objectives
- 1.2.3 Competitive Intelligence Objectives
- 1.2.4 Forecast & Scenario Objectives
- 1.3 Report Scope
- 1.3.1 U.S. Pet Food Market Scope – Segments & Subsegments Covered
- 1.3.2 Geographic Scope – Selected Country & Subnational Markets Covered
- 1.3.3 Historical Period, Base Year & Forecast Period (2024; forecast to 2032)
- 1.3.4 Inclusions & Exclusions
- 1.4 Industry Classification & Applicable Codes
- 1.5 Currency, Measurement Units & Valuation Basis
- 1.6 Target Stakeholders
- 1.7 Limitations & Assumptions
Chapter 2. Executive Summary
- 2.1 U.S. Pet Food Market Snapshot
- 2.1.1 Market Size – Historical (2024) & Forecast (2024-2032) (2024: USD 31,239.55 million → 2032: USD 46,979.62 million)
- 2.1.2 Volume & Revenue – National Totals (Volume Where Applicable)
- 2.1.3 Key Market Highlights – Top Five Facts
- 2.2 U.S. Pet Food Market Segmentation Snapshot
- 2.2.1 Market Split by Subnational Area – 2024 vs. 2032
- 2.3 Competitive Snapshot
- 2.3.1 Top 10 Players by Revenue Share – 2024
- 2.3.2 Top 10 Players by Volume Share – 2024 (Volume Where Applicable)
- 2.3.3 Recent Strategic Developments (18-Month Summary)
- 2.4 Key Investment Highlights & Strategic Conclusions
Chapter 3. U.S. Pet Food Market Dynamics & Industry Analysis
- 3.1 Market Overview & Context
- 3.1.1 U.S. Pet Food Market Position in the Broader Industry Value Chain
- 3.1.2 Demand Structure & Purchasing Dynamics
- 3.1.3 Market Maturity & Development Stage Across Domestic Markets
- 3.2 U.S. Pet Food Market Drivers
- 3.3 U.S. Pet Food Market Restraints & Challenges
- 3.4 U.S. Pet Food Market Opportunities
- 3.5 Porter's Five Forces Analysis
- 3.5.1 Threat of New Entrants
- 3.5.2 Bargaining Power of Suppliers
- 3.5.3 Bargaining Power of Buyers
- 3.5.4 Threat of Substitutes
- 3.5.5 Competitive Rivalry – Intensity Assessment
- 3.6 U.S. Pet Food Market Value Chain Analysis
- 3.6.1 Upstream – Key Inputs, Resources & Suppliers
- 3.6.1.1 Key Input/Resource 1
- 3.6.1.2 Key Input/Resource 2
- 3.6.1.3 Key Input/Resource 3
- 3.6.2 Midstream – Core Operations & Value Creation
- 3.6.2.1 Operating Model & Process Overview
- 3.6.2.2 Key Operating Locations & Capabilities by Company
- 3.6.3 Downstream – Market Channels & End Users
- 3.6.3.1 Direct Sales & Customer Engagement Channels
- 3.6.3.2 Indirect Sales, Intermediaries & Partner Channels
- 3.6.4 Value Chain Profitability Analysis
- 3.6.1 Upstream – Key Inputs, Resources & Suppliers
- 3.7 PESTEL Analysis
- 3.7.1 Political Factors
- 3.7.2 Economic Factors
- 3.7.3 Social Factors
- 3.7.4 Technological Factors
- 3.7.5 Environmental Factors
- 3.7.6 Legal Factors
- 3.8 U.S. Pet Food Market Supply Chain Analysis
- 3.8.1 Critical Input & Resource Availability Risk Assessment
- 3.8.2 Supplier & Operational Concentration Risk (Geographic Exposure)
- 3.8.3 Supply & Service Disruption Impact Analysis
- 3.9 National & Subnational Regulatory Landscape
Note: The regulatory and policy landscape section covers regulations based on their applicability to the market, U.S. Pet Food Market category, geography, and scope of the study. Only regulatory frameworks with a material impact on operations, compliance, trade, sustainability, or market access are analyzed in detail.
Chapter 4. Key Investment Pockets & Opportunity Analysis
- 4.1 U.S. Pet Food Market Attractiveness Analysis
- 4.1.1 By Subnational Area – Investment Attractiveness Matrix (Market Size × CAGR)
- 4.2 Absolute Revenue Growth Opportunity
- 4.2.1 By Subnational Area – Absolute Revenue Growth Through 2032
- 4.3 Incremental Demand Opportunity
- 4.3.1 By Subnational Area – Incremental Demand Through 2032
- 4.3.2 Segment – Incremental Demand
- 4.4 Emerging Submarket Opportunity Deep Dive (Subject to Applicability)
- 4.5 Priority Domestic Market Opportunity Scorecards
- 4.5.1 Priority Domestic Market 1
- 4.5.2 Priority Domestic Market 2
- 4.5.3 Priority Domestic Market 3
- 4.5.4 Priority Domestic Market 4
Note: Domestic market scorecards cover relevant states, provinces, territories, cities, or economic zones within the selected country. Numbered entries are populated with market names suited to the national administrative structure and research scope. Geographic share tables use one consistent, nonoverlapping set of areas.
Chapter 5. U.S. Pet Food Market Cross-Border Trade & Market Access Analysis
- 5.1 National Trade & International Partner Overview
- 5.1.1 Export Value by Destination Country (2024)
- 5.1.2 Export Volume by Destination Country (2024) (Where Applicable)
- 5.1.3 Import Value by Source Country (2024)
- 5.1.4 Import Volume by Source Country (2024) (Where Applicable)
- 5.1.5 National & Partner-Country Trade Balances (2024)
- 5.2 Export Analysis – Segment
- 5.2.1 Category 1 (Applicable Classification Code)
- 5.2.2 Category 2 (Applicable Classification Code)
- 5.2.3 Category 3 (Applicable Classification Code)
- 5.2.4 Category 4 (Applicable Classification Code)
- 5.2.5 Category 5 (Applicable Classification Code)
- 5.3 Import Analysis – Segment
- 5.3.1 Category 1 (Applicable Classification Code)
- 5.3.2 Category 2 (Applicable Classification Code)
- 5.3.3 Category 3 (Applicable Classification Code)
- 5.3.4 Category 4 (Applicable Classification Code)
- 5.3.5 Category 5 (Applicable Classification Code)
- 5.4 Cross-Border Pricing & Transaction Benchmarks
- 5.4.1 Export Pricing – Segment & Destination Country
- 5.4.2 Import Pricing – Segment & Source Country
- 5.4.3 Price Trends (2024)
- 5.5 Key Cross-Border Trade & Delivery Routes
- 5.5.1 Cross-Border Trade/Delivery Route 1
- 5.5.2 Cross-Border Trade/Delivery Route 2
- 5.5.3 Cross-Border Trade/Delivery Route 3
- 5.5.4 Cross-Border Trade/Delivery Route 4
- 5.5.5 Cross-Border Trade/Delivery Route 5
- 5.6 Trade Policy & Market Access Impact Assessment
- 5.6.1 Tariff & Non-Tariff Barriers
- 5.6.2 National Participation in Regional Trade & Economic Frameworks
- 5.6.3 Bilateral & Multilateral Trade Agreements
- 5.6.4 Cross-Border Operating, Licensing & Localization Requirements
Note: This chapter covers international trade relevant to U.S. Pet Food Market in the selected country. Exports are analyzed by destination and imports by source. Domestic interregional flows are excluded from international trade totals. Goods, services, and digital offerings use applicable classifications; volume and route analyses apply only where meaningful.
Chapter 6. Competitive Landscape & Company Benchmarking
- 6.1 U.S. Pet Food Market Concentration & Structure
- 6.1.1 Herfindahl-Hirschman Index (HHI) – vs. 2024
- 6.1.2 Leading, Mid-Sized & Emerging Player Structure
- 6.1.3 Multinational, National & Local Player Dynamics
- 6.2 U.S. Pet Food Market Share Analysis – 2024
- 6.2.1 National Revenue Share by Company
- 6.2.2 National Volume Share by Company (Volume Where Applicable)
- 6.2.3 Company Revenue Share by Subnational Area
- 6.2.4 Market Share Evolution ( vs. 2024)
- 6.2.5 Company Market Share by Key Segment
- 6.2.6 Company Market Share by Customer Group
- 6.3 Operating Scale, Capacity & Infrastructure Analysis
- 6.3.1 National Operating Scale & Supply Capacity
- 6.3.2 Resource Utilization & Operating Efficiency
- 6.3.3 Output, Service Delivery & Activity Metrics
- 6.3.4 Operating Footprint & Infrastructure Map
- 6.3.5 Planned Operational & Capacity Expansion
- 6.4 U.S. Pet Food Market Competitive Benchmarking Matrix
- 6.4.1 Revenue, Growth, Profitability & Operating Metric Comparison
- 6.4.2 Channel Revenue Mix
- 6.4.3 Revenue Exposure Across Domestic Markets
- 6.4.4 R&D Intensity
- 6.4.5 Sustainability Maturity
- 6.5 Strategic Developments in U.S. Pet Food Market (Last 24 Months)
- 6.5.1 Mergers, Acquisitions & Divestments
- 6.5.2 New Products, Services & Solutions in U.S. Pet Food Market
- 6.5.3 Operational & Infrastructure Expansions
- 6.5.4 Strategic Alliances, Joint Ventures & Partnerships
- 6.5.5 Distribution Expansion & Market Entry
- 6.5.6 Sustainability & ESG Initiatives
- 6.6 Competitive Strategy Mapping
- 6.6.1 Leader, Challenger, Follower & Niche Classification
- 6.6.2 Pricing Strategy Comparison
- 6.6.3 Channel Strategy Matrix
Note: Strategic developments are included based on their materiality and the availability of reliable information.
Chapter 7. U.S. Pet Food Market – By Sales & Delivery Channel
- 7.1 Segment Overview
- 7.1.1 Volume & Revenue Split by Channel (2024 & 2032) (Volume Where Applicable)
- 7.1.2 Channel Mix Evolution (2024-2032)
Chapter 8. Subnational Market Analysis – Country Overview
- 8.1 Domestic Geographic Market Overview
- 8.1.1 Subnational Volume Share (Where Applicable)
- 8.1.2 Subnational Revenue Share
- 8.1.3 Market Volume by Subnational Area (Where Applicable)
- 8.1.4 Market Revenue by Subnational Area
- 8.1.5 Subnational Forecasts Through 2032
- 8.2 Cross-Area Segment Analysis Within the Country
- 8.2.1 By Sales & Delivery Channel
- 8.2.2 By Competitive Positioning & Price Tier
Chapter 9. U.S. Pet Food Market – Priority Domestic Market 1
Chapter 10. U.S. Pet Food Market – Priority Domestic Market 2
Chapter 11. U.S. Pet Food Market – Priority Domestic Market 3
Chapter 12. U.S. Pet Food Market – Priority Domestic Market 4
Chapter 13. U.S. Pet Food Market Company Profiles
- 13.1 [Company 01]
- 13.1.1 Company Overview
- 13.1.2 Key Management Personnel
- 13.1.3 Products & Services Portfolio
- 13.1.4 Financial Performance
- 13.1.5 Domestic Market Focus & Local Operating Presence
- 13.1.6 Recent Developments & Strategic Initiatives
Note: The company profile list is preliminary and may change based on research findings, market developments, data availability, and client requirements.
Chapter 14. Appendices
- Appendix A – List of Abbreviations & Acronyms
- Appendix B – Industry Classification Code Reference – Full Series
- Appendix C – Supply, Output & Operating Capacity Data Tables
- Appendix D – End-Use & Demand Base Tables
- Appendix E – Demand, Adoption & Usage Assumptions
- Appendix F – Pricing & Revenue Metric Reference Tables
- Appendix G – Company Operations & Infrastructure Database
- Appendix H – Cross-Border Trade & Activity Data Tables (Where Applicable)
- Appendix I – Regulatory Summary Tables
- Appendix J – Primary Research Participant List (Anonymized)
- Appendix K – Primary Research Questionnaire Framework
- Appendix L – Data Sources & Bibliography
- Appendix M – Market Size Divergence & Source Comparison
Chapter 15. Research Methodology
- 15.1 Research Framework & Philosophy
- 15.2 Secondary Research – Sources, Hierarchy & Data Extraction
- 15.3 Data Modeling – National Market Sizing & Subnational Allocation
- 15.4 Primary Research – Stakeholder Framework, LOI & Sample Sizes
- 15.5 Forecast Methodology – Regression, Scenario & Sensitivity Analysis
- 15.6 Quality Control – Four-Layer Validation Framework
- 15.7 Limitations & Standard Assumptions
- 15.8 Disclaimer
