CHAPTER NO. 1 : GENESIS OF THE MARKET
1.1 Market Prelude – Introduction & Scope
1.2 The Big Picture – Objectives & Vision
1.3 Strategic Edge – Unique Value Proposition
1.4 Stakeholder Compass – Key Beneficiaries
CHAPTER NO. 2 : EXECUTIVE LENS
2.1 Pulse of the Industry – Market Snapshot
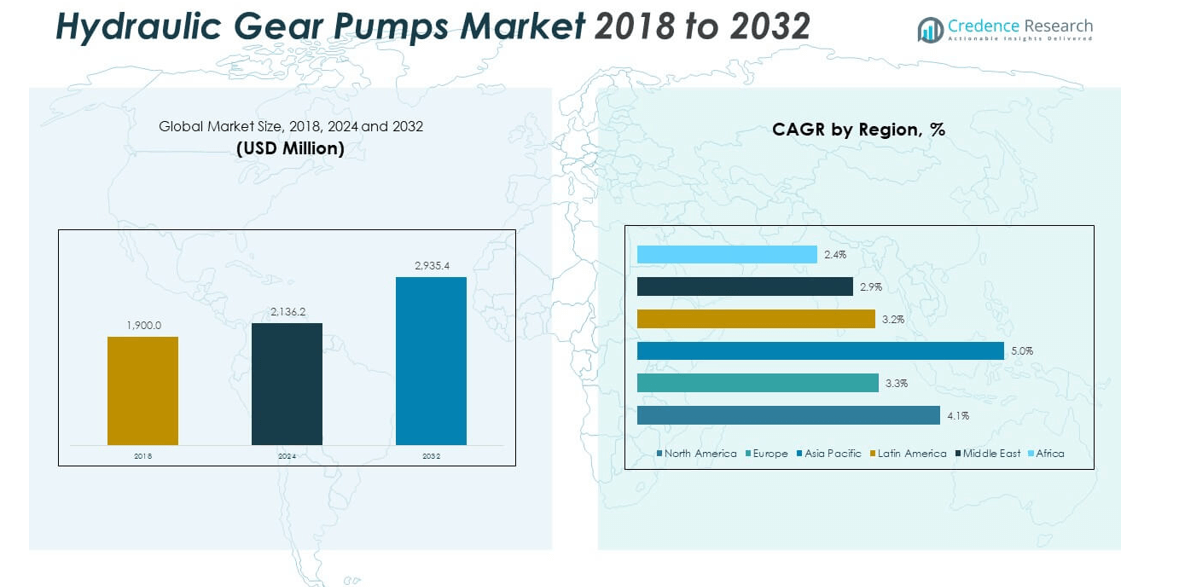
2.2 Growth Arc – Revenue Projections (USD Million)
2.3. Premium Insights – Based on Primary Interviews
CHAPTER NO. 3 : HYDRAULIC GEAR PUMPS MARKET FORCES & INDUSTRY PULSE
3.1 Foundations of Change – Market Overview
3.2 Catalysts of Expansion – Key Market Drivers
3.2.1 Momentum Boosters – Growth Triggers
3.2.2 Innovation Fuel – Disruptive Technologies
3.3 Headwinds & Crosswinds – Market Restraints
3.3.1 Regulatory Tides – Compliance Challenges
3.3.2 Economic Frictions – Inflationary Pressures
3.4 Untapped Horizons – Growth Potential & Opportunities
3.5 Strategic Navigation – Industry Frameworks
3.5.1 Market Equilibrium – Porter’s Five Forces
3.5.2 Ecosystem Dynamics – Value Chain Analysis
3.5.3 Macro Forces – PESTEL Breakdown
3.6 Price Trend Analysis
3.6.1 Regional Price Trend
3.6.2 Price Trend by product
CHAPTER NO. 4 : KEY INVESTMENT EPICENTER
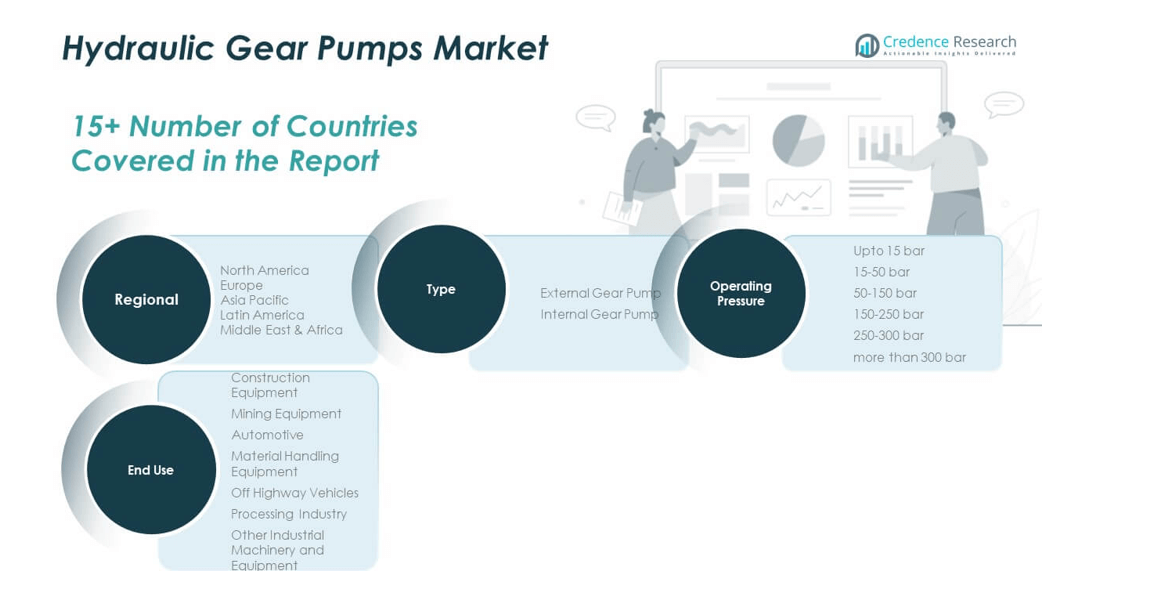
4.1 Regional Goldmines – High-Growth Geographies
4.2 End Use Frontiers – Lucrative End Use Categories
4.3 Operating Pressure Sweet Spots – Emerging Demand Segments
CHAPTER NO. 5: REVENUE TRAJECTORY & WEALTH MAPPING
5.1 Momentum Metrics – Forecast & Growth Curves
5.2 Regional Revenue Footprint – Market Share Insights
5.3 Segmental Wealth Flow – Type & Operating Pressure Revenue
CHAPTER NO. 6 : TRADE & COMMERCE ANALYSIS
6.1. Import Analysis by Region
6.1.1. Global Hydraulic Gear Pumps Market Import Revenue By Region
6.2. Export Analysis by Region
6.2.1. Global Hydraulic Gear Pumps Market Export Revenue By Region
CHAPTER NO. 7 : COMPETITION ANALYSIS
7.1. Company Market Share Analysis
7.1.1. Global Hydraulic Gear Pumps Market: Company Market Share
7.2. Global Hydraulic Gear Pumps Market Company Revenue Market Share
7.3. Strategic Developments
7.3.1. Acquisitions & Mergers
7.3.2. New End Use Launch
7.3.3. Regional Expansion
7.4. Competitive Dashboard
7.5. Company Assessment Metrics, 2024
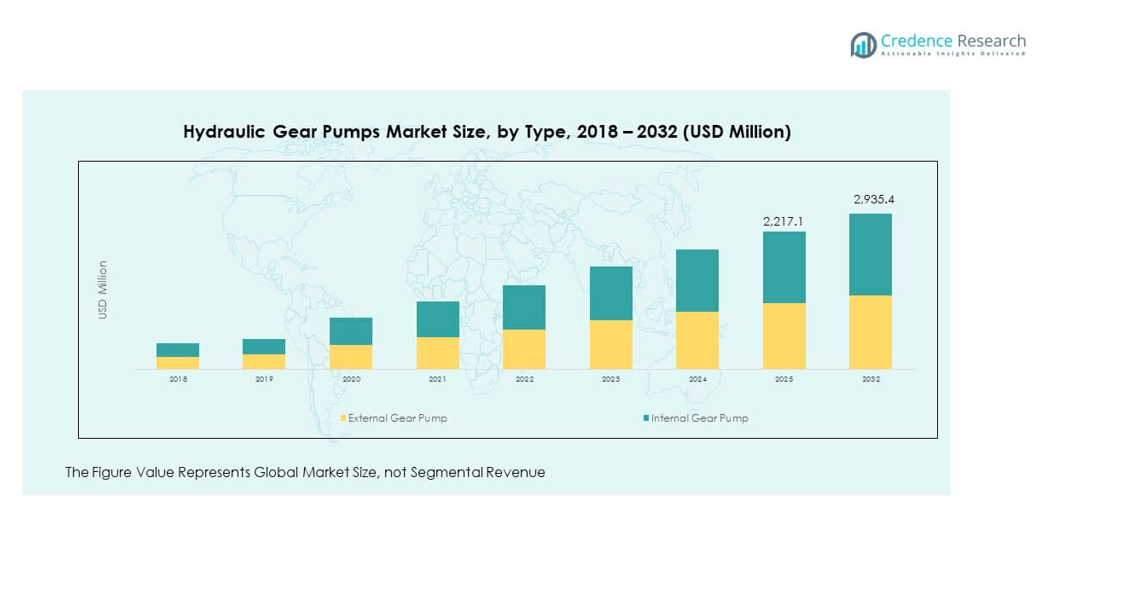
CHAPTER NO. 8 : HYDRAULIC GEAR PUMPS MARKET – BY TYPE SEGMENT ANALYSIS
8.1. Hydraulic Gear Pumps Market Overview by Type Segment
8.1.1. Hydraulic Gear Pumps Market Revenue Share By Type
8.2. External Gear Pump
8.3. Internal Gear Pump
CHAPTER NO. 9 : HYDRAULIC GEAR PUMPS MARKET – BY OPERATING PRESSURE SEGMENT ANALYSIS
9.1. Hydraulic Gear Pumps Market Overview by Operating Pressure Segment
9.1.1. Hydraulic Gear Pumps Market Revenue Share By Operating Pressure
9.2. Upto 15 bar
9.3. 15-50 bar
9.4. 50-150 bar
9.5. 150-250 bar
9.6. 250-300 bar
9.7. More than 300 bar
CHAPTER NO. 10 : HYDRAULIC GEAR PUMPS MARKET – BY END USE SEGMENT ANALYSIS
10.1. Hydraulic Gear Pumps Market Overview by End Use Segment
10.1.1. Hydraulic Gear Pumps Market Revenue Share By End Use
10.2. Construction Equipment
10.3. Mining Equipment
10.4. Automotive
10.5. Material Handling Equipment
10.6. Off Highway Vehicles
10.7. Processing Industry
10.8. Other Industrial Machinery and Equipment
CHAPTER NO. 11 : HYDRAULIC GEAR PUMPS MARKET – REGIONAL ANALYSIS
11.1. Hydraulic Gear Pumps Market Overview by Region Segment
11.1.1. Global Hydraulic Gear Pumps Market Revenue Share By Region
11.1.3. Regions
11.1.4. Global Hydraulic Gear Pumps Market Revenue By Region
.1.6. Type
11.1.7. Global Hydraulic Gear Pumps Market Revenue By Type
11.1.9. Operating Pressure
11.1.10. Global Hydraulic Gear Pumps Market Revenue By Operating Pressure
11.1.12. End Use
11.1.13. Global Hydraulic Gear Pumps Market Revenue By End Use
CHAPTER NO. 12 : NORTH AMERICA HYDRAULIC GEAR PUMPS MARKET – COUNTRY ANALYSIS
12.1. North America Hydraulic Gear Pumps Market Overview by Country Segment
12.1.1. North America Hydraulic Gear Pumps Market Revenue Share By Region
12.2. North America
12.2.1. North America Hydraulic Gear Pumps Market Revenue By Country
12.2.2. Type
12.2.3. North America Hydraulic Gear Pumps Market Revenue By Type
12.2.4. Operating Pressure
12.2.5. North America Hydraulic Gear Pumps Market Revenue By Operating Pressure
2.2.6. End Use
12.2.7. North America Hydraulic Gear Pumps Market Revenue By End Use
2.3. U.S.
12.4. Canada
12.5. Mexico
CHAPTER NO. 13 : EUROPE HYDRAULIC GEAR PUMPS MARKET – COUNTRY ANALYSIS
13.1. Europe Hydraulic Gear Pumps Market Overview by Country Segment
13.1.1. Europe Hydraulic Gear Pumps Market Revenue Share By Region
13.2. Europe
13.2.1. Europe Hydraulic Gear Pumps Market Revenue By Country
13.2.2. Type
13.2.3. Europe Hydraulic Gear Pumps Market Revenue By Type
13.2.4. Operating Pressure
13.2.5. Europe Hydraulic Gear Pumps Market Revenue By Operating Pressure
13.2.6. End Use
13.2.7. Europe Hydraulic Gear Pumps Market Revenue By End Use
13.3. UK
13.4. France
13.5. Germany
13.6. Italy
13.7. Spain
13.8. Russia
13.9. Rest of Europe
CHAPTER NO. 14 : ASIA PACIFIC HYDRAULIC GEAR PUMPS MARKET – COUNTRY ANALYSIS
14.1. Asia Pacific Hydraulic Gear Pumps Market Overview by Country Segment
14.1.1. Asia Pacific Hydraulic Gear Pumps Market Revenue Share By Region
14.2. Asia Pacific
14.2.1. Asia Pacific Hydraulic Gear Pumps Market Revenue By Country
14.2.2. Type
14.2.3. Asia Pacific Hydraulic Gear Pumps Market Revenue By Type
14.2.4. Operating Pressure
14.2.5. Asia Pacific Hydraulic Gear Pumps Market Revenue By Operating Pressure
14.2.5. End Use
14.2.7. Asia Pacific Hydraulic Gear Pumps Market Revenue By End Use
14.3. China
14.4. Japan
14.5. South Korea
14.6. India
14.7. Australia
14.8. Southeast Asia
14.9. Rest of Asia Pacific
CHAPTER NO. 15 : LATIN AMERICA HYDRAULIC GEAR PUMPS MARKET – COUNTRY ANALYSIS
15.1. Latin America Hydraulic Gear Pumps Market Overview by Country Segment
15.1.1. Latin America Hydraulic Gear Pumps Market Revenue Share By Region
15.2. Latin America
15.2.1. Latin America Hydraulic Gear Pumps Market Revenue By Country
15.2.2. Type
15.2.3. Latin America Hydraulic Gear Pumps Market Revenue By Type
15.2.4. Operating Pressure
15.2.5. Latin America Hydraulic Gear Pumps Market Revenue By Operating Pressure
15.2.6. End Use
15.2.7. Latin America Hydraulic Gear Pumps Market Revenue By End Use
15.3. Brazil
15.4. Argentina
15.5. Rest of Latin America
CHAPTER NO. 16 : MIDDLE EAST HYDRAULIC GEAR PUMPS MARKET – COUNTRY ANALYSIS
16.1. Middle East Hydraulic Gear Pumps Market Overview by Country Segment
16.1.1. Middle East Hydraulic Gear Pumps Market Revenue Share By Region
16.2. Middle East
16.2.1. Middle East Hydraulic Gear Pumps Market Revenue By Country
16.2.2. Type
16.2.3. Middle East Hydraulic Gear Pumps Market Revenue By Type
16.2.4. Operating Pressure
16.2.5. Middle East Hydraulic Gear Pumps Market Revenue By Operating Pressure
16.2.6. End Use
16.2.7. Middle East Hydraulic Gear Pumps Market Revenue By End Use
16.3. GCC Countries
16.4. Israel
16.5. Turkey
16.6. Rest of Middle East
CHAPTER NO. 17 : AFRICA HYDRAULIC GEAR PUMPS MARKET – COUNTRY ANALYSIS
17.1. Africa Hydraulic Gear Pumps Market Overview by Country Segment
17.1.1. Africa Hydraulic Gear Pumps Market Revenue Share By Region
17.2. Africa
17.2.1. Africa Hydraulic Gear Pumps Market Revenue By Country
17.2.2. Type
17.2.3. Africa Hydraulic Gear Pumps Market Revenue By Type
17.2.4. Operating Pressure
17.2.5. Africa Hydraulic Gear Pumps Market Revenue By Operating Pressure
17.2.6. End Use
17.2.7. Africa Hydraulic Gear Pumps Market Revenue By End Use
17.3. South Africa
17.4. Egypt
17.5. Rest of Africa
CHAPTER NO. 18 : COMPANY PROFILES
18.1. Eaton Corporation Plc
18.1.1. Company Overview
18.1.2. End Use Portfolio
18.1.3. Financial Overview
18.1.4. Recent Developments
18.1.5. Growth Strategy
18.1.6. SWOT Analysis
18.2. PARKER HANNIFIN CORP
18.3. Bucher Hydraulics Gmbh
18.4. KYB Corporation
18.5. Bosch Rexroth AG
18.6. CASAPPA S.p.A.
18.7. Dynamatic Technologies Ltd.
18.8. Linde Hydraulics GmbH & Co. KG
18.9. Roper Pump Company
18.10. Kawasaki Heavy Industries, Ltd.
18.11. Concentric AB
18.12. Viking Pump Inc..
18.13. Hema Endüstri A.S.
18.14. Settima Meccanica Srl
18.15. Marzocchi Pompe S.p.A.
18.16. Gemma Automotive
18.17. Daikin Industries Ltd
18.18. Eckerle
18.19. KSB SE & Co. KGaA
18.20. GVR POMPE SRL