Market Overview
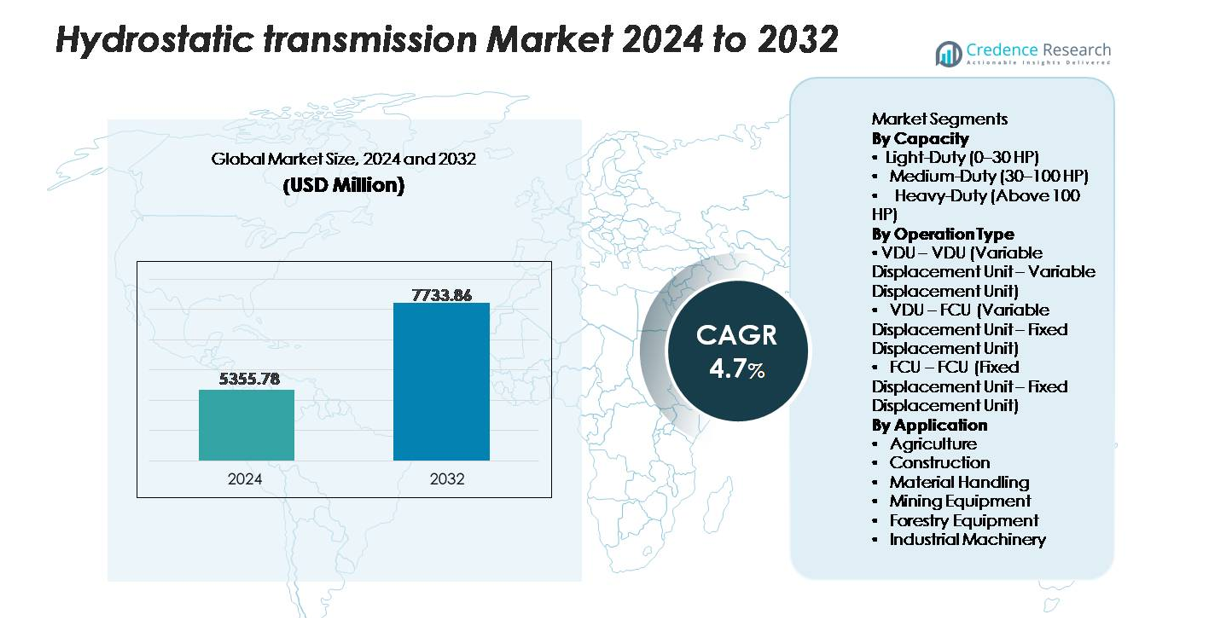
The hydrostatic transmission market was valued at USD 5,355.78 million in 2024 and is projected to reach USD 7,733.86 million by 2032, growing at a CAGR of 4.3% during the forecast period (2025–2032).
| REPORT ATTRIBUTE |
DETAILS |
| Historical Period |
2020-2023 |
| Base Year |
2024 |
| Forecast Period |
2025-2032 |
| Hydrostatic Transmission Market Size 2024 |
USD 5,355.78 million |
| Hydrostatic Transmission Market, CAGR |
4.3% |
| Hydrostatic Transmission Market Size 2032 |
USD 7,733.86 million |
The hydrostatic transmission market is characterized by strong participation from global OEMs and specialist hydraulic system manufacturers that focus on advanced pump–motor technologies, electronically controlled displacement units, and high-efficiency variable drive systems. Companies continuously invest in improving torque delivery, thermal stability, and energy efficiency to support heavy-duty construction, agricultural, and material-handling machinery. Asia-Pacific leads the market with an exact share of 36%, driven by rapid industrialization, rising mechanization, and expanding construction activities. North America and Europe follow, supported by high adoption of precision-controlled equipment, well-established manufacturing bases, and strong demand for technologically advanced hydrostatic systems across off-highway applications.
Market Insights
- The hydrostatic transmission market was valued at USD 5,355.78 million in 2024 and is projected to reach USD 7,733.86 million by 2032, registering a CAGR of 4.3%, driven by increasing integration of advanced hydraulic control technologies.
- Market drivers include the rising demand for high-torque, precision-controlled machinery in construction and agriculture, with the Heavy-Duty (Above 100 HP) segment holding the largest share due to its extensive use in loaders, tractors, and mining equipment.
- Key trends highlight accelerating adoption of electronically controlled variable displacement units, improved energy efficiency, and the shift toward compact and multifunctional off-highway equipment.
- Competitive activity focuses on technology enhancement, durability improvements, and hybrid electro-hydrostatic designs, although high system costs and integration complexity continue to restrain adoption in cost-sensitive regions.
- Regionally, Asia-Pacific leads with 36% market share, followed by North America at 32% and Europe at 28%, supported by strong industrial growth and expanding mechanization across core applications.
Access crucial information at unmatched prices!
Request your sample report today & start making informed decisions powered by Credence Research Inc.!
Download Sample
Market Segmentation Analysis
By Capacity
The capacity segmentation highlights varying performance needs across industries, with the Heavy-Duty (Above 100 HP) sub-segment holding the dominant market share. Its leadership is driven by widespread adoption in construction loaders, mining vehicles, and high-horsepower agricultural tractors that require continuous torque delivery and responsive control under heavy load. The Medium-Duty (30–100 HP) segment follows, supported by expanding use in compact construction and mid-sized farm equipment. Light-Duty (0–30 HP) systems serve lawn care machinery and small utility vehicles but remain a smaller share due to limited torque and application scope.
- For instance, Poclain Hydraulics’ high-torque MS125 motor, used in heavy-duty hydrostatic drivetrains, delivers up to 77,000 N·m (56,792 lb-ft) of output torque with displacement options ranging from 10,000 cm³/rev to 15,000 cm³/rev, enabling reliable propulsion in machines exceeding the 100-HP class (up to 240 kW or ~322 HP).
By Operation Type
By operation type, the VDU–VDU (Variable Displacement Unit–Variable Displacement Unit) configuration accounts for the largest market share due to its high efficiency, precise flow regulation, and superior adaptability to fluctuating load conditions. It is preferred in advanced construction machinery and heavy agricultural equipment where continuous speed modulation is required. The VDU–FCU combination is gaining traction for mid-range machines seeking a balance between performance and cost. Meanwhile, FCU–FCU remains the least dominant, primarily used in basic, price-sensitive equipment where constant output is adequate and advanced control features are not essential.
- For instance, Hydro-Gear’s popular residential-grade ZT-2200 (EZT) transaxle utilizes a durable 10 cc variable-displacement pump and a 10 cc fixed-displacement motor within a single, low-maintenance unit to offer variable speed control, a necessary function for steering and operation of zero-turn mowers.
By Application
Across applications, Construction remains the dominant sub-segment, driven by growing demand for hydrostatic systems in excavators, skid-steer loaders, road rollers, and compact track loaders requiring smooth speed transitions and high starting torque. Agriculture follows closely as tractors, harvesters, and sprayers increasingly shift to hydrostatic drives for enhanced operational maneuverability. Material handling equipment such as forklifts and telehandlers further contributes to growth due to rising warehouse automation. Mining, forestry, and industrial machinery segments show steady uptake, powered by the need for reliable transmission performance in high-gradient, heavy-load, and continuous-duty environments.
Key Growth Drivers
Rising Adoption of Precision-Control Systems Across Off-Highway Machinery
A major driver for the hydrostatic transmission market is the accelerating adoption of precision-control systems in off-highway machinery, as industries increasingly prioritize equipment that delivers smooth torque, variable speed control, and responsive maneuverability. Hydrostatic transmissions support these requirements by enabling seamless transitions between forward and reverse motion without mechanical shifting, reducing operator fatigue and improving efficiency in dense operational settings such as construction sites, farmlands, and mining pits. As OEMs integrate advanced hydraulic pumps and electronically controlled displacement units, machine performance becomes more adaptive to real-time load changes, enhancing productivity in demanding applications. This shift is particularly prominent in skid steer loaders, compact track loaders, and mid-to-large agricultural tractors, all of which rely on hydrostatic systems to improve traction and operational stability. The growing focus on terrain adaptability and fine speed modulation further reinforces the market’s long-term demand trajectory.
- For instance, Danfoss Power Solutions’ H1 bent-axis variable-displacement pump—widely used in precision-control hydrostatic drive systems—operates at pressures up to 480 bar and offers a displacement range up to 250 cm³/rev, enabling highly responsive traction control in skid steer loaders and compact track equipment.
Expanding Mechanization in Agriculture and Construction Sectors
Accelerated mechanization in agriculture and construction significantly boosts demand for hydrostatic transmissions, as both sectors depend on reliable, high-torque systems capable of operating in varied and challenging environments. Agricultural equipment such as harvesters, sprayers, and utility tractors increasingly adopt hydrostatic drives to achieve precise speed control during field operations, reducing crop damage and improving yield efficiency. Similarly, construction machinery—including excavators, compact loaders, wheel loaders, and road rollers—benefits from hydrostatic systems that support frequent speed adjustments, heavy load handling, and multidirectional movements. Government-led infrastructure expansion programs and rising labor cost pressures further encourage contractors to deploy advanced machinery equipped with modern hydrostatic units. Additionally, the trend toward compact and multifunctional equipment in urban construction strengthens market growth, as hydrostatic transmissions are well suited for tight workspace operations that require superior maneuverability and high torque at low speeds.
- For instance, John Deere 8R series tractors incorporate an Infinitely Variable Transmission (IVT™) (also known as AutoPowr™ in some markets) or a robust, highly mechanical e23™ PowerShift transmission, capable of handling system pressures in the main hydraulic circuit up to approximately 204 bar (2,958 psi).
Shift Toward Higher Equipment Durability and Reduced Maintenance Requirements
The market is also driven by increasing preference for durable, low-maintenance powertrain systems that reduce equipment downtime and extend operational life cycles. Hydrostatic transmissions, with fewer mechanical components and no conventional gear sets, offer lower wear rates and require less frequent servicing compared to mechanical counterparts. This reliability is crucial for industries operating continuous-duty equipment, such as mining, forestry, industrial processing, and large-scale farming. Operators value the reduced risk of transmission failure and improved system longevity, especially under high-load or gradient-intensive conditions. Furthermore, modern hydrostatic units integrate thermal management systems and advanced filtration technologies that enhance fluid quality and reduce operational heat stress. These advancements lower lifecycle costs for equipment owners and strengthen the appeal of hydrostatic systems in fleet-intensive industries. As sustainability considerations grow, the ability to maintain high energy efficiency and prolong equipment lifespan further elevates the value proposition of hydrostatic transmission solutions.
Key Trends & Opportunities
Integration of Electronic Controls and Smart Hydraulic Systems
A major trend reshaping the hydrostatic transmission market is the integration of electronic control units (ECUs), sensors, and smart hydraulic technologies into modern equipment. These enhancements enable real-time monitoring of displacement, pressure, and flow rates, allowing machinery to automatically adjust to varying load requirements. Electronic control improves responsiveness, optimizes fuel usage, and enhances operator comfort, particularly in high-precision applications such as harvesting, grading, or material handling. Manufacturers are increasingly offering hybrid electro-hydraulic solutions that combine hydraulic power with digital control precision, creating opportunities for advanced automation features, predictive rithms, and adaptive speed control. As industries move toward semi-autonomous and autonomous emaintenance algoquipment, intelligent hydrostatic systems become foundational in enabling machine learning–based performance optimization. This trend opens significant commercial opportunities for OEMs specializing in digitally integrated hydraulic ecosystems.
- For instance, Bosch Rexroth’s EHC electronic-hydraulic control platform uses high-resolution pressure sensors with measurement ranges up to 600 bar and proportional valves capable of delivering response times below 10 milliseconds, enabling precise closed-loop displacement control in advanced hydrostatic drive systems.
Growth of Compact Equipment and Electrified Machinery Platforms
The rising demand for compact construction and agricultural equipment presents a strong opportunity for hydrostatic transmissions, which provide the agility, fine speed control, and high torque needed for urban and small-area operations. Skid steers, mini-excavators, compact tractors, and landscaping machinery increasingly adopt hydrostatic systems to improve operational efficiency in constrained environments. Alongside compact equipment growth, the global shift toward equipment electrification creates new possibilities for electro-hydrostatic actuators and electric-hydrostatic hybrid powertrains. These configurations replace mechanical linkages with modular hydraulic systems powered by electric drives, enhancing efficiency while lowering emissions. OEMs investing in electrified platforms can leverage hydrostatic systems to deliver smoother operation, reduced noise levels, and improved functional safety. The combination of electrification and hydrostatic flexibility positions the market for substantial long-term technological advancement.
- For instance, Parker Hannifin’s EHA (Electro-Hydraulic Actuation) systems used in compact electrified machinery integrate DC electric motors rated up to 0.56 kW (0.75 HP) with a self-contained hydraulic pump unit and cylinder to deliver forces up to 21.3 kN (4,800 lbf).
Key Challenges
High System Costs and Complex Integration Requirements
One of the primary challenges facing the hydrostatic transmission market is the relatively high cost of components, including pumps, motors, valves, and electronic control systems. Compared to mechanical transmissions, hydrostatic configurations require precision machining, specialized materials, and advanced engineering to ensure durability under high-pressure conditions. This increases upfront equipment prices, making adoption more challenging for cost-sensitive buyers in emerging markets. Additionally, system integration requires expertise in hydraulic design, thermal management, and electronic calibration, which can raise engineering and production costs for OEMs. The complexity of hydrostatic assemblies also demands skilled maintenance professionals, creating operational barriers for smaller contractors and agricultural operators. Together, these factors may hinder market penetration in lower-cost equipment categories.
Efficiency Losses and Heat Generation Under Heavy Load Conditions
Another key challenge is the potential for efficiency losses in hydrostatic systems, especially under high-pressure or continuous heavy-load applications. Hydraulic power transfer inherently involves fluid friction and leakage within pumps and motors, which can reduce overall efficiency when compared to certain mechanical drive configurations. These inefficiencies lead to heat buildup, requiring robust cooling systems to maintain optimal performance. In harsh operating environments—such as mining, forestry, and high-gradient terrains—managing heat and ensuring fluid stability becomes critical. Failure to maintain proper temperature control may result in accelerated wear, reduced system life, and increased maintenance costs. OEMs must continuously innovate to minimize energy losses, improve fluid dynamics, and enhance cooling technologies to overcome these limitations.
Regional Analysis
North America
North America holds a substantial 32% market share, supported by strong adoption of hydrostatic transmissions in construction, agriculture, and forestry machinery. High mechanization rates, advanced equipment fleets, and consistent investment in infrastructure projects drive regional demand. The U.S. remains the largest contributor, owing to widespread use of hydrostatic drive systems in skid-steer loaders, compact track loaders, tractors, and industrial equipment. OEM presence and technological advancements in electro-hydraulic control systems further strengthen market growth. Increasing focus on operator safety, precision control, and productivity enhancement ensures continued dominance of the region across key end-use sectors.
Europe
Europe accounts for approximately 28% of the market, driven by stringent emission norms, high mechanization, and strong manufacturing bases in Germany, Italy, and France. The region’s emphasis on precision agriculture and sustainable construction practices accelerates the adoption of hydrostatic transmissions across tractors, harvesters, excavators, and compact machinery. European OEMs continue to invest in hybrid and electronically controlled hydrostatic systems, enhancing energy efficiency and operator comfort. Demand is further supported by forest management programs requiring reliable, high-torque machinery. With increasing preference for low-noise and high-maneuverability equipment, Europe maintains a strong position in the global market.
Asia-Pacific
Asia-Pacific leads the global market with 36% market share, driven by rapid industrialization, expanding construction activity, and rising agricultural mechanization across China, India, and Southeast Asia. Growing investment in urban development and mining strengthens demand for heavy-duty machinery equipped with hydrostatic drive systems. Local manufacturing expansion, combined with increasing entry of global OEMs, accelerates adoption of advanced hydrostatic technologies. The region’s shift toward efficient, compact, and multifunctional equipment enhances market penetration. Government-backed agricultural modernization programs further support the uptake of hydrostatic transmissions in tractors, rice harvesters, and utility machinery.
Latin America
Latin America represents around 7% of the market, influenced by growing agricultural modernization and infrastructure development in Brazil, Argentina, and Mexico. Demand for hydrostatic transmissions is increasing in sugarcane harvesters, loaders, and material-handling machinery as operators seek improved maneuverability and reduced maintenance. Construction and mining sectors also contribute to steady adoption due to the need for durable, high-torque equipment suitable for rugged terrain. However, economic fluctuations and budget-sensitive buyers moderately limit penetration of high-cost hydrostatic systems. Nonetheless, rising mechanization trends position the region for gradual, stable market expansion.
Middle East & Africa (MEA)
MEA holds approximately 5% market share, supported by expanding construction activity, infrastructure investments, and rising deployment of mining and material-handling machinery. Gulf countries drive demand for hydrostatic systems in compact loaders, road construction equipment, and industrial machinery used in logistics hubs. In Africa, agricultural modernization initiatives and mining development gradually increase hydrostatic transmission adoption, especially in tractors, haulage equipment, and utility vehicles. Market growth is tempered by cost constraints and limited availability of skilled service technicians. However, increasing preference for durable, low-maintenance machinery offers promising long-term opportunities.
Market Segmentations:
By Capacity
- Light-Duty (0–30 HP)
- Medium-Duty (30–100 HP)
- Heavy-Duty (Above 100 HP)
By Operation Type
- VDU – VDU (Variable Displacement Unit – Variable Displacement Unit)
- VDU – FCU (Variable Displacement Unit – Fixed Displacement Unit)
- FCU – FCU (Fixed Displacement Unit – Fixed Displacement Unit)
By Application
- Agriculture
- Construction
- Material Handling
- Mining Equipment
- Forestry Equipment
- Industrial Machinery
By Geography
- North America
- Europe
- Germany
- France
- U.K.
- Italy
- Spain
- Rest of Europe
- Asia Pacific
- China
- Japan
- India
- South Korea
- South-east Asia
- Rest of Asia Pacific
- Latin America
- Brazil
- Argentina
- Rest of Latin America
- Middle East & Africa
- GCC Countries
- South Africa
- Rest of the Middle East and Africa
Competitive Landscape
The competitive landscape of the hydrostatic transmission market is defined by a mix of global OEMs and specialized hydraulic system manufacturers that prioritize advanced engineering, durability, and energy-efficient performance. Leading companies focus on expanding their portfolios of variable displacement pumps, high-pressure motors, intelligent electronic controls, and electro-hydrostatic solutions to support the growing demand across construction, agriculture, material handling, and mining machinery. Competitors emphasize improving torque density, thermal management, and system responsiveness to meet the performance expectations of next-generation equipment platforms. Strategic initiatives include technological collaborations, capacity expansions, and integration of smart diagnostics to strengthen aftermarket service capabilities. As equipment electrification accelerates, major players increasingly invest in hybrid and modular powertrain designs that combine hydraulic precision with electronic control efficiency. Despite strong competition, differentiation is driven by reliability, customization flexibility, and lifecycle cost optimization, positioning technologically advanced manufacturers at the forefront of market growth.
Shape Your Report to Specific Countries or Regions & Enjoy 30% Off!
Key Player Analysis
Recent Developments
- In Nov 2025, At IAA 2025, ZF presented its further-developed “8HP evo” automatic transmission — while not strictly hydrostatic, it reflects ZF’s drive system evolution.
- In Feb 2025, Announced a partnership: “Smartec Components Partner with Danfoss Plus+1®” – implementing a drive-by-wire system (control electronics) for integrated hydrostatic drive systems.
- In Oct 2024, Poclain featured its new HEVO technology at the 2024 Maha Fluid Power Conference: a new cam-lobe radial-piston motor architecture enabling motor pressure up to 800 bar (≈11,600 psi) to boost torque and improve hydrostatic transmission efficiency
Report Coverage
The research report offers an in-depth analysis based on Capacity, Operation type, Application and Geography. It details leading market players, providing an overview of their business, product offerings, investments, revenue streams, and key applications. Additionally, the report includes insights into the competitive environment, SWOT analysis, current market trends, as well as the primary drivers and constraints. Furthermore, it discusses various factors that have driven market expansion in recent years. The report also explores market dynamics, regulatory scenarios, and technological advancements that are shaping the industry. It assesses the impact of external factors and global economic changes on market growth. Lastly, it provides strategic recommendations for new entrants and established companies to navigate the complexities of the market.
Future Outlook
- The market will continue expanding as construction and agricultural machinery increasingly adopt precision-controlled hydrostatic drive systems.
- Equipment electrification will accelerate the shift toward electro-hydrostatic and hybrid powertrain solutions.
- Variable displacement technologies will gain prominence as OEMs aim to enhance energy efficiency and operational responsiveness.
- Compact equipment demand will rise, strengthening the use of hydrostatic systems in mini loaders, compact tractors, and utility machinery.
- Mining and forestry sectors will adopt more heavy-duty hydrostatic units to improve torque delivery and durability.
- Advancements in electronic controls and onboard diagnostics will improve system reliability and predictive maintenance.
- Manufacturers will invest more in thermal management innovations to overcome heat generation challenges.
- Integration of smart hydraulics will support semi-autonomous and autonomous machinery development.
- Aftermarket services and component refurbishment will grow as fleet operators prioritize lifecycle optimization.
- Asia-Pacific will remain the fastest-growing region, supported by industrial expansion and increasing mechanization.


