
AI and cloud leasing reshape rented server capacity
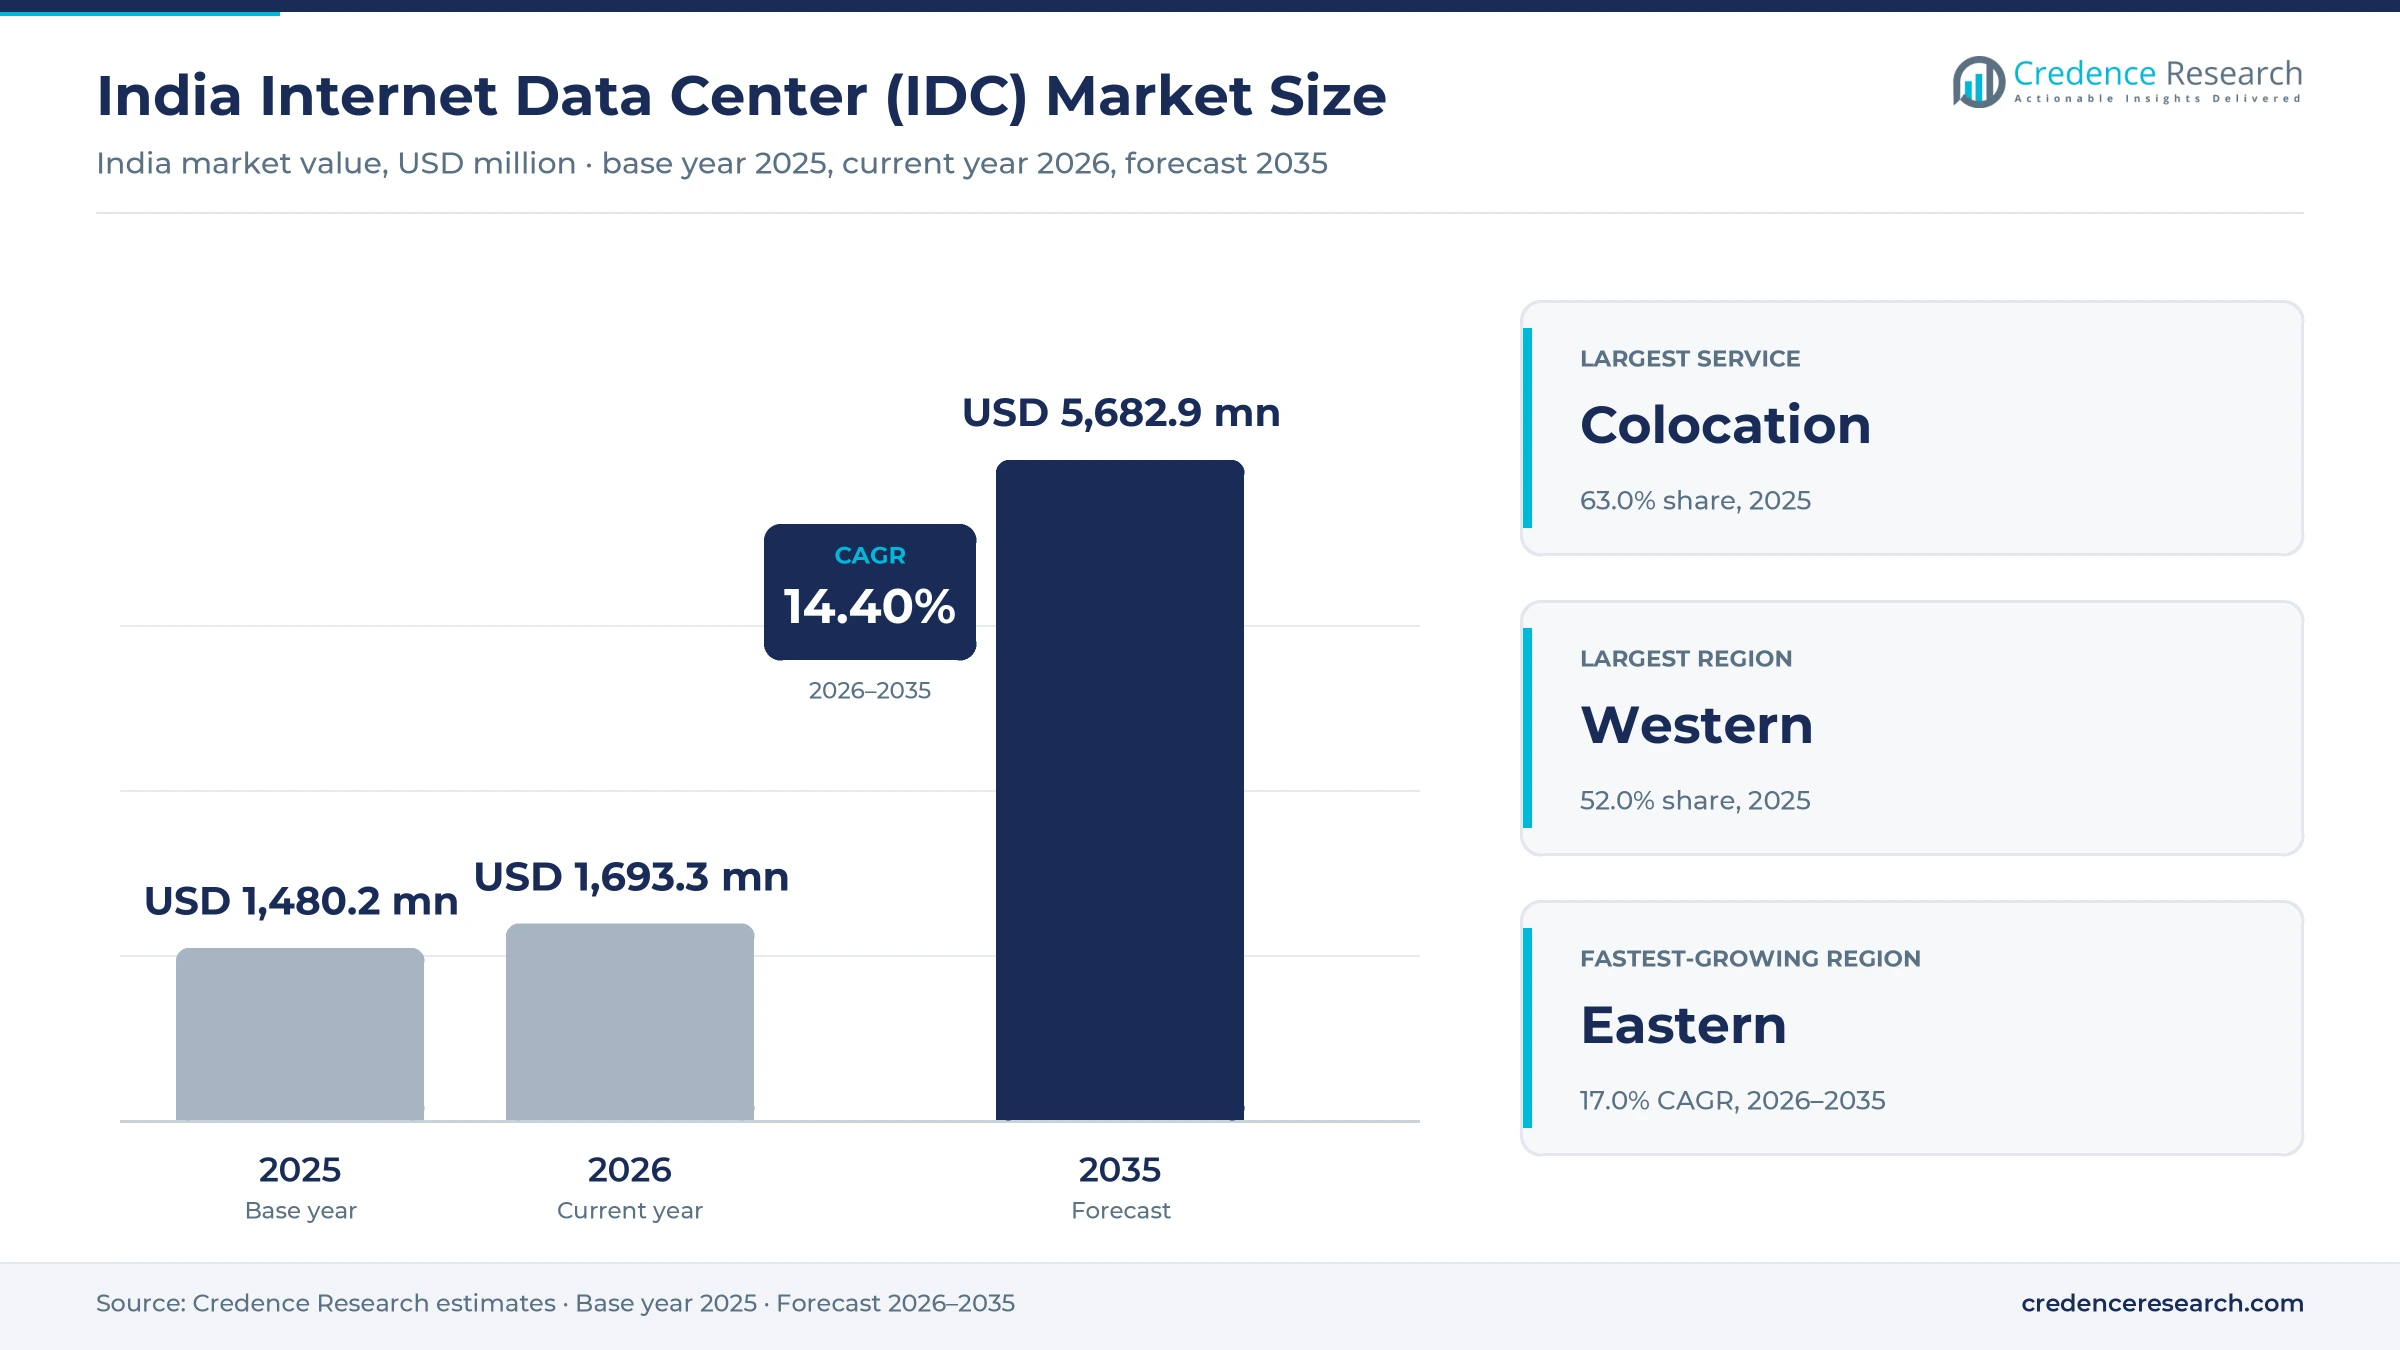
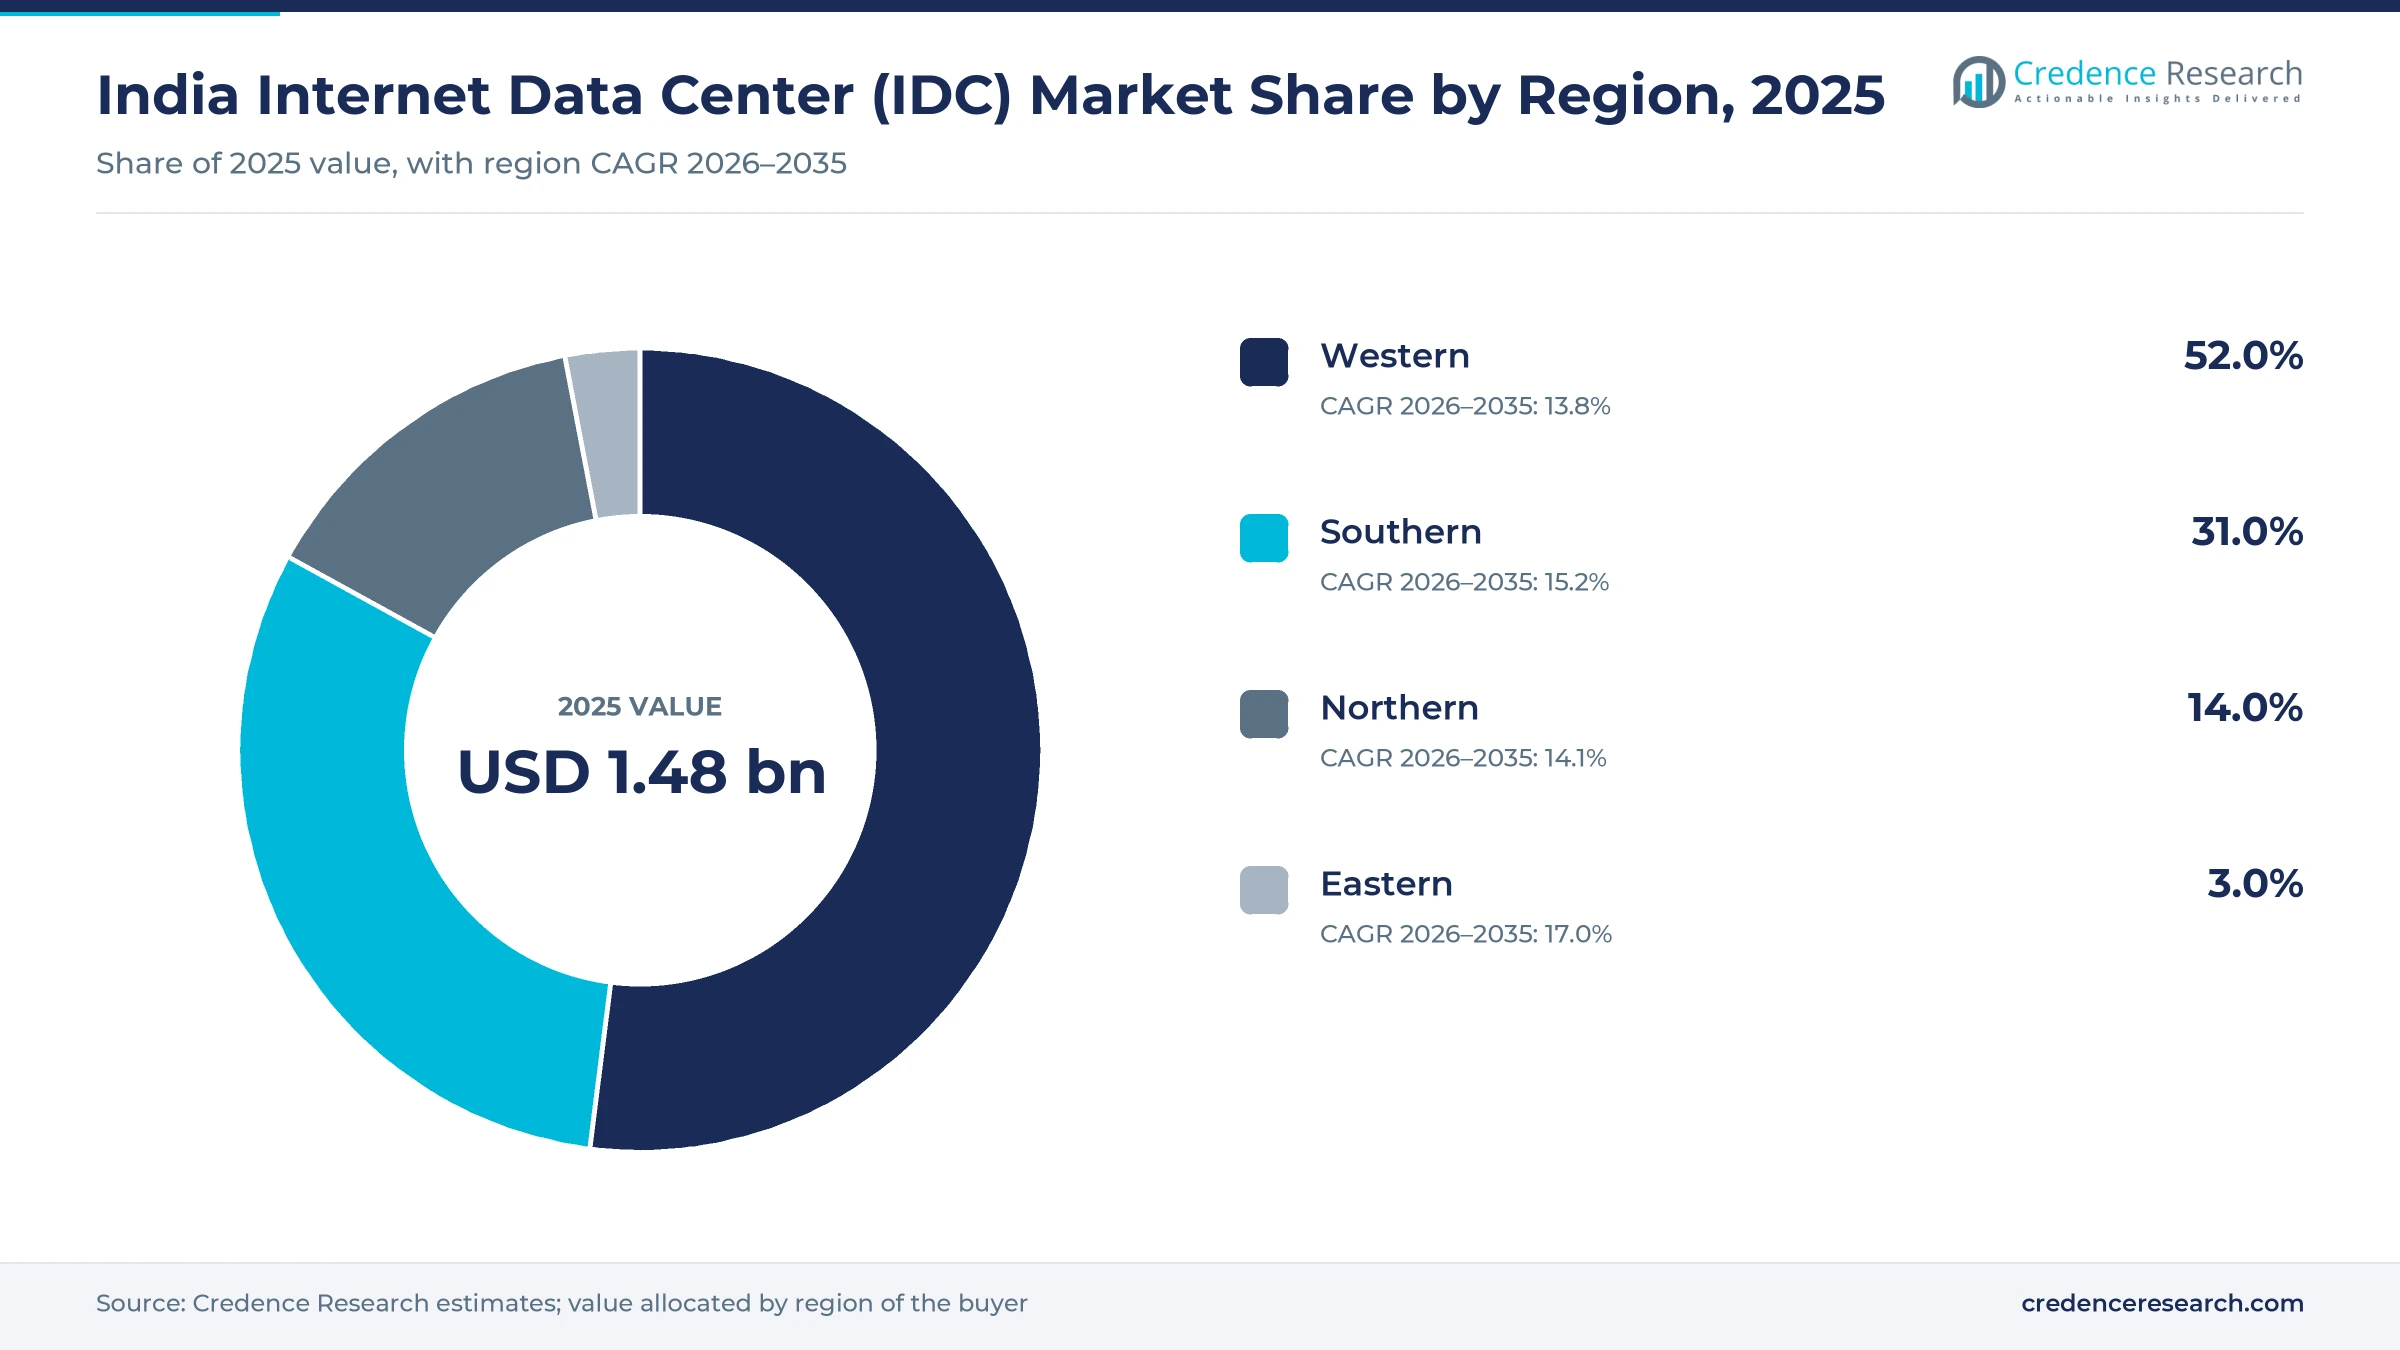
The India internet data center (IDC) market was valued at USD 1.48 billion in 2025 and is projected to increase from USD 1.69 billion in 2026 to USD 5.68 billion by 2035, registering a CAGR of 14.40% during 2026–2035. Demand comes from cloud and AI platforms that lease wholesale halls, from banks and payment firms that keep regulated data in the country, and from telecom operators, streaming services and online retailers that rent racks and content delivery capacity. The Western zone held the largest share, 52.0% in 2025, because Mumbai held about 47% of the country's live IT capacity at the end of that year. The Eastern zone is the fastest-growing at 17.0% a year, from a small base around Kolkata and Bhubaneswar. The main commercial change is the tax holiday to 2047 announced in the Union Budget 2026-27 for foreign cloud companies that serve global users from Indian facilities, which gives hyperscalers a new reason to place export workloads in the country.
What does an internet data center sell to Indian buyers?
An internet data center (IDC) is a third-party facility that rents secure space, power, cooling and network connectivity to companies that run servers, storage and network equipment. The report counts revenue that operators in India earn from colocation, managed and dedicated hosting, content delivery network capacity and other services such as disaster recovery, interconnection and managed security. Buyers sign retail contracts for racks and cages, or wholesale leases for whole halls and buildings that run for many years.
Electricity that operators re-bill to tenants at cost is excluded, as are captive enterprise server rooms, construction spending and the servers that tenants install. The value chain runs from land, grid connections and fiber to developers that build the shell and electrical plant, then to operators that lease capacity to cloud providers, which in turn resell compute and storage to Indian enterprises.
India Internet Data Center (IDC) Market Insights
- The market reached USD 1.48 billion in 2025 and is projected to reach USD 5.68 billion by 2035 at a 14.40% CAGR as AI and cloud tenants lease new halls.
- The Western zone held 52.0% of 2025 value, while the Eastern zone grows fastest at 17.0% a year from 23.1 MW of live capacity in Kolkata.
- Colocation led services with 63.0% of 2025 value, while hosting grows fastest at 15.3% a year as GPU cloud services scale up.
- AI workloads accounted for 78% of colocation leasing in India in 2025, up from 23% in 2024, according to Knight Frank.
- The Union Budget of Feb. 1, 2026, offered foreign cloud companies a tax holiday to 2047 when they serve global users from MeitY-notified Indian data centers.
Colocation leads while GPU hosting grows fastest
Why does colocation lead while hosting grows faster?
Based on services, the market is categorized into colocation, hosting, CDN and others. Colocation led with 63.0% of 2025 value because cloud providers and large enterprises rent power and space rather than build their own halls, and average utilization of India's co-location capacity stayed above 90% during FY22 to FY25, according to CareEdge Ratings. Hosting grows fastest at 15.3% a year, as GPU cloud services move into rented halls, and Yotta said on Feb. 18, 2026, that it planned to deploy 20,736 liquid-cooled Nvidia Blackwell Ultra GPUs at its Greater Noida campus by August 2026, a target whose completion the company had not confirmed publicly by November 2026.
Why do public cloud deployments lead and private ones gain?
Based on deployment, the market is categorized into public, private and hybrid deployments. Public deployments led with 47.0% of 2025 value because shared cloud platforms are the largest tenants, and public cloud providers have signed more than half of all colocation lease agreements in Delhi NCR to date, according to Knight Frank. Private deployments grow fastest at 14.9% a year, as single tenants now reserve dedicated AI capacity, and Reliance Industries and Meta agreed in June 2026 that Reliance would build a 168 MW AI data center in Jamnagar for Meta to lease within two years.
Why do cloud service providers dominate tenant demand?
Based on end user, the market is categorized into cloud service providers, telecom, government and public sector, BFSI, media and entertainment, e-commerce and retail, and others. Cloud Service Providers led with 41.0% of 2025 value because hyperscale platforms take whole buildings, and Amazon Web Services held 46% of live IT capacity in Hyderabad in 2025, according to Knight Frank. Cloud Service Providers also grow fastest at 15.1% a year, as Microsoft committed USD 17.5 billion over four years to India on Dec. 9, 2025, including an India South Central cloud region in Hyderabad that went live on Aug. 6, 2026, according to Microsoft.
| Segment Group | Leading Sub-segment | Share, 2025 | Fastest-growing Sub-segment | CAGR, 2026–2035 |
|---|---|---|---|---|
| By Services | Colocation | 63.0% | Hosting | 15.3% |
| By Deployment | Public | 47.0% | Private | 14.9% |
| By End User | Cloud Service Providers | 41.0% | Cloud Service Providers | 15.1% |
Rack, power and wholesale rates set operator margins
Retail colocation is priced per rack unit or per rack each month, with power billed separately per kilowatt, while wholesale tenants commit to a block of IT load and pay a rate per kilowatt over a long term. Power is the largest cost line, at 40% to 50% of operating expenses according to Anarock, so contracts pass tariff changes through to tenants. Anarock's benchmarks also put retail revenue per megawatt well above wholesale revenue, which is why operators protect interconnected retail floors in Mumbai and Delhi NCR. New supply in Hyderabad and Pune, where vacancy rose in 2025, limits how far wholesale rents can rise in those cities.
| Offer or segment | Typical price or fee | Basis |
|---|---|---|
| Full 42U rack, retail colocation | INR 28,000–45,000 per month | Cyfuture Cloud list, 2024 indicative pricing |
| Single server space, per rack unit | INR 1,500–2,500 per U per month | Cyfuture Cloud typical range |
| Metered power for retail racks | INR 12,000–18,000 per kW per month | Cyfuture Cloud list |
| 42U rack with 3 kVA power, Andhra Pradesh site | INR 36,000 per month | Directory listing (WHTop), DesiVPS India 42U Colocation plan |
| Construction cost, Mumbai | USD 6.64 per watt | Turner & Townsend cost index cited by IBEF, November 2025 |
Request a Free Sample
Fill in your details and we'll send you a free sample report.
- Sample data tables & charts
- Research methodology
AI leasing, cloud capital and tax rules lift demand
AI tenants take most new colocation leasing
AI training and inference clusters now account for most new colocation demand in India, because GPU racks need dense power that only purpose-built halls can supply. AI-related deals made up 78% of colocation leasing in 2025, up from 23% in 2024, and operators signed 447 MW of colocation leases during the year, according to Knight Frank. Savills counted 427 MW of absorption in 2025 against 387 MW of new supply, and Knight Frank put vacancy below 10% of live colocation capacity in the core hubs. Mumbai alone recorded 229 MW of take-up in the fourth quarter of 2025. Operators with powered land ready in Mumbai and Chennai capture these leases first, while late entrants wait for grid connections.
Hyperscaler commitments lock in multiyear demand
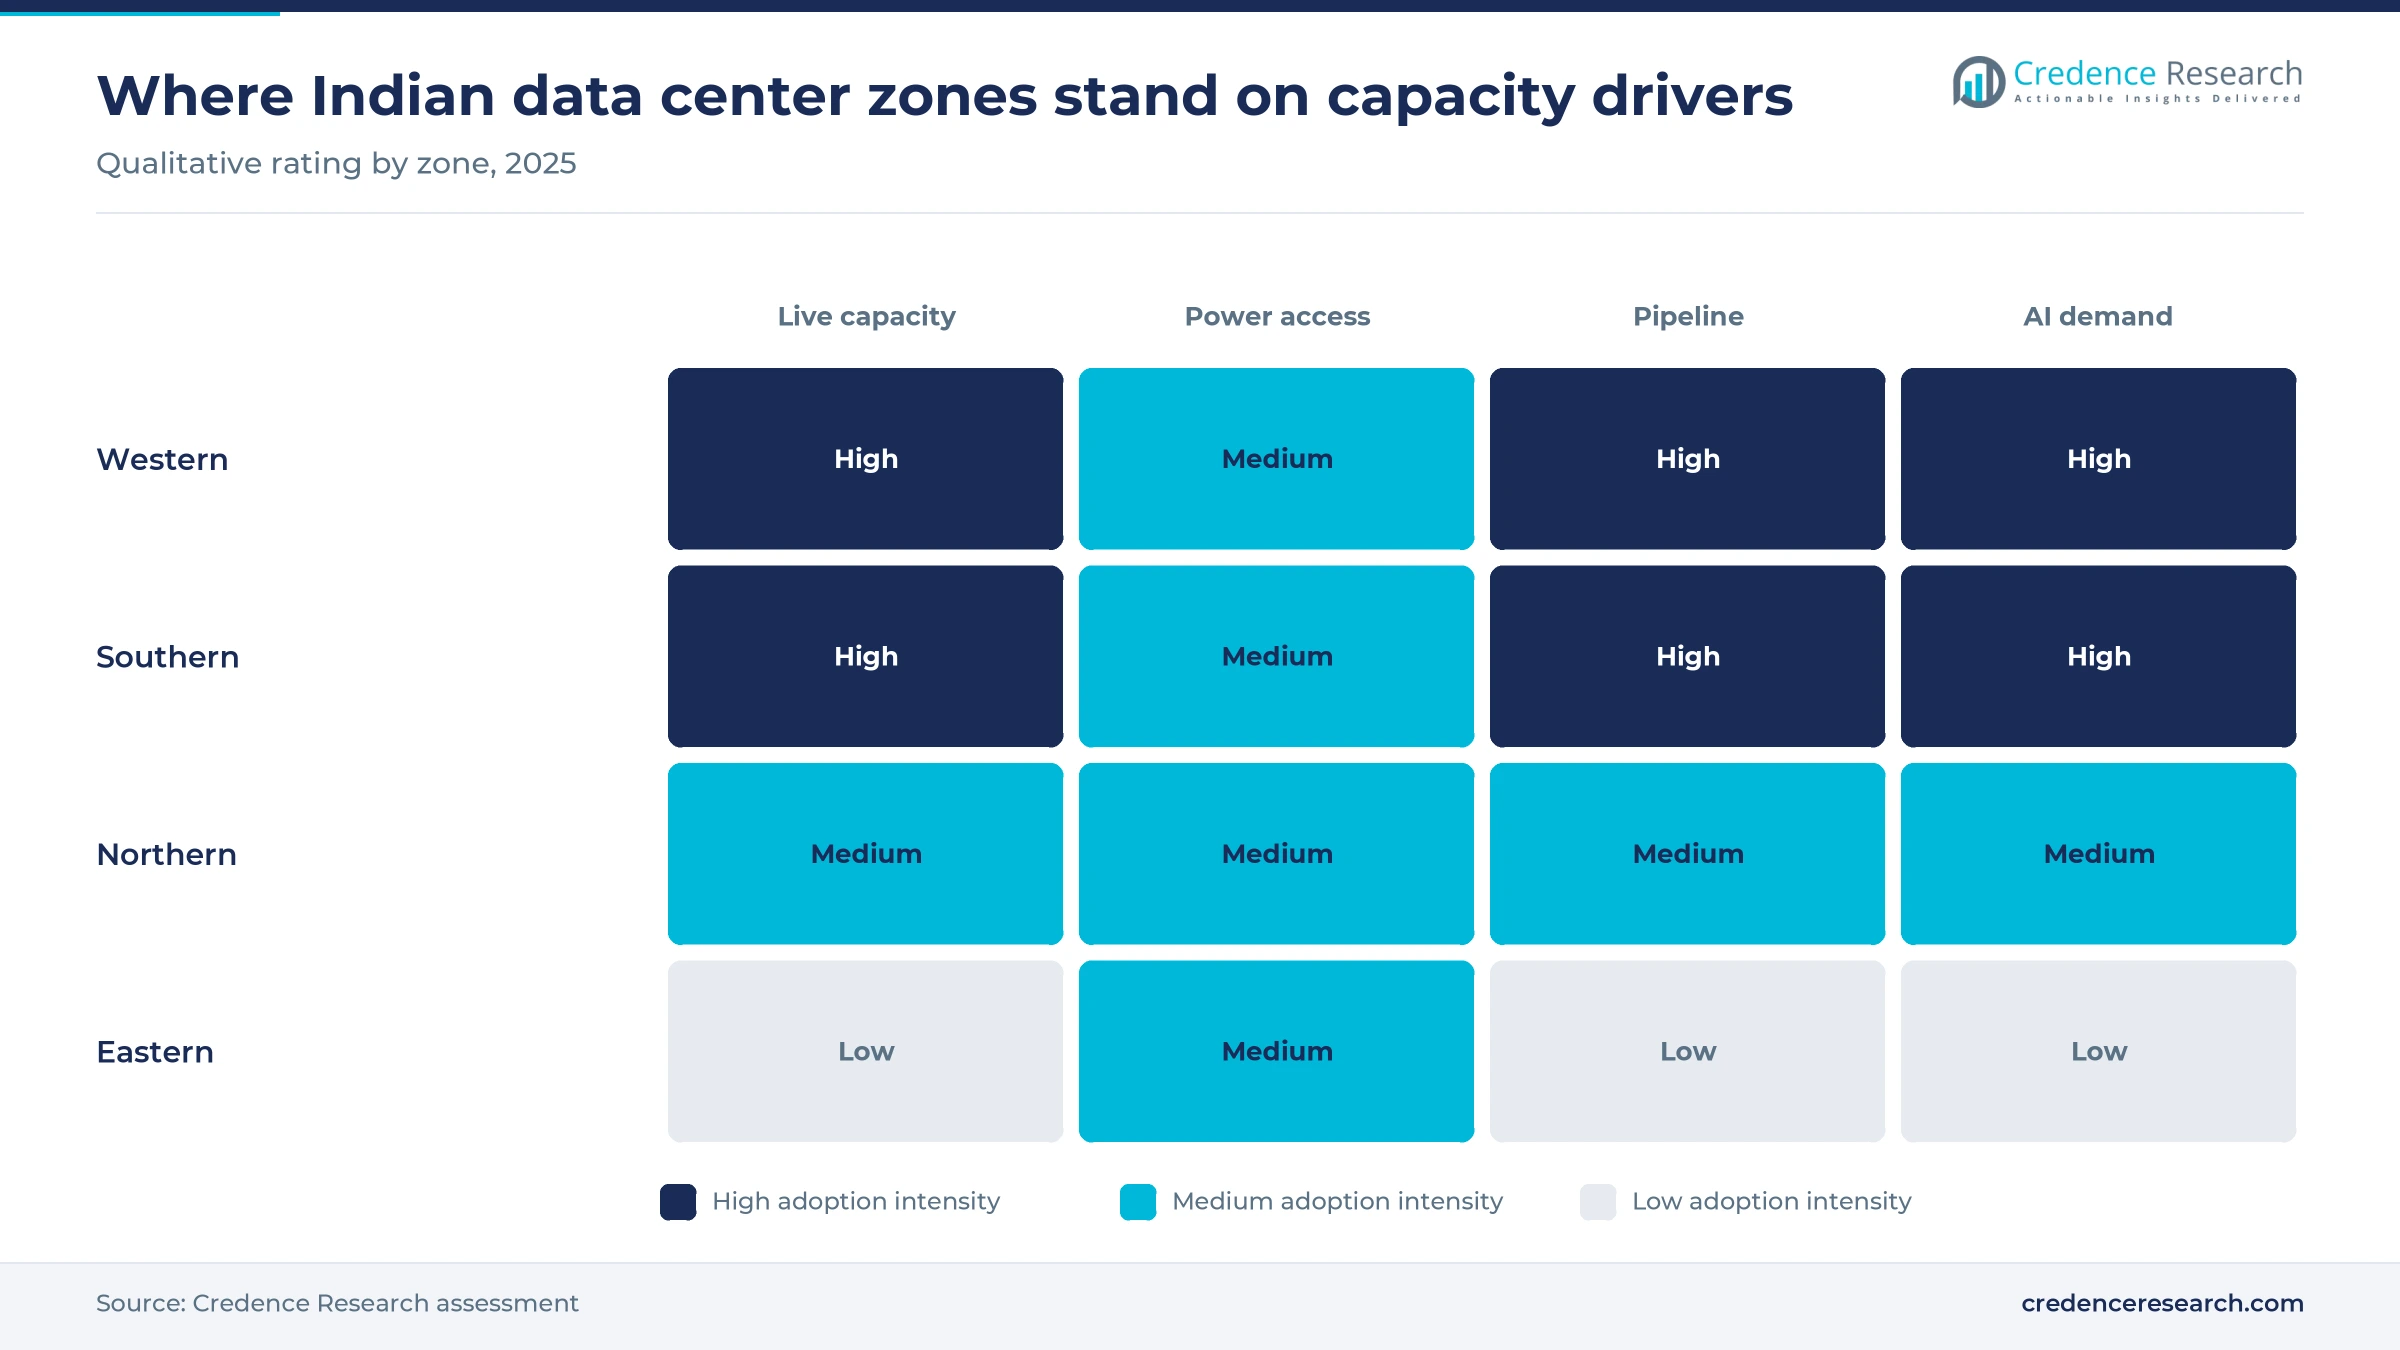
Global cloud providers have committed capital on a scale that secures demand for Indian halls well beyond 2026, because each new cloud region needs several availability zones that are often leased from local operators. Amazon said on Dec. 10, 2025, that it will invest more than USD 35 billion across its Indian businesses through 2030, on top of nearly USD 40 billion invested so far. Google announced on Oct. 14, 2025, a USD 15 billion AI hub in Visakhapatnam for 2026 to 2030 with AdaniConneX and Airtel. CBRE estimated that data center investment commitments in India reached USD 56.4 billion in 2025, taking the cumulative total to USD 126 billion. Developers that sign anchor tenants before construction lower their financing costs, while operators without a hyperscale customer compete for smaller enterprise deals.
Tax holiday and privacy rules favor local hosting
Tax and privacy rules now reward cloud providers that run workloads from Indian facilities, which converts policy into leasing demand. The Union Budget presented on Feb. 1, 2026, exempts foreign cloud companies from Indian tax on global income earned through MeitY-notified Indian data centers from April 1, 2026, through the 2046-47 tax year, Business Today reported. The data center operator and the reseller that bills Indian customers must both be Indian companies, and a 15% safe harbor margin applies to related-party captive centers. The Digital Personal Data Protection Rules, notified on Nov. 13, 2025, bring most data fiduciary obligations into force on May 13, 2027. Indian operators that win MeitY notification gain an edge over offshore hosts that serve Indian users.
Connected users and payments raise hosting load
India's online population keeps expanding the traffic that streaming, payment and commerce platforms must serve from nearby servers, which supports hosting and content delivery capacity. India had 1,092.79 million internet subscribers at the end of March 2026, including 440.87 million in rural areas, according to the Telecom Regulatory Authority of India. The country has almost 450 million 5G connections, the GSMA said on Oct. 7, 2026. UPI processed a record 25.47 billion transactions in October 2026, according to National Payments Corporation of India data. Payment and streaming platforms need low-latency capacity in several cities, which favors operators that run both metro campuses and edge sites.
Liquid cooling, new equity and tier-2 edge sites
Operators shift to liquid-cooled, high-density halls
Operators are shifting toward liquid-cooled halls to address rack densities that air cooling cannot handle, creating openings for chilled-water plants, coolant distribution units and redesigned electrical rooms. Direct liquid cooling lets AI halls reach a power usage effectiveness of 1.1 to 1.2, according to Anarock, while room-level air cooling adds 0.35 to 0.55 to the ratio. The Bureau of Indian Standards codified the ISO/IEC 30134 cooling efficiency, water usage and carbon usage metrics as Indian standards in February 2026, although they remain voluntary. The Yotta GPU cluster noted in the segment section relies on liquid-cooled systems. Suppliers of liquid cooling equipment gain orders, while older air-cooled halls risk lower rents.
Global funds back domestic operators with fresh equity
Indian operators are shifting from parent-funded growth toward large equity rounds from global investors to finance gigawatt pipelines. Bharti Airtel said on March 30, 2026, that Nxtra will receive USD 1 billion led by Alpha Wave Global and Carlyle, subject to regulatory approvals, to lift capacity from about 300 MW toward 1 GW. CPP Investments agreed on June 17, 2026, to invest up to INR 7,000 crore in CtrlS Datacenters, including up to INR 3,000 crore for a hyperscale joint venture. Tata Consultancy Services finalized agreements in November 2025 for TPG to invest up to INR 18,000 crore in HyperVault, its AI data center unit planned at more than 1 GW. New equity lets these operators build ahead of signed leases, but it raises the returns their rents must deliver.
Edge sites in tier-2 cities open a new client base
Tier-2 cities remain an underserved market for small colocation and edge sites that serve regional banks, hospitals, streaming caches and state government systems. CtrlS already runs edge facilities in Patna and Lucknow and is developing sites in GIFT City in Ahmedabad, Bhubaneswar and Guwahati, according to its June 2026 investment announcement. Nxtra operates 14 large core data centers and more than 120 edge facilities, Bharti Airtel says. CBRE named Ahmedabad, Visakhapatnam, Patna and Bhopal in April 2026 as tier-2 cities drawing more developer interest. Operators that package micro facilities with network links can win clients that need local latency but cannot fill a metro hall.
Gigawatt AI campuses open supply contracts beyond the metros
Gigawatt-scale AI campuses in Andhra Pradesh and Gujarat open a supply gap in power, cooling, fiber and interconnection that metro operators never had to fill. The Andhra Pradesh government approved AM AI Factory's 512 MW green AI data center in Visakhapatnam district, with an investment of more than INR 31,387 crore, in August 2026, Indian Infrastructure reported. Reliance plans a 1 GW campus in Jamnagar, with the first 120 MW expected in the second half of 2026, according to Knight Frank. The Google and AdaniConneX partnership in Visakhapatnam includes co-investment in transmission lines, clean energy and a subsea cable network. Builders of hyperscale campuses and grid contractors stand to win the largest orders.
Grid delays, costs, vacancy and water strain supply
Grid and transmission delays slow new capacity
Power delivery is the main bottleneck, because new halls cannot open until substations and transmission lines reach the site. Transmission additions in FY26 reached only about 33% of target, and substation and evacuation capacity is inadequate for expected growth, according to CareEdge Ratings. The Central Electricity Authority plans to direct states to include data center demand in their resource adequacy plans. Developers in Mumbai and Chennai with land but no confirmed grid connection are most exposed, and they must spend more on backup generation and uninterruptible power systems while they wait.
Higher build costs and debt strain smaller developers
Construction and financing costs are rising faster than rents, which squeezes developers that build without anchor tenants. CareEdge Ratings found that data center costs rose 50% to 70% over recent years and that commissioning timelines have lengthened. The same review found that developers fund 70% to 80% of projects with debt and carry interest cover of only two to three times. Smaller domestic developers without a parent balance sheet are most exposed if leasing slows or interest rates rise, because their debt service depends on new leases.
Vacancy rises in Hyderabad and Pune
Speculative supply has run ahead of leasing in some secondary hubs, which weakens rent growth there. Hyderabad vacancy averaged about 23% in 2025, Pune rose to about 18% in late 2025, according to Knight Frank, against about 6.7% in Mumbai. Operators that built large phases in these cities without pre-leasing face longer lease-up periods and pressure to discount, while tenants gain bargaining power on price and contract terms.
Water scarcity limits cooling options in dry cities
Cooling towers consume large volumes of water, which collides with shortages in several of India's main data center cities. Anarock estimates that cooling towers use about 25.5 million liters of water per MW of IT load each year. CareEdge Ratings also lists water scarcity in major cities among the sector's main risks. Operators in Chennai, Bengaluru and Hyderabad are likely to be the most exposed in dry seasons, and the voluntary BIS water usage metric gives tenants a new way to compare sites.
Mumbai leads while Eastern and Southern zones grow faster
| Region | Value, 2025 (USD billion) | Share, 2025 | CAGR, 2026–2035 |
|---|---|---|---|
| Western | 0.77 | 52.0% | 13.8% |
| Southern | 0.46 | 31.0% | 15.2% |
| Northern | 0.21 | 14.0% | 14.1% |
| Eastern | 0.04 | 3.0% | 17.0% |
Mumbai anchors the Western zone with half of live capacity
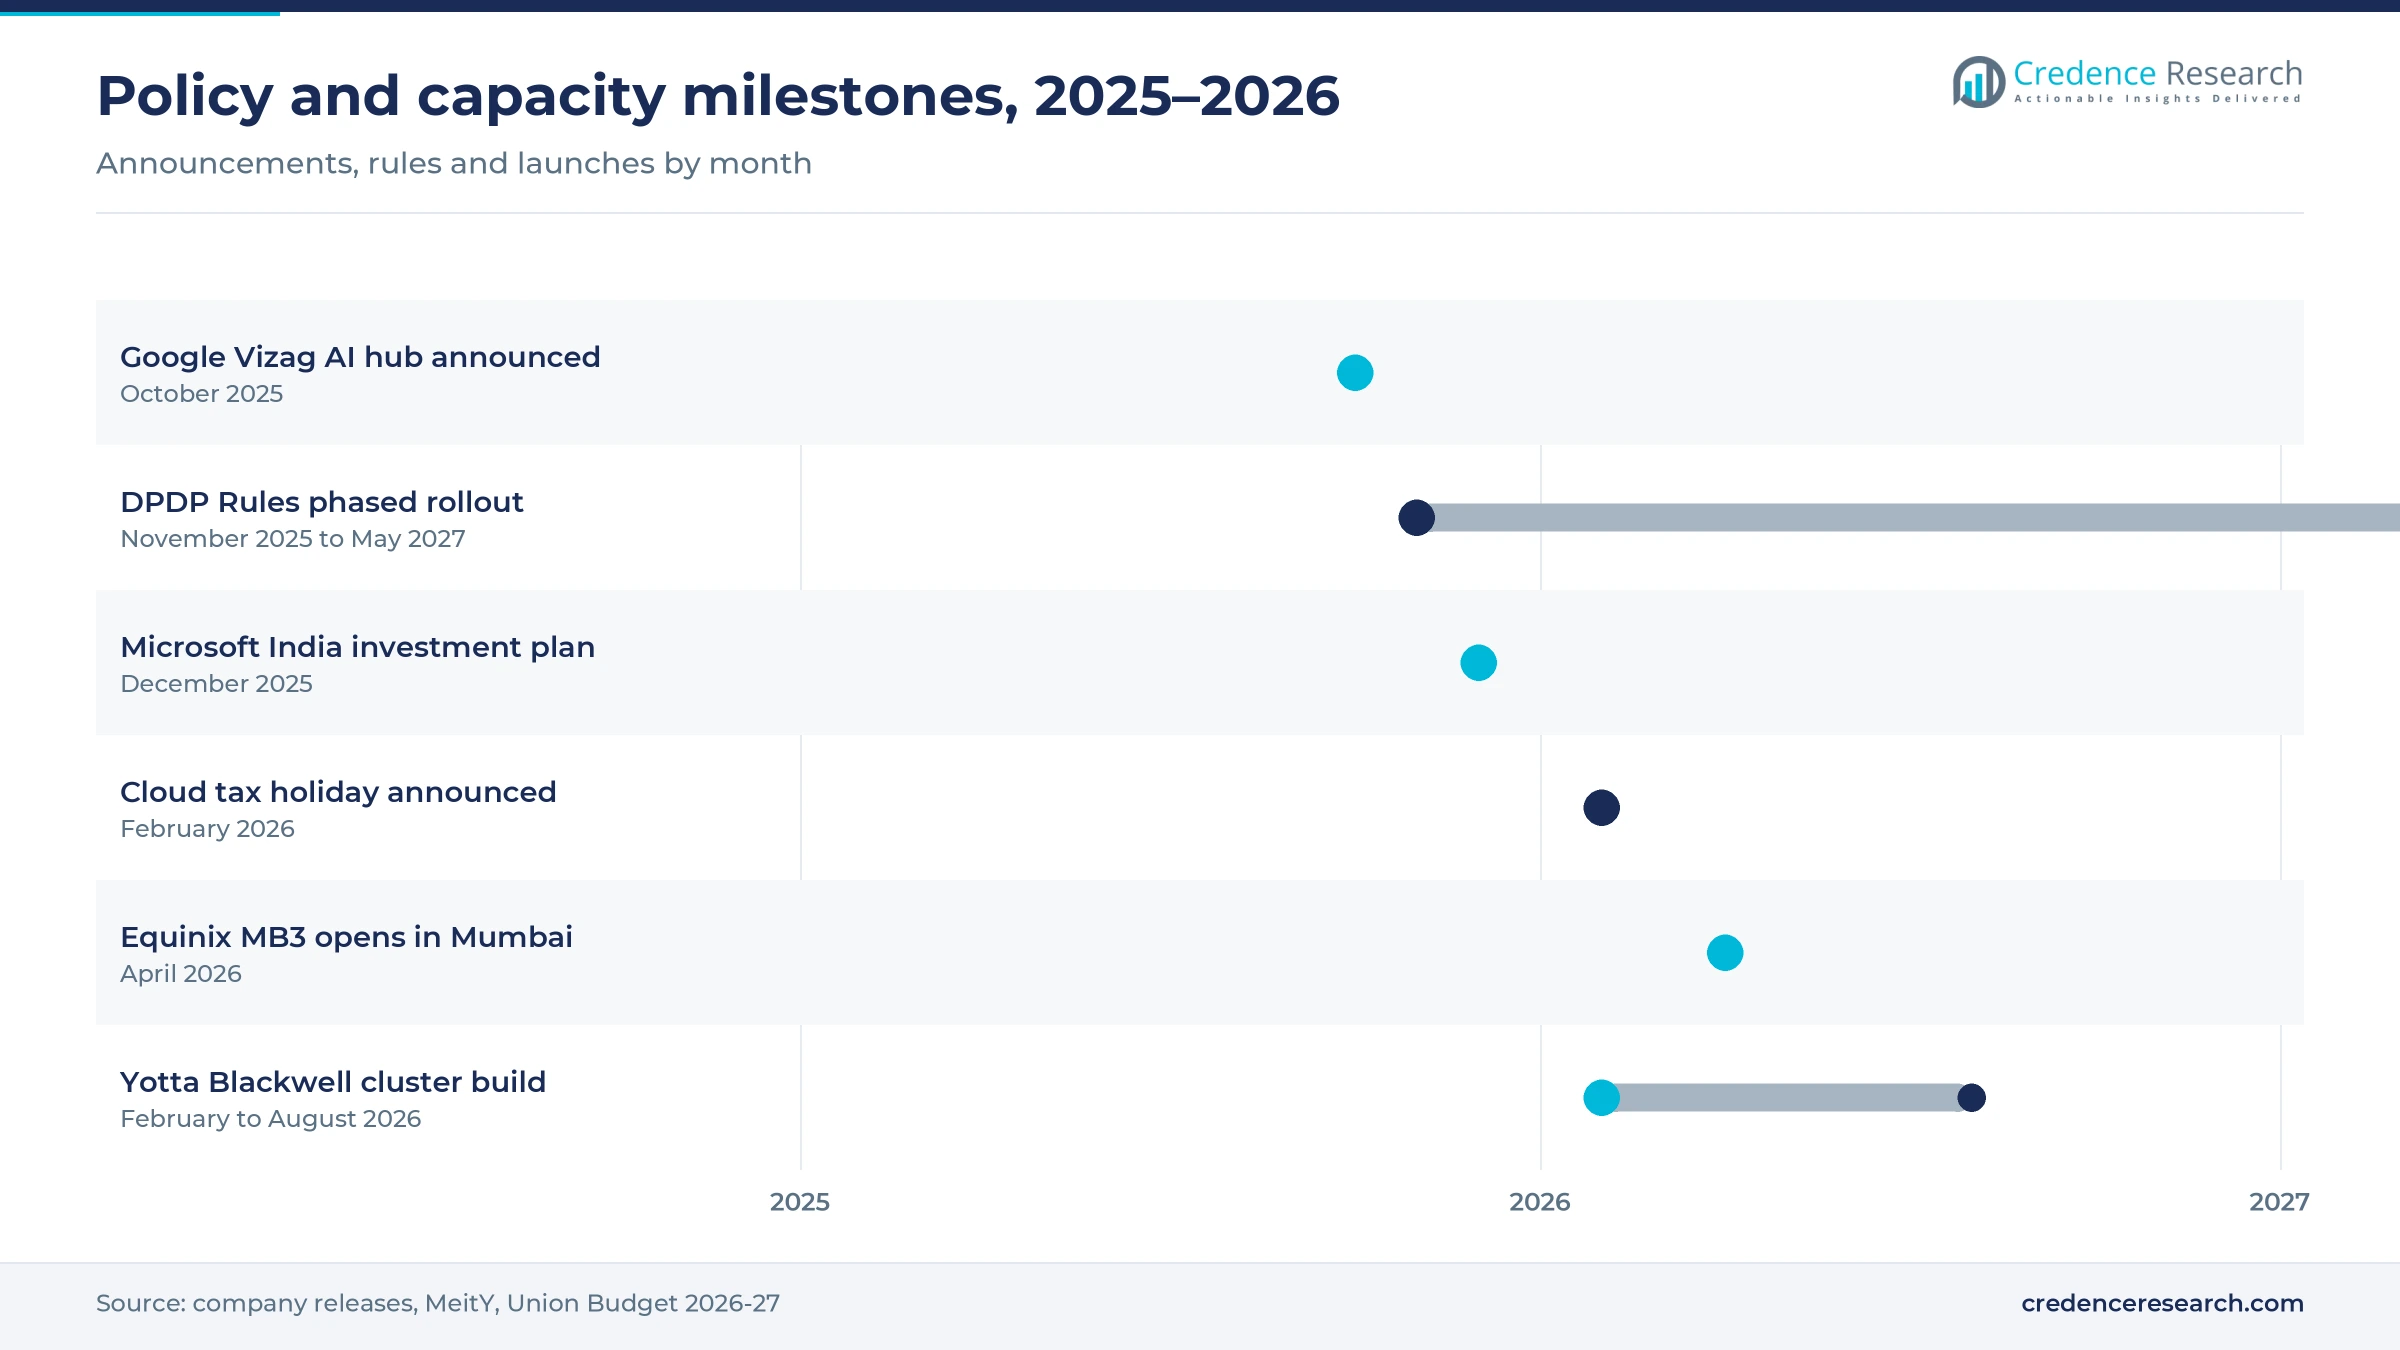
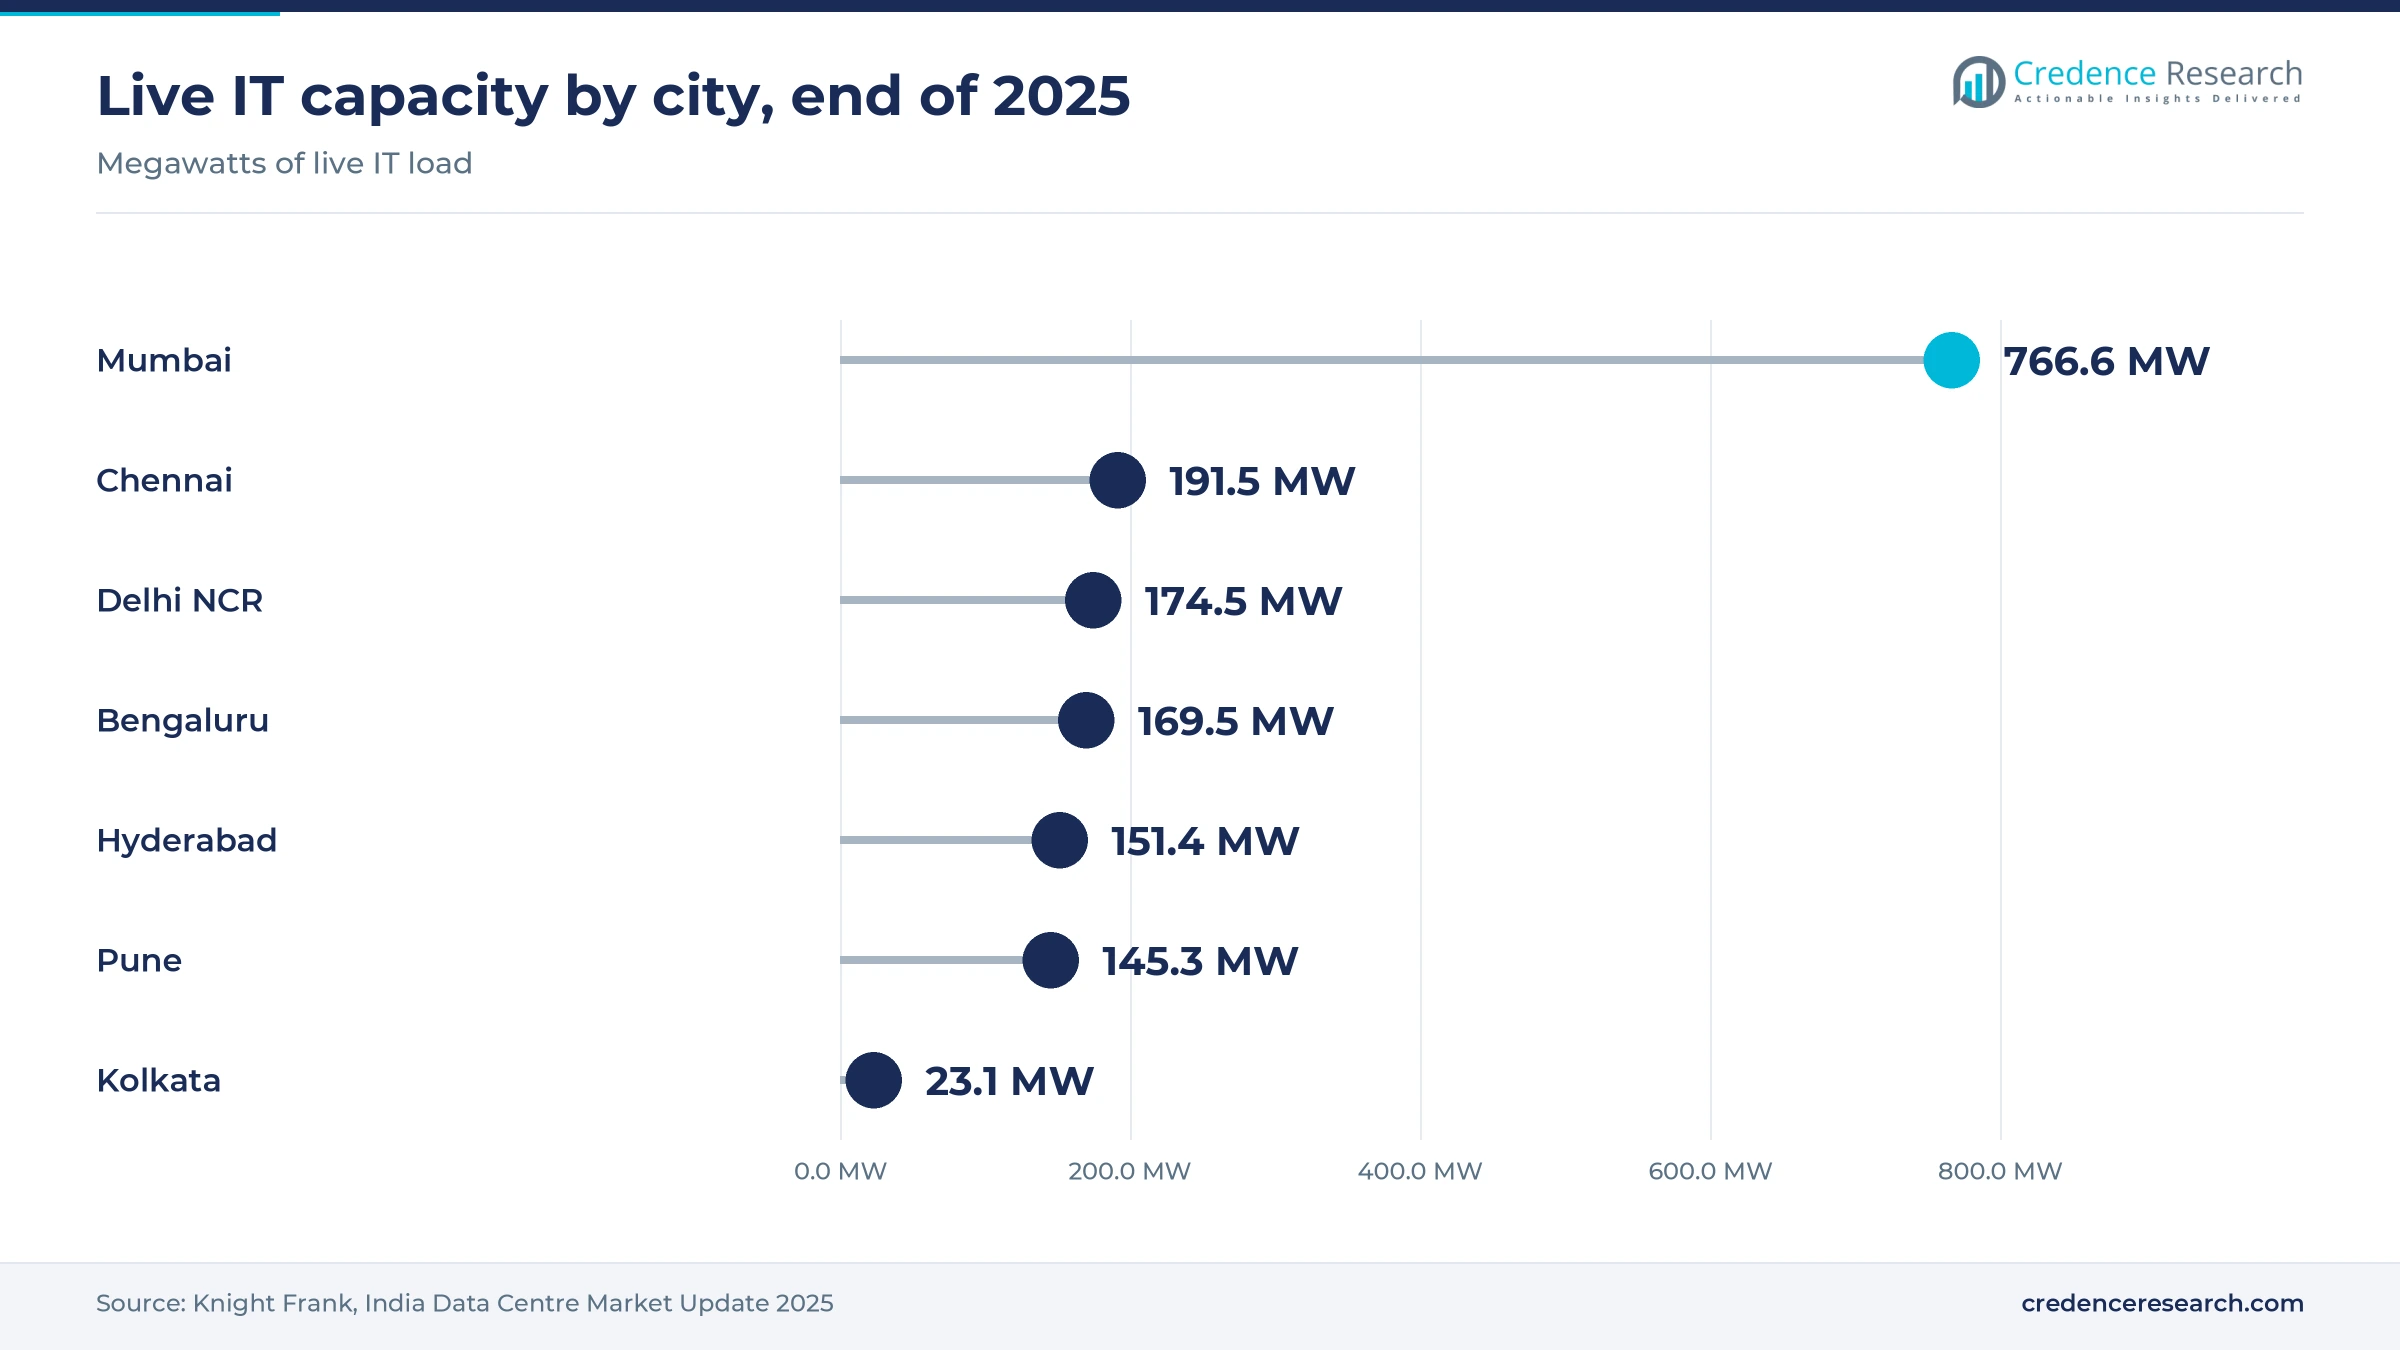
The Western zone held 52.0% of 2025 value and grows at 13.8% a year, the largest share of India internet data center demand. Mumbai had 766.6 MW of live IT capacity at the end of 2025, and Pune added 145.3 MW, with STT GDC holding about 65% of Pune's capacity, according to Knight Frank. Mumbai's committed pipeline of 1,543.3 MW keeps the zone ahead to 2035, but its growth rate trails the national pace because its base is already so large. Gujarat adds a second cluster through the Jamnagar AI campus described above.
Chennai, Hyderabad and Visakhapatnam lift the South
The Southern zone held 31.0% of 2025 value and grows at 15.2% a year, faster than the national rate. Chennai had 191.5 MW of live capacity, Bengaluru 169.5 MW and Hyderabad 151.4 MW at the end of 2025, the same capacity data show, and NTT Global Data Centers holds about 28% of Bengaluru's capacity. Mumbai and Chennai together took most of the 2025 absorption, Savills reported. Savills also expects Hyderabad capacity to grow 44% a year to 2030. The Visakhapatnam AI hub adds a new coastal cluster with its own subsea cable plans.
Delhi NCR serves public cloud and government demand
The Northern zone held 14.0% of 2025 value and grows at 14.1% a year, close to the national rate of demand growth. Delhi NCR had 174.5 MW of live capacity at the end of 2025, 55% more than in 2022, and vacancy has held at 12% to 15%. Demand comes from public cloud regions, central government systems and corporate headquarters, while Greater Noida hosts Yotta's 60 MW D2 building, which can scale to 250 MW. CBRE also named Uttar Pradesh in April 2026 among the five states expected to lead data center investment.
Kolkata and Bhubaneswar give the Eastern zone the fastest growth
The Eastern zone held 3.0% of 2025 value and grows fastest at 17.0% a year, from a small base of enterprise and government demand. Kolkata had 23.1 MW of live capacity at the end of 2025, with 13 MW under construction and 133.4 MW committed or at an early stage, and its top four operators hold nearly 90% of live capacity. Savills expects Kolkata capacity to grow 48% a year to 2030. The CtrlS edge sites planned for Bhubaneswar and Guwahati extend coverage to Odisha and the Northeast.
A Mumbai opening, a Visakhapatnam start and a delayed IPO
| Development | Status and market relevance |
|---|---|
| In April 2026, Equinix opened MB3, its fourth Mumbai data center, in Chandivali, Powai, with an initial investment of more than USD 95 million and more than 1,370 cabinets at launch. | Completed launch; the site can grow to more than 5,475 cabinets and adds retail interconnection space in Mumbai. |
| In April 2026, Google broke ground on its USD 15 billion AI hub in Visakhapatnam, developed with AdaniConneX and Nxtra by Airtel. | Construction started; the gigawatt-scale campus moves a large block of AI capacity to Andhra Pradesh. |
| In June 2026, Reliance Industries and Meta agreed that Reliance will build and manage a 168 MW AI data center in Jamnagar, Gujarat, for Meta to lease. | Announced partnership; delivery is planned within two years, adding a large single-tenant lease outside the metros. |
| In September 2026, Sify Infinit Spaces put its planned INR 3,700 crore initial public offering on hold after investors offered a lower valuation than it sought. | Listing deferred; the delay postpones fresh equity for the operator's AI-ready capacity plans. |
Cooling, interconnection and edge designs set revenue
- Direct-to-chip liquid cooling carries heat away from GPU packages through cold plates, which lets one rack draw several times the power of an air-cooled rack.
- Carrier-neutral interconnection lets tenants cross-connect to many telecom carriers, cloud on-ramps and internet exchanges inside one building, which cuts latency and transit costs.
- Subsea cable landing stations link coastal campuses in Mumbai, Chennai and Visakhapatnam to international routes, which matters for cloud regions that serve foreign users.
- Edge micro facilities place small rooms of racks near users in tier-2 cities to cache streaming content and run payment and factory systems with low latency.
- Water and carbon metrics such as water usage effectiveness and carbon usage effectiveness let buyers compare sites on more than power usage effectiveness alone.
Need a Custom Version of This Report?
Tailor the scope, geography, or segments to your exact requirements.
- Custom geography or segment scope
- Direct access to our analyst team
Telecom-backed, independent and global operators compete
Competition splits between domestic platforms backed by telecom or industrial groups and global operators that bring hyperscale clients with them. Nxtra by Airtel, AdaniConneX and Reliance draw on parent networks, land banks and power assets, while CtrlS, Sify Infinit Spaces and Yotta compete as independent Indian operators with growing AI offers. STT GDC India, NTT Global Data Centers and Equinix bring international customer relationships, standard designs and interconnection ecosystems. Wholesale contracts are won on powered land, delivery speed and the ability to fund campuses ahead of leases, while retail contracts depend on carrier density, cross-connects and managed services. Tata Communications and the Web Werks business of Iron Mountain serve enterprises that buy hosting, network and colocation together. Price pressure is strongest in Hyderabad and Pune, where new supply exceeds near-term leasing, and weakest in the interconnected retail halls of Mumbai.
How concentrated is supply, and where do margins sit?
Supply is concentrated among a small group of operators, and third-party colocation providers own about 72% of India's IT capacity against 28% that hyperscalers built for themselves, according to Anarock. The largest domestic operators profiled below each run a few hundred megawatts, the scale needed to bid for hyperscale tenders. Entry barriers are high, because powered land in core hubs is scarce and Mumbai construction costs about USD 6.64 per watt, or about USD 6.6 million per megawatt, second-lowest of 52 markets in a 2025 cost index. Margins sit in retail racks and interconnection, while wholesale leases trade lower rents for long, predictable contracts.
Companies profiled and their roles in this market
| Company | Type | Role in the market |
|---|---|---|
| Nxtra by Airtel (Bharti Airtel) | Telecom-backed operator | Runs 14 core data centers and 120+ edge sites with about 300 MW |
| CtrlS Datacenters | Independent operator | Hyperscale and AI-ready campuses plus edge sites in Patna and Lucknow |
| STT GDC India | Global operator | Colocation campuses in Mumbai, Pune, Kolkata and other metros |
| Sify Infinit Spaces (Sify Technologies) | Independent operator | Runs 14 colocation data centers with 188.04 MW installed IT capacity |
| AdaniConneX (Adani Enterprises) | Industrial-group developer | Builds hyperscale campuses, including the Google AI hub in Visakhapatnam |
| Yotta Data Services | AI cloud and colocation operator | Greater Noida and Navi Mumbai campuses with GPU cloud services |
| NTT Global Data Centers (NTT DATA) | Global operator | Holds about 28% of live capacity in Bengaluru, plus Mumbai sites |
| Equinix | Global interconnection operator | Retail colocation and interconnection in Mumbai and Chennai |
| Reliance Industries (Jio Platforms) | Industrial-group developer | Building Jamnagar AI campus, including a 168 MW facility for Meta |
| Tata Communications | Network and hosting provider | Managed hosting, cloud and content delivery services for Indian enterprises |
| Web Werks (Iron Mountain) | Colocation operator | Retail colocation and hosting for enterprises in Mumbai, Pune and other cities |
Revenue follows powered land and anchor tenants
Credence Research's view is that rented server revenue in India is moving from enterprise racks in Mumbai toward wholesale AI halls spread across Mumbai, Chennai, Hyderabad and new coastal campuses. The capacity pipeline is large enough to outrun leasing in some cities, so rent growth is likely to differ sharply by location. Operators with powered land, anchor hyperscale tenants and retail interconnection floors are best placed, while speculative builders in Hyderabad and Pune carry the most risk. Buyers can negotiate longer lock-ins where vacancy is high and should secure power-ready capacity early in Mumbai, where vacancy is lowest.
Capacity, utilization and price data anchor values
The report uses 2025 as the base year and forecasts revenue to 2035 in current U.S. dollars. Market values come from the Credence Research model, which updates the earlier 2024 estimate with live capacity, absorption and utilization data, industry revenue published by a credit rating agency, and listed rack and power prices, excluding electricity that operators re-bill at cost. Segment and zone shares are Credence Research estimates based on city-level capacity, tenant mix and pipeline projects. Sources include the Telecom Regulatory Authority of India, the Bureau of Indian Standards, company announcements, rating agency research and property consultancy data, and no interviews or surveys were conducted.
Grid delivery and AI demand shape growth to 2035
By 2035, the market is expected to reach USD 5.68 billion, with growth slowing after 2030 as the current wave of AI campuses fills and wholesale rents settle. Mumbai is likely to remain the largest hub, but Chennai, Hyderabad, Visakhapatnam and Jamnagar are expected to take a larger share of new leasing. Hosting and GPU cloud services should gain share from plain colocation as Indian enterprises rent AI compute rather than buy it. The main risk to this path is grid delivery, and the main upside is foreign cloud demand drawn by the 2047 tax holiday.
Grid delivery and AI leasing decide the range to 2035
The range of outcomes depends on whether grid connections keep pace with signed leases and whether AI demand holds after the first wave of GPU clusters. In the downside case, transmission delays push back handovers and vacancy in secondary hubs forces rent cuts. The base case assumes that hyperscale commitments convert into leases on the announced schedules. The upside case needs the 2047 tax holiday to draw export cloud workloads into notified Indian facilities, alongside faster state approvals for power and land.
| Scenario | CAGR, 2026–2035 | Value, 2035 | What has to hold |
|---|---|---|---|
| Downside | 11.4% | USD 4.47 billion | Grid and transmission delays slip handovers by a year or more and AI leasing slows after 2027 |
| Base | 14.40% | USD 5.68 billion | Hyperscale and AI commitments convert into leases broadly on the announced timelines |
| Upside | 16.9% | USD 6.90 billion | The tax holiday attracts export cloud workloads and gigawatt campuses lease faster than planned |
Frequently Asked Questions
How big is the India internet data center (IDC) market?
What does IDC mean in a data center context?
How much data center capacity does India have?
Which city leads India's data center capacity?
What does it cost to build a data center in India?
Who are the leading internet data center operators in India?
Which service segment leads the market?
What is the main constraint on growth?
Table of Content
Chapter 1 Market Segmentation
- 1.1 Segmentation Framework
- 1.1.1 Product and Service Classification
- 1.1.2 Application and End-Use Classification
- 1.1.3 Technology and Solution Classification
- 1.1.4 Customer and Distribution Channel Classification
- 1.1.5 Geographic Segmentation
- 1.1.6 Market Segment Definitions and Boundaries
- 1.2 By Services
- 1.2.1 Colocation
- 1.2.2 Hosting
- 1.2.3 CDN
- 1.2.4 Others
- 1.3 By Deployment
- 1.3.1 Public
- 1.3.2 Private
- 1.3.3 Hybrid
- 1.4 By End User
- 1.4.1 Cloud Service Providers
- 1.4.2 Telecom
- 1.4.3 Government/Public Sector
- 1.4.4 BFSI
- 1.4.5 Media & Entertainment
- 1.4.6 E-commerce & Retail
- 1.4.7 Others
Chapter 2 Introduction
- 2.1 Report Objectives and Scope
- 2.2 Product Definition and Industry Terminology
- 2.3 Market Inclusions and Exclusions
- 2.4 Research Process
- 2.4.1 Primary Research and Expert Interviews
- 2.4.2 Secondary Research and Source Review
- 2.4.3 Top-Down and Bottom-Up Estimation
- 2.4.4 Data Triangulation and Verification
- 2.5 Market Size Measurement Basis
- 2.5.1 2025: USD 1.48 billion → 2035: USD 5.68 billion
- 2.6 Historical and Forecast Reference Periods
- 2.6.1 Historical Period: 2018-2025
- 2.6.2 Base Year: 2025
- 2.6.3 Forecast Period: 2025-2035
- 2.7 Research Assumptions and Limitations
Chapter 3 Executive Summary
- 3.1 Market Snapshot and Key Findings
- 3.2 Base-Year Market Size, 2025
- 3.3 Forecast Market Size, 2035
- 3.4 Revenue and Volume Growth Outlook
- 3.5 Key Demand and Supply Indicators
- 3.6 Leading Market Segments
- 3.7 Fastest-Growing Market Opportunities
- 3.8 Regional Performance Highlights
- 3.9 Technology and Industry Transformation
- 3.10 Competitive Landscape Summary
- 3.11 Analyst View and Strategic Implications
Chapter 4 India Internet Data Center (IDC) Market Trends and Developments
- 4.1 Historical Industry Development, 2018-2025
- 4.2 Recent Market Trends and Developments
- 4.3 Demand and Customer Behavior Trends
- 4.4 Technology and Product Innovation
- 4.5 Artificial Intelligence, Automation and Digitalization
- 4.6 Local Manufacturing and Supply Chain Realignment
- 4.7 Industry Partnerships, Mergers and Acquisitions
- 4.8 Sustainability and Circular Economy Developments
- 4.9 Government and Private Sector Investment Trends
- 4.10 Emerging Business Models and Commercialization
- 4.11 Industry Developments and Announcements
Chapter 5 India Internet Data Center (IDC) Market Production, Supply and Demand Analysis
- 5.1 Demand Trend and Consumption Analysis, 2018-2025
- 5.2 Demand Forecast, 2025-2035
- 5.3 Production and Output Trend, 2018-2025
- 5.4 Production and Output Forecast, 2025-2035
- 5.5 Installed Capacity and Capacity Utilization
- 5.6 Company-Wise Production Plants and Statistics
- 5.6.1 Installed Production Capacity
- 5.6.2 Actual Production
- 5.6.3 Planned Capacity and Expansion Targets
- 5.7 Supply Chain Structure and Procurement Trends
- 5.8 Supply-Demand Gap and Bottlenecks
- 5.9 Import Dependence and Sourcing Structure
- 5.10 Contract Manufacturing and Outsourcing
- 5.11 Regional Supply and Demand Concentration
Chapter 6 India Internet Data Center (IDC) Market Pricing Analysis
- 6.1 Pricing Structure and Measurement
- 6.2 Historical Pricing Trends, 2018-2025
- 6.3 Pricing Outlook, 2025-2035
- 6.4 Average Selling Price and Unit Economics
- 6.5 Pricing by Product and Market Segment
- 6.6 Geographic Pricing Differences
- 6.7 Key Input, Energy, Labor and Logistics Costs
- 6.8 Contract Pricing and Purchasing Models
- 6.9 Pricing Sensitivity and Competitive Positioning
- 6.10 Price, Margin and Profitability Implications
Chapter 7 India Internet Data Center (IDC) Market Dynamics
- 7.1 Market Growth Drivers
- 7.1.1 Demand-Side Drivers
- 7.1.2 Technology and Innovation Drivers
- 7.1.3 Infrastructure and Investment Drivers
- 7.1.4 Regulatory and Policy Drivers
- 7.2 Market Restraints
- 7.2.1 Cost and Affordability Constraints
- 7.2.2 Technology and Adoption Barriers
- 7.2.3 Supply Chain and Operational Constraints
- 7.3 Market Challenges
- 7.3.1 Competitive Pressure and Margin Erosion
- 7.3.2 Skills, Infrastructure and Implementation Gaps
- 7.4 Emerging Market Opportunities
- 7.5 Market Dynamics Impact and Time-Horizon Assessment
Chapter 8 India Internet Data Center (IDC) Value Chain Analysis
- 8.1 Industry Value Chain Overview
- 8.2 Upstream Suppliers and Critical Inputs
- 8.3 Technology and Component Providers
- 8.4 Manufacturing or Service Delivery
- 8.5 Distribution, Channel Partners and Integrators
- 8.6 Downstream Applications and End Users
- 8.7 Value Addition and Profit Pools
- 8.8 Vertical Integration and Outsourcing
- 8.9 Supplier Concentration and Risk
- 8.10 Supply Chain Localization and Resilience
Chapter 9 India Internet Data Center (IDC) Market Regulations and Policies
- 9.1 Relevant Laws, Standards and Compliance Frameworks
- 9.2 Product, Service, Safety and Quality Requirements
- 9.3 Government Policies, Incentives and Subsidies
- 9.4 Imports, Exports and Trade Barriers
- 9.5 Public Procurement and Local Content Requirements
- 9.6 Environmental and Sustainability Compliance
- 9.7 Data Protection, AI and Cybersecurity Compliance
- 9.8 Upcoming Policy Changes and Market Implications
Chapter 10 India Internet Data Center (IDC) Market Hotspots and Opportunities
- 10.1 Market Opportunity Mapping and Growth Hotspots
- 10.2 High-Growth Applications and Customer Groups
- 10.3 Underserved Markets and White-Space Opportunities
- 10.4 Emerging Technology and Product Opportunities
- 10.5 New Capacity and Investment Hotspots
- 10.6 Market Entry and Expansion Opportunities
- 10.7 Distribution and Partnership Opportunities
- 10.8 Near-Term and Long-Term Commercial Potential
- 10.9 Opportunity Attractiveness and Execution Risks
Chapter 11 India Internet Data Center (IDC) Market Outlook, 2025-2035
- 11.1 Market Size and Analysis
- 11.1.1 Revenue (Market Measurement: 2025: USD 1.48 billion → 2035: USD 5.68 billion)
- 11.1.2 Market Volume and Quantity Sold
- 11.1.3 Historical Market Size, 2018-2025
- 11.1.4 Base-Year Market Size, 2025
- 11.2 Market Forecast, 2025-2035
- 11.2.1 Revenue Forecast to 2035
- 11.2.2 Volume Forecast to 2035
- 11.2.3 CAGR and Year-on-Year Growth
- 11.2.4 Incremental Revenue Opportunity
- 11.3 Forecast Assumptions and Scenario Analysis
- 11.3.1 Base-Case Forecast
- 11.3.2 Optimistic and Conservative Scenarios
- 11.3.3 Technology, Pricing and Policy Sensitivities
- 11.4 Market Attractiveness and Growth Outlook
Chapter 12 India Internet Data Center (IDC) Market Segmentation and Outlook
- 12.1 Segmentation Summary and Market Shares, 2025
- 12.2 Largest and Fastest-Growing Segments
- 12.3 By Services - Market Size and Forecast, 2025-2035
- 12.3.1 Segment Definition and Scope
- 12.3.2 Historical Market Size, 2018-2025
- 12.3.3 Revenue Forecast, 2025-2035
- 12.3.4 Volume Forecast, 2025-2035
- 12.3.5 Base-Year Market Share, 2025
- 12.3.6 Segment CAGR and Growth Drivers
- 12.3.7 Subsegment Market Size and Forecast
- 12.3.7.1 Colocation
- 12.3.7.2 Hosting
- 12.3.7.3 CDN
- 12.3.7.4 Others
- 12.3.8 Subsegment Pricing and Adoption Trends
- 12.3.9 Leading Suppliers and Competition
- 12.3.10 Regional Demand and Opportunities
- 12.4 By Deployment - Market Size and Forecast, 2025-2035
- 12.4.1 Segment Definition and Scope
- 12.4.2 Historical Market Size, 2018-2025
- 12.4.3 Revenue Forecast, 2025-2035
- 12.4.4 Volume Forecast, 2025-2035
- 12.4.5 Base-Year Market Share, 2025
- 12.4.6 Segment CAGR and Growth Drivers
- 12.4.7 Subsegment Market Size and Forecast
- 12.4.7.1 Public
- 12.4.7.2 Private
- 12.4.7.3 Hybrid
- 12.4.8 Subsegment Pricing and Adoption Trends
- 12.4.9 Leading Suppliers and Competition
- 12.4.10 Regional Demand and Opportunities
- 12.5 By End User - Market Size and Forecast, 2025-2035
- 12.5.1 Segment Definition and Scope
- 12.5.2 Historical Market Size, 2018-2025
- 12.5.3 Revenue Forecast, 2025-2035
- 12.5.4 Volume Forecast, 2025-2035
- 12.5.5 Base-Year Market Share, 2025
- 12.5.6 Segment CAGR and Growth Drivers
- 12.5.7 Subsegment Market Size and Forecast
- 12.5.7.1 Cloud Service Providers
- 12.5.7.2 Telecom
- 12.5.7.3 Government/Public Sector
- 12.5.7.4 BFSI
- 12.5.7.5 Media & Entertainment
- 12.5.7.6 E-commerce & Retail
- 12.5.7.7 Others
- 12.5.8 Subsegment Pricing and Adoption Trends
- 12.5.9 Leading Suppliers and Competition
- 12.5.10 Regional Demand and Opportunities
- 12.6 Segment Growth Comparison
- 12.7 Segment Attractiveness and Priority Matrix
Chapter 13 India Internet Data Center (IDC) End-Use and Application Market Outlook
- 13.1 End-Use Industry and Customer Demand Structure
- 13.2 Leading Applications and Customer Groups
- 13.3 End-Use Market Size, Share and Forecast
- 13.4 Major End-Use Industry Deep Dives
- 13.4.1 Customer Requirements and Use Cases
- 13.4.2 Demand and Replacement Cycles
- 13.4.3 Technical and Regulatory Considerations
- 13.4.4 Purchasing and Procurement Models
- 13.4.5 Leading Vendors and Distribution Channels
- 13.4.6 Forecast and Commercial Opportunities
- 13.5 Emerging Applications and Cross-Segment Demand
- 13.6 End-Use Industry Investment Priorities
Chapter 14 India Internet Data Center (IDC) Geographic Market Outlook, 2025-2035
- 14.1 Domestic Market Distribution and Demand Clusters
- 14.2 State- or Province-Wise Market Size and Forecast, 2025-2035
- 14.3 City and Metropolitan Market Outlook
- 14.4 Industrial, Manufacturing and Commercial Clusters
- 14.5 Geographic Concentration of Key End Users
- 14.6 Local Pricing and Purchasing Differences
- 14.7 Domestic Production Facilities and Capacity Map
- 14.8 Local Infrastructure and Project Pipeline
- 14.9 State-Level Policy and Incentive Differences
- 14.10 Subnational Investment Hotspots and Opportunities
- 14.11 Distribution and Logistics Networks
- 14.12 Domestic Competitive Footprint
Chapter 15 India Internet Data Center (IDC) Technology, Innovation and Sustainability Outlook
- 15.1 Technology Landscape and Maturity
- 15.2 Product, Process and Service Innovation
- 15.3 AI, Automation and Digital Tools in the Industry
- 15.4 Technology Adoption and Performance Benchmarking
- 15.5 Innovation Pipeline and R&D Investment
- 15.6 Patent and Intellectual Property Trends
- 15.7 Energy Efficiency and Resource Management
- 15.8 Sustainability, Recycling and Circularity
- 15.9 Technology Roadmap, 2025-2035
- 15.10 Risks of Obsolescence and Technology Substitution
Chapter 16 India Internet Data Center (IDC) Market Key Strategic Imperatives
- 16.1 Growth and Market Entry Priorities
- 16.2 High-Return Products and Segments
- 16.3 Pricing, Profitability and Cost Optimization
- 16.4 Technology Investment and Product Differentiation
- 16.5 Supply Chain Localization and Resilience
- 16.6 Distribution and Customer Acquisition
- 16.7 Partnership, Acquisition and Capacity Strategy
- 16.8 Regional Expansion Priorities
- 16.9 Short-, Medium- and Long-Term Actions
Chapter 17 Competition Outlook
- 17.1 Industry Competition Characteristics
- 17.2 Market Structure and Concentration
- 17.3 Market Share and Competitive Positioning, 2025
- 17.4 Company-Wise Revenue and Product Benchmarking
- 17.5 Production and Service Capacity Benchmarking
- 17.6 Technology, Pricing and Differentiation
- 17.7 Regional Footprint and Distribution Strength
- 17.8 Mergers, Acquisitions and Strategic Alliances
- 17.9 New Entrants and Competitive Threats
- 17.10 Porter's Five Forces and Industry Attractiveness
- 17.11 Competitive Outlook, 2025-2035
Chapter 18 Company Profiles
- 18.1 Company Coverage and Selection Criteria
- 18.2 Nxtra by Airtel (Bharti Airtel)
- 18.2.1 Business Description
- 18.2.2 Company Ownership and Geographic Presence
- 18.2.3 Product and Service Portfolio
- 18.2.4 Manufacturing and Operating Footprint
- 18.2.5 Production Capacity and Expansion Plans
- 18.2.6 Financial Performance and Investment
- 18.2.7 Market Share and Competitive Position
- 18.2.8 Technology and Innovation Capabilities
- 18.2.9 Strategic Alliances or Partnerships
- 18.2.10 Recent Developments
- 18.2.11 Growth Strategy and Outlook
- 18.3 CtrlS Datacenters
- 18.4 STT GDC India
- 18.5 Sify Infinit Spaces (Sify Technologies)
- 18.6 AdaniConneX (Adani Enterprises)
- 18.7 Yotta Data Services
- 18.8 NTT Global Data Centers (NTT DATA)
- 18.9 Equinix
- 18.10 Reliance Industries (Jio Platforms)
- 18.11 Tata Communications
- 18.12 Web Werks (Iron Mountain)
- 18.13 Other Relevant Market Participants
Note: Every listed company is profiled on the structure shown under the first company. The company list is preliminary and may change based on research findings, market developments, data availability and client requirements.
Chapter 19 Disclaimer
- 19.1 Research and Forecast Disclaimer
- 19.2 Data Source and Estimation Limitations
Note: The depth of individual sections depends on data availability for this market. Volume, capacity, trade and other unit-based metrics are included where applicable.

