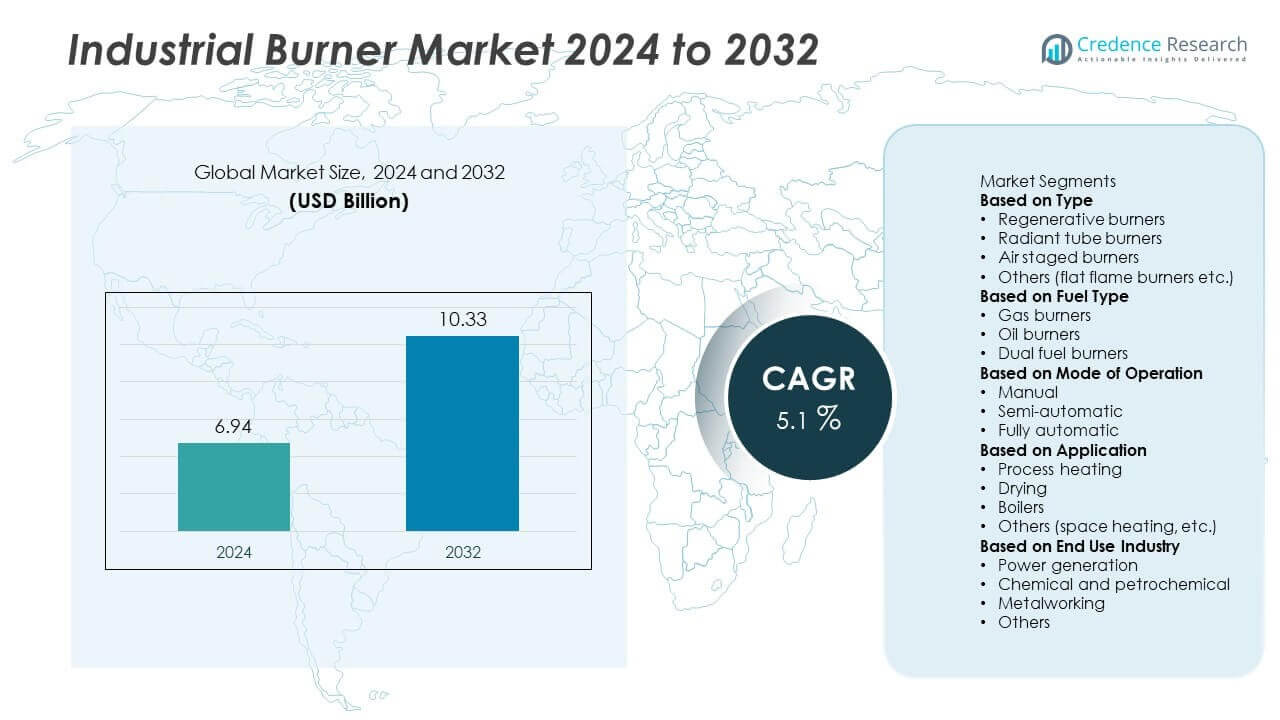
Home » Automation & Process Control » Industrial Burners Market

Industrial Burners Market By Burner Type (Regenerative Burners, Thermal Radiation Burners, Flat Flame Burners, Radiant Burners, Line Burners, Customized Burners), By Fuel Type (Solid Fuel, Oil-Based Burners, Gas-Based Burners, Dual Fuel Burners), By Industry Vertical (Power Generation, Petrochemicals, Chemicals & Specialty Chemicals, Pharmaceuticals, Metals & Mining, Glass & Ceramics, F&B) – Growth, Future Prospects & Competitive Analysis, 2016 – 2030

Price: $4999

Published: | Report ID: 6776 | Report Format : PDF

Key Highlights of the Report

The global industrial burners market is segmented by type, burner type, operative temperature, power rating, sales channel, and region. The dual fuel-based industrial burners category is the most popular. In contrast, the high thermal release burner category is the primary burner type segment and the high temperature (> 1,400 °F) category is most popular operative temperature segment in the market. In addition, the monoblock category held the largest share in the power rating segment. The power generation category is the most common sales channel, with Asia Pacific leading the market growth.

The industrial burner market is anticipated to expand as a result of the rising demand for industrial burners in a range of applications, such as heat exchangers, hot water boilers, steam boilers or air heaters and some process applications. The use of industrial burners on heavy-duty boilers, which can overcome high combustion chamber resistances, is another factor driving the demand.

Nonetheless, the Asia Pacific market for industrial burners is predicted to grow at the greatest CAGR. Factors such as the region’s rapid industrialisation, population growth, rising demand for electricity, and cost advantages due to the region’s cheap labor cost are likely to hasten the industry’s expansion.

Market Overview

The global industrial burners market has witnessed steady growth in recent years and is expected to continue growing at a CAGR of 5.20% between 2023 and 2030. The market was valued at USD 5.8 billion in 2022 and is expected to reach USD 8.3 billion in 2030.

Design Element 2

Access crucial information at unmatched prices!

Request your free sample report today & start making informed decisions powered by Credence Research!

Download Free Sample
CTA Design Element 3

What Are The Main Drivers Of The Global Industrial Burners Market?

The rising demand for good, dependable, more efficient, low-emission industrial heating devices by equipment buyers and machinery manufacturers drives the industrial burner market.

What Are The Major Challenges Faced By The Global Industrial Burners Market?

A lack of skilled labor may hurt the market. Additionally, a decrease in supply and demand has been caused by the closure of manufacturing plants and production facilities as a result of stringent shutdown regulations. As a result, this aspect can moderately restrain the market for industrial burners.

What Are The Growth Opportunities In The Global Industrial Burners Market?

Over the course of the forecast period, the development of heating technology-related technologies is also anticipated to drive the growth of the industrial hob market. Manufacturers are using combustion technology more frequently to boost heating effectiveness.

Executive Summary

Overview of the Global Industrial Burners Market

The market expansion is primarily attributed to the expanding industrial sector, quick technical improvements, soaring demand for energy generation, widespread acceptance of standard safety measures, rising vehicle manufacturing, and expanding mining operations. Moreover, the continuously growing manufacturing sector is boosting the need for industrial burners and combustion systems. The industrial burner market is anticipated to experience strong growth during the projected period as a result of the increasing usage of biofuels, hazardous waste, and hydrogen-based industrial burners.

Market Definition

Devices called industrial burners provide heat for a range of industrial uses. They could be used to produce steam, cure or dry goods, or melt or vaporize materials. Industrial burners are crucial to numerous industrial processes and can increase effectiveness and production. Natural gas, propane, oil, and electricity are just a few of the fuels that can power these appliances. The fuel type will vary depending on the application’s particular requirements.

Industrial Burners Market

Market Insights

  • The global demand for industrial burners was valued at USD 5.8 Billion in 2022 and is expected to reach USD 8.3 Billion in 2030, growing at a CAGR of 5.20% between 2023 and 2030.
  • Regarding value, the dual fuel category led the market and accounted for almost 35% of sales in 2022. The two shaft shredder category is expected to increase at the fastest rate.
  • The high thermal release burner category is expected to continue to dominate the industrial burners market through 2022, with a massive market share of over 27% predicted.
  • The high temperature (> 1,400 °F) category led the market in 2022.
  • The monoblock category is anticipated to dominate the market over the forecast period.
  • The industrial burners market is expected to be dominated by the power generation category, with 22% of market share over the forecast period.
  • In 2022, Asia Pacific will account for roughly one-third of the global market for industrial burners, with the remaining 47% of the market being split between North America and Europe.
  • The rising need for energy-efficient burners across various industries is to be attributed for the market’s expansion. Additionally, increasing investments in the manufacturing and processing sectors to support market expansion.
  • The Asia Pacific, industrial burners industry, is predicted to expand at a faster CAGR. Growing demand for industrial burners from various end-use industries, including petrochemical, food processing, and power generating, is responsible for the growth.

Segmentation by Type

  • With almost 35% of the market share for industrial burners, the dual fuel category remained the top rank in terms of type in 2022.
  • The global industrial burners market is expected to experience the quickest growth throughout the projected period in the gas category.

Segmentation by Burner Type

  • With a market share of over 27% in 2022, the high thermal release burner segment led the global industrial burners market.
  • Throughout the projection period, the others category is expected to register the fastest CAGR.

Segmentation by Operative Temperature

  • With a market share of over 59% in 2022, the high temperature (> 1,400 °F) segment led the industrial burners market.
  • Over the projection period, the category for low temperature (> 1,400 °F) is anticipated to register the highest CAGR.

Segmentation by Power Rating

  • The monoblock category held the highest share, with over 52% of the industrial burners market share in 2022.
  • Over the forecast period, it is predicted that the duoblock segment will be the fastest-growing.

Segmentation by Sales Channel

  • The power generation segment led the industrial burners market with a market share of over 22% in 2022.
  • The metals & mining category is anticipated to register the highest CAGR over the forecast period.

Segmentation by Region

  • Asia Pacific region held the largest global industrial burners market share in 2022.
  • In 2022, North America will occupy more than 33% of the global industrial burners market, with Europe accounting for just under 21%.
  • The rest of the world’s demand for industrial burners comes from places including Latin America, the Middle East, and Africa.

The market’s growth is primarily related to the industrial sector’s expansion, rapid technological advancements, the world’s growing need for energy production, the general acceptance of accepted safety practices, rising vehicle production, and expanding mining activities. The manufacturing industry’s continued expansion is boosting the demand for industrial burners and combustion systems. Due to the rising use of biofuels, hazardous waste, and industrial burners based on hydrogen, the industrial burner market is likely to expand significantly throughout the forecasted period.

Asia Pacific dominated the global industrial burners market. The industrialization of the Asia Pacific area is driving significant changes in the manufacturing industry, which has increased demand for industrial burners throughout the countries in the region. In countries like China, India, South Korea, and Vietnam, demand for industrial burners is increasing due to increased investments in LNG, chemicals, mining, and home manufacturing. Furthering the growing demand for the market includes increased electricity consumption due to improved technical advancements and the expanding presence of various manufacturers throughout the region.

The market for industrial burners in North America is anticipated to grow at the highest CAGR. The market for industrial burners is growing more swiftly in North American countries as a result of continuous expenditures in mining, LNG, chemical, and other industries, as well as the development of domestic manufacturing. In a reasonable time, Canada and the United States, the latter of which is an important producer of oil and gas for the entire world, may completely overpower North America. Comparatively speaking to other North American nations, the United States is expected to exhibit a larger interest in industrial burners.

Overall, the industrial burner market is being propelled by the demand for solid, durable, more effective, and low-emission industrial heating devices by equipment buyers and machinery producers.

The market may suffer from a lack of skilled employees. The closure of industrial plants and production facilities as a result of strict shutdown restrictions has also contributed to a decline in supply and demand. Because of this, the market for industrial burners may be slightly constrained.

Growing Demand For Power Generation

The market for industrial burners is expected to be driven by increased power generation. Higher power output and energy production in large-scale power plants, where industrial burners are situated in boilers, are the primary drivers of the industrial burner market’s expansion. According to a report by world energy & climate statistics, an application that provides data by region with up-to-date statistics and related information, the BRICS countries in 2022, where electricity consumption increased noticeably, particularly in Russia (+6.4%), China (+9.7%), India (+4.8%), and Brazil (+9.5%), were the driving force behind the growth in global power generation (+8.5% in 2021, 10% above its 2019 level). Coal, wind, and solar energy contributed primarily to China’s expansion in electricity production. Consequently, the industrial burner market will experience development throughout the forecast period due to increased power generation.

Increased Investment In R&D By Manufacturers

With an increasing emphasis on lowering carbon footprint, leading players are heavily investing in developing burner capabilities to minimize pollutant levels. A burner that can decrease or eliminate greenhouse gases like NOx would generate the major potential for market competitors. Manufacturers of industrial burners are under increasing pressure to invest in cutting-edge technologies as the emphasis on reducing nitrogen oxide (NOx) emissions grows. There have been innovations and advances in this area as a result of new technology that successfully lowers NOx levels while preserving operational effectiveness. The new technology has successfully demonstrated that it can operate with NOx emissions as low as or equivalent to 6ppm when compensated for by 3 percent. 2. Applications for the technology have been successful, including Once-Through Steam Generators (OTSGs) and Enhanced Oil Recovery (EOR).

High Capital Investments

A capital-intensive technique makes industrial burners with boiler foundations. Companies should concentrate on selecting the raw materials they can affordably obtain and have a continuous supply of them for a lengthy period. Industrial burners, among other auxiliary parts of industrial boilers, require much R&D and finance. After this is finished, the project undergoes major R&D, engineering, and designing processes that require time and money. Industrial boiler prices vary significantly due to design considerations and different after-sale support levels. Compared to more expensive industrial boilers, the budget models have shorter lifespans, fewer guarantees, and less attentive customer service. The boiler’s spending habits influence the cost of purchasing an industrial burner. These elements impact the overall cost of industrial burners and raise the cost of procurement and maintenance.

Advancement In Technology

In the industrial burner industry, technological development is a crucial trend that is becoming more popular. Major firms are developing new technologies and expanding their research and development efforts in the industrial burner market. For instance, in October 2021, E&M Combustion, a Spanish-based provider of new combustion technologies and manufacturer of the industrial burner, unveiled a prototype hydrogen burner that is intended for use in district heating systems and can either run entirely on hydrogen or on a hydrogen-and-natural gas mixture to heat large areas and buildings. This last alternative, which uses a gas and hydrogen mixture, is being tested by E&M Combustion and is quite useful. It contains a hydrogen-natural gas mixture that ranges from 15% to 20%, giving the enriched mixture a higher calorific value and enabling more dependable and efficient combustion. Using hydrogen alone as fuel provides a huge challenge in improving flame detection because of hydrogen’s special characteristics of being invisible to human sight.

Competitive Landscape

Key Players

The global industrial burners market is highly competitive, with the presence of several key players. Some of the major players in the market and their market share are as follows:

  • ANDRITZ Group
  • Baltur S.p.A
  • Bloom Engineering
  • Wood Group PLC (Foster Wheeler AG)
  • Honeywell International Inc. (Maxon)
  • Limpsfield Combustion Engineering Ltd
  • Mitsubishi Hitachi Power Systems, Ltd (MHPS)
  • Oilon Group
  • Osaka Gas Co., Ltd
  • Selas Heat Technology Company
  • R.W. Beckett Corp
  • SAACKE GmbH
  • Industrial Combustion IC
  • Wesman Group
  • Striko Westofen
  • Forbes Marshall Pvt. Ltd.
  • QED Combustion
  • Alzeta Corporation
  • Alfa Therm Limited
  • Weishaupt
  • Enertech GmbH
  • Power Flame (Astec)
  • EOGB Energy Products Ltd.
  • Babcock Wanson
  • Riello S.p.A
  • Zeeco, Inc.
  • Alfa Laval
  • Corbett Industries, Inc.
  • Faber Burner Company
  • AGF Burner Inc.
  • John Zink Hamworthy Combustion
  • Oxilon Private Limited
  • Wayne Combustion Systems
  • SECO/WARWICK, INC.
  • Surface Combustion, Inc.
  • Midco International, Inc.
  • ELCO GmbH

To stay competitive in the market, these businesses prioritise product innovation, enlarging their distribution networks, and mergers and acquisitions.

The key players in the worldwide industrial burners market are continually launching new products and developments to stay ahead.

In July 2021, ANDRITZ acquired Enviroburners Oy, a producer of cutting-edge industrial heating equipment solutions for generating energy and preserving the environment. This acquisition creates growth prospects, particularly in environmental protection applications where harmful chemicals are burned to produce new raw materials.

Shape Your Report to Specific Countries or Regions & Enjoy 30% Off!

Summary of Key Findings

  • The development of innovations connected to heating technology is also projected to fuel the expansion of the industrial hob market during the course of the forecast year. To improve the efficiency of heating, manufacturers are increasingly employing combustion technology.
  • Market segmented by type, burner type, operative temperature, power rating, sales channel, and region.
  • The dual fuel category is the most popular, with gas category as the primary industrial burner type.
  • The monoblock segment is the industrial burners market’s most commonly used power rating.
  • The Asia Pacific is leading market growth; the market is highly competitive with key players including ANDRITZ Group, Baltur S.p.A, Bloom Engineering, Wood Group PLC (Foster Wheeler AG), Honeywell International Inc. (Maxon), Limpsfield Combustion Engineering Ltd, Mitsubishi Hitachi Power Systems, Ltd (MHPS), Oilon Group, Osaka Gas Co., Ltd, Selas Heat Technology Company, R.W. Beckett Corp, SAACKE GmbH, Industrial Combustion IC, Wesman Group, Striko Westofen, Forbes Marshall Pvt. Ltd., QED Combustion, Alzeta Corporation, Alfa Therm Limited, Weishaupt, Enertech GmbH, Power Flame (Astec),  EOGB Energy Products Ltd., Babcock Wanson, Riello S.p.A, Zeeco, Inc., Alfa Laval, Corbett Industries, Inc., Faber Burner Company, AGF Burner Inc., John Zink Hamworthy Combustion, Oxilon Private Limited, Wayne Combustion Systems, SECO/WARWICK, INC., Surface Combustion, Inc., Midco International, Inc., and ELCO GmbH.

Future Outlook

  • The global market for industrial burners is expected to increase significantly, especially in the Asia Pacific region.
  • The rise in demand for sturdy, long-lasting, more efficient, and low-emission industrial heating devices by equipment buyers and machinery manufacturers is driving the industrial burner market.
  • Lack of skilled workers could hurt the market. A drop in supply and demand has also been attributed to the closure of manufacturing plants and other production facilities as a result of stringent shutdown regulations.
  • In order to be competitive in the market, major companies should focus on creating novel items, expanding their market, and maintaining cheap power ratings.

Segmentation

  • By Type
    • Oil
    • Gas
    • Solid Fuel
    • Dual Fuel
  • By Burner Type
    • Regenerative Burner
    • High Thermal Release Burner
    • Radiant Burner
    • Direct-fired Burner
    • Self-recuperative Burner
    • Others (Ribbon burners, lines burners, duct burners, pipe burners, and high-velocity burners)
  • By Operative Temperature
    • High Temperature (> 1,400 °F)
    • Low Temperature (> 1,400 °F)
  • By Power Rating
    • Monoblock
    • Duoblock
  • By Sales Channel
    • Food & Beverages
    • Petrochemicals
    • Power Generation
    • Chemicals
    • Metals & Mining
    • Automotive
    • Others (Textiles, glass, paper and pilp, ceramics, and rubber)
  • By Region
  • North America
    • US
    • Canada
    • Mexico
  • Europe
    • Germany
    • France
    • UK.
    • Italy
    • Spain
    • Rest of Europe
  • Asia Pacific
    • China
    • Japan
    • India
    • South Korea
    • South-east Asia
    • Rest of Asia Pacific
  • Latin America
    • Brazil
    • Argentina
    • Rest of Latin America
  • Middle East & Africa
    • GCC Countries
    • South Africa
    • Rest of Middle East and Africa

Chapter 1 Preface ……………………………………………………………………. 31
1.1 Report Description …………………………………………………………………………………………… 31
1.1.1 Purpose of the Report …………………………………………………………………………… 31
1.1.2 Target Audience ………………………………………………………………………………….. 31
1.1.3 USP and Key Offerings ………………………………………………………………………….. 31
1.2 Research Scope ……………………………………………………………………………………………….. 32
1.3 Research Methodology …………………………………………………………………………………….. 33
1.3.1 Phase I – Secondary Research ………………………………………………………………… 34
1.3.2 Phase II – Primary Research …………………………………………………………………… 35
1.3.3 Phase III – Expert Panel Review ………………………………………………………………. 35
1.3.4 Assumptions……………………………………………………………………………………….. 36
1.3.5 Approach Adopted ………………………………………………………………………………. 36

Chapter 2 Executive Summary …………………………………………………. 37
2.1 Market Snapshot: Global Industrial Burner Market ………………………………………………. 37

Chapter 3 Market Dynamics …………………………………………………….. 39
3.1 Introduction ……………………………………………………………………………………………………. 39
3.2 Market Drivers ………………………………………………………………………………………………… 41
3.2.1 Stringent regulatory scenario for industrial burner’s fabrication ……………………. 41
3.2.2 Burner management systems to provide enhanced safety for traditional
burners ……………………………………………………………………………………………… 42
3.3 Restraints ……………………………………………………………………………………………………….. 43
3.3.1 Difficult retrofitting procedure of industrial burners …………………………………… 43
3.4 Opportunities ………………………………………………………………………………………………….. 44
3.4.1 Emergence of smart burners with wireless communication competencies ………. 44
3.4.2 Use of 3D printing technology in industrial burner manufacturing …………………. 44
3.5 Market Attractiveness Analysis ………………………………………………………………………….. 46
3.5.1 Type ………………………………………………………………………………………………….. 46
3.5.2 Automation ………………………………………………………………………………………… 46
3.5.3 Fuel Type……………………………………………………………………………………………. 47
3.5.4 Operating Temperature ………………………………………………………………………… 47
3.5.5 Application …………………………………………………………………………………………. 48
3.5.6 Geography …………………………………………………………………………………………. 48
3.6 Value Chain Analysis ………………………………………………………………………………………… 49
3.7 Porter’s Five Forces Analysis ……………………………………………………………………………… 50
3.8 Company Market Share Analysis ………………………………………………………………………… 51

Chapter 4 COVID 19 Impact on Industrial Burner Market ………….. 52
4.1 Global Industrial Burner Market, 2019 – 2026, Pre V/S Post COVID 19 …………………….. 52
4.2 COVID 19 Impact ……………………………………………………………………………………………… 53
4.3 Estimated Impact of The Coronavirus (Covid-19) Epidemic on The Industrial
Burner Market Size In 2020, By Scenario ……………………………………………………………… 54
4.4 Impact on Import and Export …………………………………………………………………………….. 54
4.5 Macro-Economic Factors …………………………………………………………………………………… 55
4.6 Outlook for trade in 2020 and 2021 ……………………………………………………………………. 55

Chapter 5 Global Industrial Burner Market, By Type …………………. 58
5.1 Global Industrial Burner Market Share by Type, 2019 and 2026 ……………………………… 58
5.2 Regenerative Burners ……………………………………………………………………………………….. 59
5.3 Thermal Radiation Burner …………………………………………………………………………………. 59
5.4 Flat Flame Burners …………………………………………………………………………………………… 60
5.5 Radiant Burners ………………………………………………………………………………………………. 60
5.6 Line Burners ……………………………………………………………………………………………………. 61
5.7 Customized Burners …………………………………………………………………………………………. 61
5.8 Other Industrial Burner …………………………………………………………………………………….. 62

Chapter 6 Global Industrial Burner Market, By Automation ………. 63
6.1 Global Industrial Burner Market Share by Automation, 2019 and 2026 ……………………. 63
6.2 Monoblock Burners ………………………………………………………………………………………….. 64
6.3 Duoblock Burner ……………………………………………………………………………………………… 64

Chapter 7 Global Industrial Burner Market, By Fuel Type …………. 65
7.1 Global Industrial Burner Market Share by Fuel Type, 2019 and 2026 ……………………….. 65
7.2 Oil-based Burners …………………………………………………………………………………………….. 66
7.3 Gas-based Burner …………………………………………………………………………………………….. 66
7.4 Dual fuel Burners……………………………………………………………………………………………… 67
7.5 Other Burners………………………………………………………………………………………………….. 67

Chapter 8 Global Industrial Burner Market, By Fuel Type …………. 68
8.1 Global Industrial Burner Market Share by Fuel Type, 2019 and 2026 ……………………….. 68
8.2 High Temperature (> 1400F) ………………………………………………………………………………. 69
8.3 Low Temp (< 1400F) Burner ………………………………………………………………………………. 69

Chapter 9 Global Industrial Burner Market, By Application ………. 70
9.1 Global Industrial Burner Market Share by Application, 2019 ………………………………….. 70
9.2 Petrochemicals Burners…………………………………………………………………………………….. 71
9.3 Power Generation Burners ………………………………………………………………………………… 71
9.4 Chemicals & Specialty Chemicals Burners ……………………………………………………………. 72
9.5 Metal, Mining & Mineral Burners……………………………………………………………………….. 72
9.6 Pharmaceutical Burners ……………………………………………………………………………………. 73
9.7 Glass & Ceramics Burners ………………………………………………………………………………….. 73
9.8 Food & Beverages ……………………………………………………………………………………………. 74
9.9 Others Burners ………………………………………………………………………………………………… 74

Chapter 10 Global Industrial Burner Market, By Geography ……….. 75
10.1 Global Industrial Burner Market Share by Geography, 2019 …………………………………… 75
10.2 North America …………………………………………………………………………………………………. 76
10.3 Europe ……………………………………………………………………………………………………………. 76
10.4 Asia Pacific ……………………………………………………………………………………………………… 77
10.5 Latin America ………………………………………………………………………………………………….. 77
10.6 Middle East and Africa ……………………………………………………………………………………… 78

Chapter 11 North America Industrial Burner Market …………………… 79
11.1 North America Industrial Burner Market Share, By Country, 2019 …………………………… 79
11.2 North America …………………………………………………………………………………………………. 80
11.2.1 North America Industrial Burner Market, By Country, 2015 – 2019 (USD
Million) ……………………………………………………………………………………………… 80
11.2.2 North America Industrial Burner Market, By Country, 2020 – 2026 (USD
Million) ……………………………………………………………………………………………… 80
11.3 Type ………………………………………………………………………………………………………………. 81
11.3.1 North America Industrial Burner Market, By Type, 2015 – 2019 (USD
Million) ……………………………………………………………………………………………… 81
11.3.2 North America Industrial Burner Market, By Type, 2020 – 2026 (USD
Million) ……………………………………………………………………………………………… 81
11.4 Automation …………………………………………………………………………………………………….. 82
11.4.1 North America Industrial Burner Market, By Automation, 2015 – 2019
(USD Million) ………………………………………………………………………………………. 82
11.4.2 North America Industrial Burner Market, By Automation, 2020 – 2026
(USD Million) ………………………………………………………………………………………. 82
11.5 Fuel Type ………………………………………………………………………………………………………… 83
11.5.1 North America Industrial Burner Market, By Fuel Type, 2015 – 2019 (USD
Million) ……………………………………………………………………………………………… 83
11.5.2 North America Industrial Burner Market, By Fuel Type, 2020 – 2026 (USD
Million) ……………………………………………………………………………………………… 83
11.6 Operating Temperature ……………………………………………………………………………………. 84
11.6.1 North America Industrial Burner Market, By Operating Temperature, 2015
– 2019 (USD Million) …………………………………………………………………………….. 84
11.6.2 North America Industrial Burner Market, By Operating Temperature, 2020
– 2026 (USD Million) …………………………………………………………………………….. 84
11.7 Application ……………………………………………………………………………………………………… 85
11.7.1 North America Industrial Burner Market, By Application, 2015 – 2019
(USD Million) ………………………………………………………………………………………. 85
11.7.2 North America Industrial Burner Market, By Application, 2020 – 2026
(USD Million) ………………………………………………………………………………………. 85
11.8 U.S. ………………………………………………………………………………………………………………… 86
11.8.1 Type ………………………………………………………………………………………………….. 86
11.8.1.1 U.S. Industrial Burner Market, By Type, 2015 –
2019 (USD Million) ……………………………………………. 86
11.8.1.2 U.S. Industrial Burner Market, By Type, 2020 –
2026 (USD Million) ……………………………………………. 86
11.8.2 Automation ………………………………………………………………………………………… 87
11.8.2.1 U.S. Industrial Burner Market, By Automation, 2015
– 2019 (USD Million) ………………………………………….. 87
11.8.2.2 U.S. Industrial Burner Market, By Automation, 2020
– 2026 (USD Million) ………………………………………….. 87
11.8.3 Fuel Type……………………………………………………………………………………………. 88
11.8.3.1 U.S. Industrial Burner Market, By Fuel Type, 2015 –
2019 (USD Million) ……………………………………………. 88
11.8.3.2 U.S. Industrial Burner Market, By Fuel Type, 2020 –
2026 (USD Million) ……………………………………………. 88
11.8.4 Operating Temperature ………………………………………………………………………… 89
11.8.4.1 U.S. Industrial Burner Market, By Operating
Temperature, 2015 – 2019 (USD Million) …………………. 89
11.8.4.2 U.S. Industrial Burner Market, By Operating
Temperature, 2020 – 2026 (USD Million) …………………. 89
11.8.5 Application …………………………………………………………………………………………. 90
11.8.5.1 U.S. Industrial Burner Market, By Application, 2015
– 2019 (USD Million) ………………………………………….. 90
11.8.5.2 U.S. Industrial Burner Market, By Application, 2020
– 2026 (USD Million) ………………………………………….. 90
11.9 Rest of North America ………………………………………………………………………………………. 91
11.9.1 Type ………………………………………………………………………………………………….. 91
11.9.1.1 Rest of North America Industrial Burner Market, By
Type, 2015 – 2019 (USD Million) …………………………… 91
11.9.1.2 Rest of North America Industrial Burner Market, By
Type, 2020 – 2026 (USD Million) …………………………… 91
11.9.2 Automation ………………………………………………………………………………………… 92
11.9.2.1 Rest of North America Industrial Burner Market, By
Automation, 2015 – 2019 (USD Million) …………………… 92
11.9.2.2 Rest of North America Industrial Burner Market, By
Automation, 2020 – 2026 (USD Million) …………………… 92
11.9.3 Fuel Type……………………………………………………………………………………………. 93
11.9.3.1 Rest of North America Industrial Burner Market, By
Fuel Type, 2015 – 2019 (USD Million)……………………… 93
11.9.3.2 Rest of North America Industrial Burner Market, By
Fuel Type, 2020 – 2026 (USD Million)……………………… 93
11.9.4 Operating Temperature ………………………………………………………………………… 94
11.9.4.1 Rest of North America Industrial Burner Market, By
Operating Temperature, 2015 – 2019 (USD Million) …….. 94
11.9.4.2 Rest of North America Industrial Burner Market, By
Operating Temperature, 2020 – 2026 (USD Million) …….. 94
11.9.5 Application …………………………………………………………………………………………. 95
11.9.5.1 Rest of North America Industrial Burner Market, By
Application, 2015 – 2019 (USD Million) ……………………. 95
11.9.5.2 Rest of North America Industrial Burner Market, By
Application, 2020 – 2026 (USD Million) ……………………. 95

Chapter 12 Europe Industrial Burner Market ………………………………. 96
12.1 Europe Industrial Burner Market Share, By Country, 2019 ……………………………………… 96
12.2 Europe ……………………………………………………………………………………………………………. 97
12.2.1 Europe Industrial Burner Market, By Country, 2015 – 2019 (USD Million) ……….. 97
12.2.2 Europe Industrial Burner Market, By Country, 2020 – 2026 (USD Million) ……….. 97
12.3 Type ………………………………………………………………………………………………………………. 98
12.3.1 Europe Industrial Burner Market, By Type, 2015 – 2019 (USD Million) ……………. 98
12.3.2 Europe Industrial Burner Market, By Type, 2020 – 2026 (USD Million) ……………. 98
12.4 Automation …………………………………………………………………………………………………….. 99
12.4.1 Europe Industrial Burner Market, By Automation, 2015 – 2019 (USD
Million) ……………………………………………………………………………………………… 99
12.4.2 Europe Industrial Burner Market, By Automation, 2020 – 2026 (USD
Million) ……………………………………………………………………………………………… 99
12.5 Fuel Type ………………………………………………………………………………………………………. 100
12.5.1 Europe Industrial Burner Market, By Fuel Type, 2015 – 2019 (USD Million) ……. 100
12.5.2 Europe Industrial Burner Market, By Fuel Type, 2020 – 2026 (USD Million) ……. 100
12.6 Operating Temperature ………………………………………………………………………………….. 101
12.6.1 Europe Industrial Burner Market, By Operating Temperature, 2015 – 2019
(USD Million) …………………………………………………………………………………….. 101
12.6.2 Europe Industrial Burner Market, By Operating Temperature, 2020 – 2026
(USD Million) …………………………………………………………………………………….. 101
12.7 Application ……………………………………………………………………………………………………. 102
12.7.1 Europe Industrial Burner Market, By Application, 2015 – 2019 (USD
Million) ……………………………………………………………………………………………. 102
12.7.2 Europe Industrial Burner Market, By Application, 2020 – 2026 (USD
Million) ……………………………………………………………………………………………. 102
12.8 UK ……………………………………………………………………………………………………………….. 103
12.8.1 Type ………………………………………………………………………………………………… 103
12.8.1.1 UK Industrial Burner Market, By Type, 2015 – 2019
(USD Million) …………………………………………………. 103
12.8.1.2 UK Industrial Burner Market, By Type, 2020 – 2026
(USD Million) …………………………………………………. 103
12.8.2 Automation ………………………………………………………………………………………. 104
12.8.2.1 UK Industrial Burner Market, By Automation, 2015 –
2019 (USD Million) ………………………………………….. 104
12.8.2.2 UK Industrial Burner Market, By Automation, 2020 –
2026 (USD Million) ………………………………………….. 104
12.8.3 Fuel Type………………………………………………………………………………………….. 105
12.8.3.1 UK Industrial Burner Market, By Fuel Type, 2015 –
2019 (USD Million) ………………………………………….. 105
12.8.3.2 UK Industrial Burner Market, By Fuel Type, 2020 –
2026 (USD Million) ………………………………………….. 105
12.8.4 Operating Temperature ………………………………………………………………………. 106
12.8.4.1 UK Industrial Burner Market, By Operating
Temperature, 2015 – 2019 (USD Million) ……………….. 106
12.8.4.2 UK Industrial Burner Market, By Operating
Temperature, 2020 – 2026 (USD Million) ……………….. 106
12.8.5 Application ……………………………………………………………………………………….. 107
12.8.5.1 UK Industrial Burner Market, By Application, 2015 –
2019 (USD Million) ………………………………………….. 107
12.8.5.2 UK Industrial Burner Market, By Application, 2020 –
2026 (USD Million) ………………………………………….. 107
12.9 France ………………………………………………………………………………………………………….. 108
12.9.1 Type ………………………………………………………………………………………………… 108
12.9.1.1 France Industrial Burner Market, By Type, 2015 –
2019 (USD Million) ………………………………………….. 108
12.9.1.2 France Industrial Burner Market, By Type, 2020 –
2026 (USD Million) ………………………………………….. 108
12.9.2 Automation ………………………………………………………………………………………. 109
12.9.2.1 France Industrial Burner Market, By Automation,
2015 – 2019 (USD Million) …………………………………. 109
12.9.2.2 France Industrial Burner Market, By Automation,
2020 – 2026 (USD Million) …………………………………. 109
12.9.3 Fuel Type………………………………………………………………………………………….. 110
12.9.3.1 France Industrial Burner Market, By Fuel Type, 2015
– 2019 (USD Million) ………………………………………… 110
12.9.3.2 France Industrial Burner Market, By Fuel Type, 2020
– 2026 (USD Million) ………………………………………… 110
12.9.4 Operating Temperature ………………………………………………………………………. 111
12.9.4.1 France Industrial Burner Market, By Operating
Temperature, 2015 – 2019 (USD Million) ……………….. 111
12.9.4.2 France Industrial Burner Market, By Operating
Temperature, 2020 – 2026 (USD Million) ……………….. 111
12.9.5 Application ……………………………………………………………………………………….. 112
12.9.5.1 France Industrial Burner Market, By Application,
2015 – 2019 (USD Million) …………………………………. 112
12.9.5.2 France Industrial Burner Market, By Application,
2020 – 2026 (USD Million) …………………………………. 112
12.10 Germany ………………………………………………………………………………………………………. 113
12.10.1 Type ………………………………………………………………………………………………… 113
12.10.1.1 Germany Industrial Burner Market, By Type, 2015 –
2019 (USD Million) ………………………………………….. 113
12.10.1.2 Germany Industrial Burner Market, By Type, 2020 –
2026 (USD Million) ………………………………………….. 113
12.10.2 Automation ………………………………………………………………………………………. 114
12.10.2.1 Germany Industrial Burner Market, By Automation,
2015 – 2019 (USD Million) …………………………………. 114
12.10.2.2 Germany Industrial Burner Market, By Automation,
2020 – 2026 (USD Million) …………………………………. 114
12.10.3 Fuel Type………………………………………………………………………………………….. 115
12.10.3.1 Germany Industrial Burner Market, By Fuel Type,
2015 – 2019 (USD Million) …………………………………. 115
12.10.3.2 Germany Industrial Burner Market, By Fuel Type,
2020 – 2026 (USD Million) …………………………………. 115
12.10.4 116
12.10.5 Operating Temperature ………………………………………………………………………. 116
12.10.5.1 Germany Industrial Burner Market, By Operating
Temperature, 2015 – 2019 (USD Million) ……………….. 116
12.10.5.2 Germany Industrial Burner Market, By Operating
Temperature, 2020 – 2026 (USD Million) ……………….. 116
12.10.6 Application ……………………………………………………………………………………….. 117
12.10.6.1 Germany Industrial Burner Market, By Application,
2015 – 2019 (USD Million) …………………………………. 117
12.10.6.2 Germany Industrial Burner Market, By Application,
2020 – 2026 (USD Million) …………………………………. 117
12.11 Rest of Europe ……………………………………………………………………………………………….. 118
12.11.1 Type ………………………………………………………………………………………………… 118
12.11.1.1 Rest of Europe Industrial Burner Market, By Type,
2015 – 2019 (USD Million) …………………………………. 118
12.11.1.2 Rest of Europe Industrial Burner Market, By Type,
2020 – 2026 (USD Million) …………………………………. 118
12.11.2 Automation ………………………………………………………………………………………. 119
12.11.2.1 Rest of Europe Industrial Burner Market, By
Automation, 2015 – 2019 (USD Million) …………………. 119
12.11.2.2 Rest of Europe Industrial Burner Market, By
Automation, 2020 – 2026 (USD Million) …………………. 119
12.11.3 Fuel Type………………………………………………………………………………………….. 120
12.11.3.1 Rest of Europe Industrial Burner Market, By Fuel
Type, 2015 – 2019 (USD Million) …………………………. 120
12.11.3.2 Rest of Europe Industrial Burner Market, By Fuel
Type, 2020 – 2026 (USD Million) …………………………. 120
12.11.4 Operating Temperature ………………………………………………………………………. 121
12.11.4.1 Rest of Europe Industrial Burner Market, By
Operating Temperature, 2015 – 2019 (USD Million) …… 121
12.11.4.2 Rest of Europe Industrial Burner Market, By
Operating Temperature, 2020 – 2026 (USD Million) …… 121
12.11.5 Application ……………………………………………………………………………………….. 122
12.11.5.1 Rest of Europe Industrial Burner Market, By
Application, 2015 – 2019 (USD Million) ………………….. 122
12.11.5.2 Rest of Europe Industrial Burner Market, By
Application, 2020 – 2026 (USD Million) ………………….. 122

Chapter 13 Asia Pacific Industrial Burner Market ……………………… 123
13.1 Asia Pacific Industrial Burner Market Share, By Country, 2019 ……………………………… 123
13.2 Asia Pacific ……………………………………………………………………………………………………. 124
13.2.1 Asia Pacific Industrial Burner Market, By Country, 2015 – 2019 (USD
Million) ……………………………………………………………………………………………. 124
13.2.2 Asia Pacific Industrial Burner Market, By Country, 2020 – 2026 (USD
Million) ……………………………………………………………………………………………. 124
13.3 Type …………………………………………………………………………………………………………….. 125
13.3.1 Asia Pacific Industrial Burner Market, By Type, 2015 – 2019 (USD Million) …….. 125
13.3.2 Asia Pacific Industrial Burner Market, By Type, 2020 – 2026 (USD Million) …….. 125
13.4 Automation …………………………………………………………………………………………………… 126
13.4.1 Asia Pacific Industrial Burner Market, By Automation, 2015 – 2019 (USD
Million) ……………………………………………………………………………………………. 126
13.4.2 Asia Pacific Industrial Burner Market, By Automation, 2020 – 2026 (USD
Million) ……………………………………………………………………………………………. 126
13.5 Fuel Type ………………………………………………………………………………………………………. 127
13.5.1 Asia Pacific Industrial Burner Market, By Fuel Type, 2015 – 2019 (USD
Million) ……………………………………………………………………………………………. 127
13.5.2 Asia Pacific Industrial Burner Market, By Fuel Type, 2020 – 2026 (USD
Million) ……………………………………………………………………………………………. 127
13.6 Operating Temperature ………………………………………………………………………………….. 128
13.6.1 Asia Pacific Industrial Burner Market, By Operating Temperature, 2015 –
2019 (USD Million) ……………………………………………………………………………… 128
13.6.2 Asia Pacific Industrial Burner Market, By Operating Temperature, 2020 –
2026 (USD Million) ……………………………………………………………………………… 128
13.7 Application ……………………………………………………………………………………………………. 129
13.7.1 Asia Pacific Industrial Burner Market, By Application, 2015 – 2019 (USD
Million) ……………………………………………………………………………………………. 129
13.7.2 Asia Pacific Industrial Burner Market, By Application, 2020 – 2026 (USD
Million) ……………………………………………………………………………………………. 129
13.8 China ……………………………………………………………………………………………………………. 130
13.8.1 Type ………………………………………………………………………………………………… 130
13.8.1.1 China Industrial Burner Market, By Type, 2015 –
2019 (USD Million) ………………………………………….. 130
13.8.1.2 China Industrial Burner Market, By Type, 2020 –
2026 (USD Million) ………………………………………….. 130
13.8.2 Automation ………………………………………………………………………………………. 131
13.8.2.1 China Industrial Burner Market, By Automation,
2015 – 2019 (USD Million) …………………………………. 131
13.8.2.2 China Industrial Burner Market, By Automation,
2020 – 2026 (USD Million) …………………………………. 131
13.8.3 Fuel Type………………………………………………………………………………………….. 132
13.8.3.1 China Industrial Burner Market, By Fuel Type, 2015
– 2019 (USD Million) ………………………………………… 132
13.8.3.2 China Industrial Burner Market, By Fuel Type, 2020
– 2026 (USD Million) ………………………………………… 132
13.8.4 Operating Temperature ………………………………………………………………………. 133
13.8.4.1 China Industrial Burner Market, By Operating
Temperature, 2015 – 2019 (USD Million) ……………….. 133
13.8.4.2 China Industrial Burner Market, By Operating
Temperature, 2020 – 2026 (USD Million) ……………….. 133
13.8.5 Application ……………………………………………………………………………………….. 134
13.8.5.1 China Industrial Burner Market, By Application, 2015
– 2019 (USD Million) ………………………………………… 134
13.8.5.2 China Industrial Burner Market, By Application, 2020
– 2026 (USD Million) ………………………………………… 134
13.9 Japan ……………………………………………………………………………………………………………. 135
13.9.1 Type ………………………………………………………………………………………………… 135
13.9.1.1 Japan Industrial Burner Market, By Type, 2015 –
2019 (USD Million) ………………………………………….. 135
13.9.1.2 Japan Industrial Burner Market, By Type, 2020 –
2026 (USD Million) ………………………………………….. 135
13.9.2 Automation ………………………………………………………………………………………. 136
13.9.2.1 Japan Industrial Burner Market, By Automation,
2015 – 2019 (USD Million) …………………………………. 136
13.9.2.2 Japan Industrial Burner Market, By Automation,
2020 – 2026 (USD Million) …………………………………. 136
13.9.3 Fuel Type………………………………………………………………………………………….. 137
13.9.3.1 Japan Industrial Burner Market, By Fuel Type, 2015
– 2019 (USD Million) ………………………………………… 137
13.9.3.2 Japan Industrial Burner Market, By Fuel Type, 2020
– 2026 (USD Million) ………………………………………… 137
13.9.4 Operating Temperature ………………………………………………………………………. 138
13.9.4.1 Japan Industrial Burner Market, By Operating
Temperature, 2015 – 2019 (USD Million) ……………….. 138
13.9.4.2 Japan Industrial Burner Market, By Operating
Temperature, 2020 – 2026 (USD Million) ……………….. 138
13.9.5 Application ……………………………………………………………………………………….. 139
13.9.5.1 Japan Industrial Burner Market, By Application, 2015
– 2019 (USD Million) ………………………………………… 139
13.9.5.2 Japan Industrial Burner Market, By Application, 2020
– 2026 (USD Million) ………………………………………… 139
13.10 India …………………………………………………………………………………………………………….. 140
13.10.1 Type ………………………………………………………………………………………………… 140
13.10.1.1 India Industrial Burner Market, By Type, 2015 –
2019 (USD Million) ………………………………………….. 140
13.10.1.2 India Industrial Burner Market, By Type, 2020 –
2026 (USD Million) ………………………………………….. 140
13.10.2 Automation ………………………………………………………………………………………. 141
13.10.2.1 India Industrial Burner Market, By Automation, 2015
– 2019 (USD Million) ………………………………………… 141
13.10.2.2 India Industrial Burner Market, By Automation, 2020
– 2026 (USD Million) ………………………………………… 141
13.10.3 Fuel Type………………………………………………………………………………………….. 142
13.10.3.1 India Industrial Burner Market, By Fuel Type, 2015 –
2019 (USD Million) ………………………………………….. 142
13.10.3.2 India Industrial Burner Market, By Fuel Type, 2020 –
2026 (USD Million) ………………………………………….. 142
13.10.4 Operating Temperature ………………………………………………………………………. 143
13.10.4.1 India Industrial Burner Market, By Operating
Temperature, 2015 – 2019 (USD Million) ……………….. 143
13.10.4.2 India Industrial Burner Market, By Operating
Temperature, 2020 – 2026 (USD Million) ……………….. 143
13.10.5 Application ……………………………………………………………………………………….. 144
13.10.5.1 India Industrial Burner Market, By Application, 2015
– 2019 (USD Million) ………………………………………… 144
13.10.5.2 India Industrial Burner Market, By Application, 2020
– 2026 (USD Million) ………………………………………… 144
13.11 Rest of Asia Pacific …………………………………………………………………………………………. 145
13.11.1 Type ………………………………………………………………………………………………… 145
13.11.1.1 Rest of Asia Pacific Industrial Burner Market, By
Type, 2015 – 2019 (USD Million) …………………………. 145
13.11.1.2 Rest of Asia Pacific Industrial Burner Market, By
Type, 2020 – 2026 (USD Million) …………………………. 145
13.11.2 Automation ………………………………………………………………………………………. 146
13.11.2.1 Rest of Asia Pacific Industrial Burner Market, By
Automation, 2015 – 2019 (USD Million) …………………. 146
13.11.2.2 Rest of Asia Pacific Industrial Burner Market, By
Automation, 2020 – 2026 (USD Million) …………………. 146
13.11.3 Fuel Type………………………………………………………………………………………….. 147
13.11.3.1 Rest of Asia Pacific Industrial Burner Market, By Fuel
Type, 2015 – 2019 (USD Million) …………………………. 147
13.11.3.2 Rest of Asia Pacific Industrial Burner Market, By Fuel
Type, 2020 – 2026 (USD Million) …………………………. 147
13.11.4 Operating Temperature ………………………………………………………………………. 148
13.11.4.1 Rest of Asia Pacific Industrial Burner Market, By
Operating Temperature, 2015 – 2019 (USD Million) …… 148
13.11.4.2 Rest of Asia Pacific Industrial Burner Market, By
Operating Temperature, 2020 – 2026 (USD Million) …… 148
13.11.5 Application ……………………………………………………………………………………….. 149
13.11.5.1 Rest of Asia Pacific Industrial Burner Market, By
Application, 2015 – 2019 (USD Million) ………………….. 149
13.11.5.2 Rest of Asia Pacific Industrial Burner Market, By
Application, 2020 – 2026 (USD Million) ………………….. 149

Chapter 14 Latin America Industrial Burner Market ………………….. 150
14.1 Latin America Industrial Burner Market Share, By Country, 2019 ………………………….. 150
14.2 Country ………………………………………………………………………………………………………… 151
14.2.1 Latin America Industrial Burner Market, By Country, 2015 – 2019 (USD
Million) ……………………………………………………………………………………………. 151
14.2.2 Latin America Industrial Burner Market, By Country, 2020 – 2026 (USD
Million) ……………………………………………………………………………………………. 151
14.3 Type …………………………………………………………………………………………………………….. 152
14.3.1 Latin America Industrial Burner Market, By Type, 2015 – 2019 (USD
Million) ……………………………………………………………………………………………. 152
14.3.2 Latin America Industrial Burner Market, By Type, 2020 – 2026 (USD
Million) ……………………………………………………………………………………………. 152
14.4 Automation …………………………………………………………………………………………………… 153
14.4.1 Latin America Industrial Burner Market, By Automation, 2015 – 2019 (USD
Million) ……………………………………………………………………………………………. 153
14.4.2 Latin America Industrial Burner Market, By Automation, 2020 – 2026 (USD
Million) ……………………………………………………………………………………………. 153
14.5 Fuel Type ………………………………………………………………………………………………………. 154
14.5.1 Latin America Industrial Burner Market, By Fuel Type, 2015 – 2019 (USD
Million) ……………………………………………………………………………………………. 154
14.5.2 Latin America Industrial Burner Market, By Fuel Type, 2020 – 2026 (USD
Million) ……………………………………………………………………………………………. 154
14.6 Operating Temperature ………………………………………………………………………………….. 155
14.6.1 Latin America Industrial Burner Market, By Operating Temperature, 2015
– 2019 (USD Million) …………………………………………………………………………… 155
14.6.2 Latin America Industrial Burner Market, By Operating Temperature, 2020
– 2026 (USD Million) …………………………………………………………………………… 155
14.7 Application ……………………………………………………………………………………………………. 156
14.7.1 Latin America Industrial Burner Market, By Application, 2015 – 2019 (USD
Million) ……………………………………………………………………………………………. 156
14.7.2 Latin America Industrial Burner Market, By Application, 2020 – 2026 (USD
Million) ……………………………………………………………………………………………. 156
14.8 Brazil- …………………………………………………………………………………………………………… 157
14.8.1 Type ………………………………………………………………………………………………… 157
14.8.1.1 Brazil Industrial Burner Market, By Type, 2015 –
2019 (USD Million) ………………………………………….. 157
14.8.1.2 Brazil Industrial Burner Market, By Type, 2020 –
2026 (USD Million) ………………………………………….. 157
14.8.2 Automation ………………………………………………………………………………………. 158
14.8.2.1 Brazil Industrial Burner Market, By Automation,
2015 – 2019 (USD Million) …………………………………. 158
14.8.2.2 Brazil Industrial Burner Market, By Automation,
2020 – 2026 (USD Million) …………………………………. 158
14.8.3 Fuel Type………………………………………………………………………………………….. 159
14.8.3.1 Brazil Industrial Burner Market, By Fuel Type, 2015
– 2019 (USD Million) ………………………………………… 159
14.8.3.2 Brazil Industrial Burner Market, By Fuel Type, 2020
– 2026 (USD Million) ………………………………………… 159
14.8.4 Operating Temperature ………………………………………………………………………. 160
14.8.4.1 Brazil Industrial Burner Market, By Operating
Temperature, 2015 – 2019 (USD Million) ……………….. 160
14.8.4.2 Brazil Industrial Burner Market, By Operating
Temperature, 2020 – 2026 (USD Million) ……………….. 160
14.8.5 Application ……………………………………………………………………………………….. 161
14.8.5.1 Brazil Industrial Burner Market, By Application, 2015
– 2019 (USD Million) ………………………………………… 161
14.8.5.2 Brazil Industrial Burner Market, By Application, 2020
– 2026 (USD Million) ………………………………………… 161
14.9 Rest of Latin America ……………………………………………………………………………………… 162
14.9.1 Type ………………………………………………………………………………………………… 162
14.9.1.1 Rest of Latin America Industrial Burner Market, By
Type, 2015 – 2019 (USD Million) …………………………. 162
14.9.1.2 Rest of Latin America Industrial Burner Market, By
Type, 2020 – 2026 (USD Million) …………………………. 162
14.9.2 Automation ………………………………………………………………………………………. 163
14.9.2.1 Rest of Latin America Industrial Burner Market, By
Automation, 2015 – 2019 (USD Million) …………………. 163
14.9.2.2 Rest of Latin America Industrial Burner Market, By
Automation, 2020 – 2026 (USD Million) …………………. 163
14.9.3 Fuel Type………………………………………………………………………………………….. 164
14.9.3.1 Rest of Latin America Industrial Burner Market, By
Fuel Type, 2015 – 2019 (USD Million)……………………. 164
14.9.3.2 Rest of Latin America Industrial Burner Market, By
Fuel Type, 2020 – 2026 (USD Million)……………………. 164
14.9.4 Operating Temperature ………………………………………………………………………. 165
14.9.4.1 Rest of Latin America Industrial Burner Market, By
Operating Temperature, 2015 – 2019 (USD Million) …… 165
14.9.4.2 Rest of Latin America Industrial Burner Market, By
Operating Temperature, 2020 – 2026 (USD Million) …… 165
14.9.5 Application ……………………………………………………………………………………….. 166
14.9.5.1 Rest of Latin America Industrial Burner Market, By
Application, 2015 – 2019 (USD Million) ………………….. 166
14.9.5.2 Rest of Latin America Industrial Burner Market, By
Application, 2020 – 2026 (USD Million) ………………….. 166

Chapter 15 Middle East and Africa Industrial Burner Market …….. 167
15.1 Middle East and Africa Industrial Burner Market Share, By Region, 2019 ……………….. 167
15.2 Region ………………………………………………………………………………………………………….. 168
15.2.1 Middle East and Africa Industrial Burner Market, By Region, 2015 – 2019
(USD Million) …………………………………………………………………………………….. 168
15.2.2 Middle East and Africa Industrial Burner Market, By Country, 2020 – 2026
(USD Million) …………………………………………………………………………………….. 168
15.3 Type …………………………………………………………………………………………………………….. 169
15.3.1 Middle East & Africa Industrial Burner Market, By Type, 2015 – 2019 (USD
Million) ……………………………………………………………………………………………. 169
15.3.2 Middle East & Africa Industrial Burner Market, By Type, 2020 – 2026 (USD
Million) ……………………………………………………………………………………………. 169
15.4 Automation …………………………………………………………………………………………………… 170
15.4.1 Middle East & Africa Industrial Burner Market, By Automation, 2015 –
2019 (USD Million) ……………………………………………………………………………… 170
15.4.2 Middle East & Africa Industrial Burner Market, By Automation, 2020 –
2026 (USD Million) ……………………………………………………………………………… 170
15.5 Fuel Type ………………………………………………………………………………………………………. 171
15.5.1 Middle East & Africa Industrial Burner Market, By Fuel Type, 2015 – 2019
(USD Million) …………………………………………………………………………………….. 171
15.5.2 Middle East & Africa Industrial Burner Market, By Fuel Type, 2020 – 2026
(USD Million) …………………………………………………………………………………….. 171
15.6 Operating Temperature ………………………………………………………………………………….. 172
15.6.1 Middle East & Africa Industrial Burner Market, By Operating
Temperature, 2015 – 2019 (USD Million) ………………………………………………… 172
15.6.2 Middle East & Africa Industrial Burner Market, By Operating
Temperature, 2020 – 2026 (USD Million) ………………………………………………… 172
15.7 Application ……………………………………………………………………………………………………. 173
15.7.1 Middle East & Africa Industrial Burner Market, By Application, 2015 –
2019 (USD Million) ……………………………………………………………………………… 173
15.7.2 Middle East & Africa Industrial Burner Market, By Application, 2020 –
2026 (USD Million) ……………………………………………………………………………… 173
15.8 Middle East …………………………………………………………………………………………………… 174
15.8.1 Type ………………………………………………………………………………………………… 174
15.8.1.1 Middle East Industrial Burner Market, By Type, 2015
– 2019 (USD Million) ………………………………………… 174
15.8.1.2 Middle East Industrial Burner Market, By Type, 2020
– 2026 (USD Million) ………………………………………… 174
15.8.2 Automation ………………………………………………………………………………………. 175
15.8.2.1 Middle East Industrial Burner Market, By
Automation, 2015 – 2019 (USD Million) …………………. 175
15.8.2.2 Middle East Industrial Burner Market, By
Automation, 2020 – 2026 (USD Million) …………………. 175
15.8.3 Fuel Type………………………………………………………………………………………….. 176
15.8.3.1 Middle East Industrial Burner Market, By Fuel Type,
2015 – 2019 (USD Million) …………………………………. 176
15.8.3.2 Middle East Industrial Burner Market, By Fuel Type,
2020 – 2026 (USD Million) …………………………………. 176
15.8.4 Operating Temperature ………………………………………………………………………. 177
15.8.4.1 Middle East Industrial Burner Market, By Operating
Temperature, 2015 – 2019 (USD Million) ……………….. 177
15.8.4.2 Middle East Industrial Burner Market, By Operating
Temperature, 2020 – 2026 (USD Million) ……………….. 177
15.8.5 Application ……………………………………………………………………………………….. 178
15.8.5.1 Middle East Industrial Burner Market, By Application,
2015 – 2019 (USD Million) …………………………………. 178
15.8.5.2 Middle East Industrial Burner Market, By Application,
2020 – 2026 (USD Million) …………………………………. 178
15.9 Africa ……………………………………………………………………………………………………………. 179
15.9.1 Type ………………………………………………………………………………………………… 179
15.9.1.1 Africa Industrial Burner Market, By Type, 2015 –
2019 (USD Million) ………………………………………….. 179
15.9.1.2 Africa Industrial Burner Market, By Type, 2020 –
2026 (USD Million) ………………………………………….. 179
15.9.2 Automation ………………………………………………………………………………………. 180
15.9.2.1 Africa Industrial Burner Market, By Automation,
2015 – 2019 (USD Million) …………………………………. 180
15.9.2.2 Africa Industrial Burner Market, By Automation,
2020 – 2026 (USD Million) …………………………………. 180
15.9.3 Fuel Type………………………………………………………………………………………….. 181
15.9.3.1 Africa Industrial Burner Market, By Fuel Type, 2015
– 2019 (USD Million) ………………………………………… 181
15.9.3.2 Africa Industrial Burner Market, By Fuel Type, 2020
– 2026 (USD Million) ………………………………………… 181
15.9.4 Operating Temperature ………………………………………………………………………. 182
15.9.4.1 Africa Industrial Burner Market, By Operating
Temperature, 2015 – 2019 (USD Million) ……………….. 182
15.9.4.2 Africa Industrial Burner Market, By Operating
Temperature, 2020 – 2026 (USD Million) ……………….. 182
15.9.5 Application ……………………………………………………………………………………….. 183
15.9.5.1 Africa Industrial Burner Market, By Application, 2015
– 2019 (USD Million) ………………………………………… 183
15.9.5.2 Africa Industrial Burner Market, By Application, 2020
– 2026 (USD Million) ………………………………………… 183

Chapter 16 Company Profile ……………………………………………………. 184
16.1 ALZETA Corporation ……………………………………………………………………………………….. 184
16.1.1 Business Overview ……………………………………………………………………………… 184
16.1.2 ALZETA Corporation Industrial Burner Type and Applications ……………………… 185
16.2 Andritz AG …………………………………………………………………………………………………….. 186
16.2.1 Business Overview ……………………………………………………………………………… 186
16.2.2 Andritz AG Industrial Burner Type and Applications ………………………………….. 187
16.3 Bloom Engineering Company, Inc. …………………………………………………………………….. 188
16.3.1 Business Overview ……………………………………………………………………………… 188
16.3.2 Bloom Engineering Company, Inc. Industrial Burner Type and Applications …… 189
16.4 Forbes Marshall ……………………………………………………………………………………………… 190
16.4.1 Business Overview ……………………………………………………………………………… 190
16.4.2 Forbes Marshall Industrial Burner Type and Applications …………………………… 191
16.5 Limpsfield Combustion Engineering Ltd. ……………………………………………………………. 192
16.5.1 Business Overview ……………………………………………………………………………… 192
16.5.2 Limpsfield Combustion Engineering Ltd. Industrial Burner Type and
Applications ……………………………………………………………………………………… 193
16.6 Maxon Corporation ………………………………………………………………………………………… 194
16.6.1 Business Overview ……………………………………………………………………………… 194
16.6.2 Maxon Corporation Industrial Burner Type and Applications ………………………. 195
16.7 Mitsubishi Hitachi Power Systems, Ltd………………………………………………………………. 196
16.7.1 Business Overview ……………………………………………………………………………… 196
16.7.2 Mitsubishi Hitachi Power Systems, Ltd. Industrial Burner Type and
Applications ……………………………………………………………………………………… 197
16.8 Oilon Oy ……………………………………………………………………………………………………….. 198
16.8.1 Business Overview ……………………………………………………………………………… 198
16.8.2 Oilon Oy Industrial Burner Type and Applications …………………………………….. 198
16.9 Osaka Gas Co., Ltd. …………………………………………………………………………………………. 199
16.9.1 Business Overview ……………………………………………………………………………… 199
16.9.2 Osaka Gas Co., Ltd. Industrial Burner Type and Applications ………………………. 200
16.10 Selas Heat Technology Company ………………………………………………………………………. 201
16.10.1 Business Overview ……………………………………………………………………………… 201
16.10.2 Selas Heat Technology Company Industrial Burner Type and Applications …….. 202
16.11 Weishaupt Group …………………………………………………………………………………………… 203
16.11.1 Business Overview ……………………………………………………………………………… 203
16.11.2 Weishaupt Group Industrial Burner Type and Applications…………………………. 204

List of Figures
FIG. 1 Global Industrial Burner Market: Research Methodology 34
FIG. 2 Top-Down and Bottom Up Approach 36
FIG. 3 Market Attractiveness Analysis, by Type 46
FIG. 4 Market Attractiveness Analysis, by Automation 46
FIG. 5 Market Attractiveness Analysis, by Fuel Type 47
FIG. 6 Market Attractiveness Analysis, by Operating Temperature 47
FIG. 7 Market Attractiveness Analysis, by Application 48
FIG. 8 Market Attractiveness Analysis, by Geography 48
FIG. 9 Value Chain Analysis 49
FIG. 10 Porter’s Five Forces Analysis 50
FIG. 11 Company Share Analysis, 2019 51
FIG. 12 Global Industrial Burner Market, 2019 – 2026, Pre V/S Post COVID 19 52
FIG. 13 World merchandise trade volume, 2000‑2022 56
FIG. 14 Global Industrial Burner Market Share by Type, 2019 58
FIG. 15 Global Regenerative Burners Market, 2015 – 2026 59
FIG. 16 Global Thermal Radiation Burner Market, 2015 – 2026 59
FIG. 17 Global Flat Flame Burners Market, 2015 – 2026 60
FIG. 18 Global Radiant Burners Market, 2015 – 2026 60
FIG. 19 Global Line Burners Market, 2015 – 2026 61
FIG. 20 Global Customized Burners Market, 2015 – 2026 61
FIG. 21 Global Other Industrial Burner Market, 2015 – 2026 62
FIG. 22 Global Industrial Burner Market Share by Automation, 2019 63
FIG. 23 Global Monoblock Burners Market, 2015 – 2026 64
FIG. 24 Global Duoblock Burner Market, 2015 – 2026 64
FIG. 25 Global Industrial Burner Market Share by Fuel Type, 2019 65
FIG. 26 Global Oil-based Burners Market, 2015 – 2026 66
FIG. 27 Global Gas-based Burner Market, 2015 – 2026 66
FIG. 28 Global Dual fuel Burners Market, 2015 – 2026 67
FIG. 29 Global Other Burners Market, 2015 – 2026 67
FIG. 30 Global Industrial Burner Market Share by Fuel Type, 2019 68
FIG. 31 Global High Temperature (> 1400F) Burners Market, 2015 – 2026 69
FIG. 32 Global Low Temp (< 1400F) Burner Market, 2015 – 2026 69
FIG. 33 Global Industrial Burner Market Share by Application, 2019 70
FIG. 34 Global Petrochemicals Burners Market, 2015 – 2026 71
FIG. 35 Global Power Generation Burners Market, 2015 – 2026 71
FIG. 36 Global Chemicals & Specialty Chemicals Burners Market, 2015 – 2026 72
FIG. 37 Global Metal, Mining & Mineral Burners Market, 2015 – 2026 72
FIG. 38 Global Pharmaceutical Burners Market, 2015 – 2026 73
FIG. 39 Global Glass & Ceramics Burners Market, 2015 – 2026 73
FIG. 40 Global Food & Beverages Burners Market, 2015 – 2026 74
FIG. 41 Global Others Burners Market, 2015 – 2026 74
FIG. 42 Global Industrial Burner Market Share by Geography, 2019 75
FIG. 43 North America Industrial Burner Market, 2015 – 2026 76
FIG. 44 Europe Industrial Burner Market, 2015 – 2026 76
FIG. 45 Asia Pacific Industrial Burner Market, 2015 – 2026 77
FIG. 46 Latin America Industrial Burner Market, 2015 – 2026 77
FIG. 47 Middle East and Africa Industrial Burner Market, 2015 – 2026 78
FIG. 48 North America Industrial Burner Market Share by Country, 2019 79
FIG. 49 Europe Industrial Burner Market Share by Country, 2019 96
FIG. 50 Asia Pacific Industrial Burner Market Share by Country, 2019 123
FIG. 51 Latin America Industrial Burner Market Share by Country, 2019 150
FIG. 52 Middle East and Africa Industrial Burner Market Share by Region, 2019 167

List of Tables
TABLE 1 Market Snapshot: Global Industrial Burner Market 37
TABLE 2 Estimated Impact of The Coronavirus (Covid-19) Epidemic on The Industrial
Burner Market Size In 2020, By Scenario 54
TABLE 3 Impact on Import and Export 54
TABLE 4 North America Industrial Burner Market, By Country, 2015 – 2019 (USD Million)
80
TABLE 5 North America Industrial Burner Market, By Country, 2020 – 2026 (USD Million)
80
TABLE 6 North America Industrial Burner Market, By Type, 2015 – 2019 (USD Million) 81
TABLE 7 North America Industrial Burner Market, By Type, 2020 – 2026 (USD Million) 81
TABLE 8 North America Industrial Burner Market, By Automation, 2015 – 2019 (USD Million)
82
TABLE 9 North America Industrial Burner Market, By Automation, 2020 – 2026 (USD Million)
82
TABLE 10 North America Industrial Burner Market, By Fuel Type, 2015 – 2019 (USD Million)
83
TABLE 11 North America Industrial Burner Market, By Fuel Type, 2020 – 2026 (USD Million)
83
TABLE 12 North America Industrial Burner Market, By Operating Temperature, 2015 – 2019
(USD Million) 84
TABLE 13 North America Industrial Burner Market, By Operating Temperature, 2020 – 2026
(USD Million) 84
TABLE 14 North America Industrial Burner Market, By Application, 2015 – 2019 (USD Million)
85
TABLE 15 North America Industrial Burner Market, By Application, 2020 – 2026 (USD Million)
85
TABLE 16 U.S. Industrial Burner Market, By Type, 2015 – 2019 (USD Million) 86
TABLE 17 U.S. Industrial Burner Market, By Type, 2020 – 2026 (USD Million) 86
TABLE 18 U.S. Industrial Burner Market, By Automation, 2015 – 2019 (USD Million) 87
TABLE 19 U.S. Industrial Burner Market, By Automation, 2020 – 2026 (USD Million) 87
TABLE 20 U.S. Industrial Burner Market, By Fuel Type, 2015 – 2019 (USD Million) 88
TABLE 21 U.S. Industrial Burner Market, By Fuel Type, 2020 – 2026 (USD Million) 88
TABLE 22 U.S. Industrial Burner Market, By Operating Temperature, 2015 – 2019 (USD
Million) 89
TABLE 23 U.S. Industrial Burner Market, By Operating Temperature, 2020 – 2026 (USD
Million) 89
TABLE 24 U.S. Industrial Burner Market, By Application, 2015 – 2019 (USD Million) 90
TABLE 25 U.S. Industrial Burner Market, By Application, 2020 – 2026 (USD Million) 90
TABLE 26 Rest of North America Industrial Burner Market, By Type, 2015 – 2019 (USD
Million) 91
TABLE 27 Rest of North America Industrial Burner Market, By Type, 2020 – 2026 (USD
Million) 91
TABLE 28 Rest of North America Industrial Burner Market, By Automation, 2015 – 2019 (USD
Million) 92
TABLE 29 Rest of North America Industrial Burner Market, By Automation, 2020 – 2026 (USD
Million) 92
TABLE 30 Rest of North America Industrial Burner Market, By Fuel Type, 2015 – 2019 (USD
93
TABLE 31 Million) 93
TABLE 32 Rest of North America Industrial Burner Market, By Fuel Type, 2020 – 2026 (USD
Million) 93
TABLE 33 Rest of North America Industrial Burner Market, By Operating Temperature, 2015
– 2019 (USD Million) 94
TABLE 34 Rest of North America Industrial Burner Market, By Operating Temperature, 2020
– 2026 (USD Million) 94
TABLE 35 Rest of North America Industrial Burner Market, By Application, 2015 – 2019 (USD
Million) 95
TABLE 36 Rest of North America Industrial Burner Market, By Application, 2020 – 2026 (USD
Million) 95
TABLE 37 Europe Industrial Burner Market, By Country, 2015 – 2019 (USD Million) 97
TABLE 38 Europe Industrial Burner Market, By Country, 2020 – 2026 (USD Million) 97
TABLE 39 Europe Industrial Burner Market, By Type, 2015 – 2019 (USD Million) 98
TABLE 40 Europe Industrial Burner Market, By Type, 2020 – 2026 (USD Million) 98
TABLE 41 Europe Industrial Burner Market, By Automation, 2015 – 2019 (USD Million) 99
TABLE 42 Europe Industrial Burner Market, By Automation, 2020 – 2026 (USD Million) 99
TABLE 43 Europe Industrial Burner Market, By Fuel Type, 2015 – 2019 (USD Million) 100
TABLE 44 Europe Industrial Burner Market, By Fuel Type, 2020 – 2026 (USD Million) 100
TABLE 45 Europe Industrial Burner Market, By Operating Temperature, 2015 – 2019 (USD
Million) 101
TABLE 46 Europe Industrial Burner Market, By Operating Temperature, 2020 – 2026 (USD
Million) 101
TABLE 47 Europe Industrial Burner Market, By Application, 2015 – 2019 (USD Million) 102
TABLE 48 Europe Industrial Burner Market, By Application, 2020 – 2026 (USD Million) 102
TABLE 49 UK Industrial Burner Market, By Type, 2015 – 2019 (USD Million) 103
TABLE 50 UK Industrial Burner Market, By Type, 2020 – 2026 (USD Million) 103
TABLE 51 UK Industrial Burner Market, By Automation, 2015 – 2019 (USD Million) 104
TABLE 52 UK Industrial Burner Market, By Automation, 2020 – 2026 (USD Million) 104
TABLE 53 UK Industrial Burner Market, By Fuel Type, 2015 – 2019 (USD Million) 105
TABLE 54 UK Industrial Burner Market, By Fuel Type, 2020 – 2026 (USD Million) 105
TABLE 55 UK Industrial Burner Market, By Operating Temperature, 2015 – 2019 (USD
Million) 106
TABLE 56 UK Industrial Burner Market, By Operating Temperature, 2020 – 2026 (USD
Million) 106
TABLE 57 UK Industrial Burner Market, By Application, 2015 – 2019 (USD Million) 107
TABLE 58 UK Industrial Burner Market, By Application, 2020 – 2026 (USD Million) 107
TABLE 59 France Industrial Burner Market, By Type, 2015 – 2019 (USD Million) 108
TABLE 60 France Industrial Burner Market, By Type, 2020 – 2026 (USD Million) 108
TABLE 61 France Industrial Burner Market, By Automation, 2015 – 2019 (USD Million) 109
TABLE 62 France Industrial Burner Market, By Automation, 2020 – 2026 (USD Million) 109
TABLE 63 France Industrial Burner Market, By Fuel Type, 2015 – 2019 (USD Million) 110
TABLE 64 France Industrial Burner Market, By Fuel Type, 2020 – 2026 (USD Million) 110
TABLE 65 France Industrial Burner Market, By Operating Temperature, 2015 – 2019 (USD
Million) 111
TABLE 66 France Industrial Burner Market, By Operating Temperature, 2020 – 2026 (USD
Million) 111
TABLE 67 France Industrial Burner Market, By Application, 2015 – 2019 (USD Million) 112
TABLE 68 France Industrial Burner Market, By Application, 2020 – 2026 (USD Million) 112
TABLE 69 Germany Industrial Burner Market, By Type, 2015 – 2019 (USD Million) 113
TABLE 70 Germany Industrial Burner Market, By Type, 2020 – 2026 (USD Million) 113
TABLE 71 Germany Industrial Burner Market, By Automation, 2015 – 2019 (USD Million) 114
TABLE 72 Germany Industrial Burner Market, By Automation, 2020 – 2026 (USD Million) 114
TABLE 73 Germany Industrial Burner Market, By Fuel Type, 2015 – 2019 (USD Million) 115
TABLE 74 Germany Industrial Burner Market, By Fuel Type, 2020 – 2026 (USD Million) 115
TABLE 75 Germany Industrial Burner Market, By Operating Temperature, 2015 – 2019 (USD
Million) 116
TABLE 76 Germany Industrial Burner Market, By Operating Temperature, 2020 – 2026 (USD
Million) 116
TABLE 77 Germany Industrial Burner Market, By Application, 2015 – 2019 (USD Million) 117
TABLE 78 Germany Industrial Burner Market, By Application, 2020 – 2026 (USD Million) 117
TABLE 79 Rest of Europe Industrial Burner Market, By Type, 2015 – 2019 (USD Million) 118
TABLE 80 Rest of Europe Industrial Burner Market, By Type, 2020 – 2026 (USD Million) 118
TABLE 81 Rest of Europe Industrial Burner Market, By Automation, 2015 – 2019 (USD
Million) 119
TABLE 82 Rest of Europe Industrial Burner Market, By Automation, 2020 – 2026 (USD
Million) 119
TABLE 83 Rest of Europe Industrial Burner Market, By Fuel Type, 2015 – 2019 (USD Million)
120
TABLE 84 Rest of Europe Industrial Burner Market, By Fuel Type, 2020 – 2026 (USD Million)
120
TABLE 85 Rest of Europe Industrial Burner Market, By Operating Temperature, 2015 – 2019
(USD Million) 121
TABLE 86 Rest of Europe Industrial Burner Market, By Operating Temperature, 2020 – 2026
(USD Million) 121
TABLE 87 Rest of Europe Industrial Burner Market, By Application, 2015 – 2019 (USD
Million) 122
TABLE 88 Rest of Europe Industrial Burner Market, By Application, 2020 – 2026 (USD
Million) 122
TABLE 89 Asia Pacific Industrial Burner Market, By Country, 2015 – 2019 (USD Million) 124
TABLE 90 Asia Pacific Industrial Burner Market, By Country, 2020 – 2026 (USD Million) 124
TABLE 91 Asia Pacific Industrial Burner Market, By Type, 2015 – 2019 (USD Million) 125
TABLE 92 Asia Pacific Industrial Burner Market, By Type, 2020 – 2026 (USD Million) 125
TABLE 93 Asia Pacific Industrial Burner Market, By Automation, 2015 – 2019 (USD Million)
126
TABLE 94 Asia Pacific Industrial Burner Market, By Automation, 2020 – 2026 (USD Million)
126
TABLE 95 Asia Pacific Industrial Burner Market, By Fuel Type, 2015 – 2019 (USD Million)
127
TABLE 96 Asia Pacific Industrial Burner Market, By Fuel Type, 2020 – 2026 (USD Million)
127
TABLE 97 Asia Pacific Industrial Burner Market, By Operating Temperature, 2015 – 2019
(USD Million) 128
TABLE 98 Asia Pacific Industrial Burner Market, By Operating Temperature, 2020 – 2026
(USD Million) 128
TABLE 99 Asia Pacific Industrial Burner Market, By Application, 2015 – 2019 (USD Million)
129
TABLE 100 Asia Pacific Industrial Burner Market, By Application, 2020 – 2026 (USD Million)
129
TABLE 101 China Industrial Burner Market, By Type, 2015 – 2019 (USD Million) 130
TABLE 102 China Industrial Burner Market, By Type, 2020 – 2026 (USD Million) 130
TABLE 103 China Industrial Burner Market, By Automation, 2015 – 2019 (USD Million) 131
TABLE 104 China Industrial Burner Market, By Automation, 2020 – 2026 (USD Million) 131
TABLE 105 China Industrial Burner Market, By Fuel Type, 2015 – 2019 (USD Million) 132
TABLE 106 China Industrial Burner Market, By Fuel Type, 2020 – 2026 (USD Million) 132
TABLE 107 China Industrial Burner Market, By Operating Temperature, 2015 – 2019 (USD
Million) 133
TABLE 108 China Industrial Burner Market, By Operating Temperature, 2020 – 2026 (USD
Million) 133
TABLE 109 China Industrial Burner Market, By Application, 2015 – 2019 (USD Million) 134
TABLE 110 China Industrial Burner Market, By Application, 2020 – 2026 (USD Million) 134
TABLE 111 Japan Industrial Burner Market, By Type, 2015 – 2019 (USD Million) 135
TABLE 112 Japan Industrial Burner Market, By Type, 2020 – 2026 (USD Million) 135
TABLE 113 Japan Industrial Burner Market, By Automation, 2015 – 2019 (USD Million) 136
TABLE 114 Japan Industrial Burner Market, By Automation, 2020 – 2026 (USD Million) 136
TABLE 115 Japan Industrial Burner Market, By Fuel Type, 2015 – 2019 (USD Million) 137
TABLE 116 Japan Industrial Burner Market, By Fuel Type, 2020 – 2026 (USD Million) 137
TABLE 117 Japan Industrial Burner Market, By Operating Temperature, 2015 – 2019 (USD
Million) 138
TABLE 118 Japan Industrial Burner Market, By Operating Temperature, 2020 – 2026 (USD
Million) 138
TABLE 119 Japan Industrial Burner Market, By Application, 2015 – 2019 (USD Million) 139
TABLE 120 Japan Industrial Burner Market, By Application, 2020 – 2026 (USD Million) 139
TABLE 121 India Industrial Burner Market, By Type, 2015 – 2019 (USD Million) 140
TABLE 122 India Industrial Burner Market, By Type, 2020 – 2026 (USD Million) 140
TABLE 123 India Industrial Burner Market, By Automation, 2015 – 2019 (USD Million) 141
TABLE 124 India Industrial Burner Market, By Automation, 2020 – 2026 (USD Million) 141
TABLE 125 India Industrial Burner Market, By Fuel Type, 2015 – 2019 (USD Million) 142
TABLE 126 India Industrial Burner Market, By Fuel Type, 2020 – 2026 (USD Million) 142
TABLE 127 India Industrial Burner Market, By Operating Temperature, 2015 – 2019 (USD
Million) 143
TABLE 128 India Industrial Burner Market, By Operating Temperature, 2020 – 2026 (USD
Million) 143
TABLE 129 India Industrial Burner Market, By Application, 2015 – 2019 (USD Million) 144
TABLE 130 India Industrial Burner Market, By Application, 2020 – 2026 (USD Million) 144
TABLE 131 Rest of Asia Pacific Industrial Burner Market, By Type, 2015 – 2019 (USD Million)
145
TABLE 132 Rest of Asia Pacific Industrial Burner Market, By Type, 2020 – 2026 (USD Million)
145
TABLE 133 Rest of Asia Pacific Industrial Burner Market, By Automation, 2015 – 2019 (USD
Million) 146
TABLE 134 Rest of Asia Pacific Industrial Burner Market, By Automation, 2020 – 2026 (USD
Million) 146
TABLE 135 Rest of Asia Pacific Industrial Burner Market, By Fuel Type, 2015 – 2019 (USD
Million) 147
TABLE 136 Rest of Asia Pacific Industrial Burner Market, By Fuel Type, 2020 – 2026 (USD
Million) 147
TABLE 137 Rest of Asia Pacific Industrial Burner Market, By Operating Temperature, 2015 –
2019 (USD Million) 148
TABLE 138 Rest of Asia Pacific Industrial Burner Market, By Operating Temperature, 2020 –
2026 (USD Million) 148
TABLE 139 Rest of Asia Pacific Industrial Burner Market, By Application, 2015 – 2019 (USD
Million) 149
TABLE 140 Rest of Asia Pacific Industrial Burner Market, By Application, 2020 – 2026 (USD
Million) 149
TABLE 141 Latin America Industrial Burner Market, By Country, 2015 – 2019 (USD Million)
151
TABLE 142 Latin America Industrial Burner Market, By Country, 2020 – 2026 (USD Million)
151
TABLE 143 Latin America Industrial Burner Market, By Type, 2015 – 2019 (USD Million) 152
TABLE 144 Latin America Industrial Burner Market, By Type, 2020 – 2026 (USD Million) 152
TABLE 145 Latin America Industrial Burner Market, By Automation, 2015 – 2019 (USD Million)
153
TABLE 146 Latin America Industrial Burner Market, By Automation, 2020 – 2026 (USD Million)
153
TABLE 147 Latin America Industrial Burner Market, By Fuel Type, 2015 – 2019 (USD Million)
154
TABLE 148 Latin America Industrial Burner Market, By Fuel Type, 2020 – 2026 (USD Million)
154
TABLE 149 Latin America Industrial Burner Market, By Operating Temperature, 2015 – 2019
(USD Million) 155
TABLE 150 Latin America Industrial Burner Market, By Operating Temperature, 2020 – 2026
(USD Million) 155
TABLE 151 Latin America Industrial Burner Market, By Application, 2015 – 2019 (USD Million)
156
TABLE 152 Latin America Industrial Burner Market, By Application, 2020 – 2026 (USD Million)
156
TABLE 153 Brazil Industrial Burner Market, By Type, 2015 – 2019 (USD Million) 157
TABLE 154 Brazil Industrial Burner Market, By Type, 2020 – 2026 (USD Million) 157
TABLE 155 Brazil Industrial Burner Market, By Automation, 2015 – 2019 (USD Million) 158
TABLE 156 Brazil Industrial Burner Market, By Automation, 2020 – 2026 (USD Million) 158
TABLE 157 Brazil Industrial Burner Market, By Fuel Type, 2015 – 2019 (USD Million) 159
TABLE 158 Brazil Industrial Burner Market, By Fuel Type, 2020 – 2026 (USD Million) 159
TABLE 159 Brazil Industrial Burner Market, By Operating Temperature, 2015 – 2019 (USD
Million) 160
TABLE 160 Brazil Industrial Burner Market, By Operating Temperature, 2020 – 2026 (USD
Million) 160
TABLE 161 Brazil Industrial Burner Market, By Application, 2015 – 2019 (USD Million) 161
TABLE 162 Brazil Industrial Burner Market, By Application, 2020 – 2026 (USD Million) 161
TABLE 163 Rest of Latin America Industrial Burner Market, By Type, 2015 – 2019 (USD
Million) 162
TABLE 164 Rest of Latin America Industrial Burner Market, By Type, 2020 – 2026 (USD
Million) 162
TABLE 165 Rest of Latin America Industrial Burner Market, By Automation, 2015 – 2019 (USD
Million) 163
TABLE 166 Rest of Latin America Industrial Burner Market, By Automation, 2020 – 2026 (USD
Million) 163
TABLE 167 Rest of Latin America Industrial Burner Market, By Fuel Type, 2015 – 2019 (USD
164
TABLE 168 Million) 164
TABLE 169 Rest of Latin America Industrial Burner Market, By Fuel Type, 2020 – 2026 (USD
Million) 164
TABLE 170 Rest of Latin America Industrial Burner Market, By Operating Temperature, 2015 –
2019 (USD Million) 165
TABLE 171 Rest of Latin America Industrial Burner Market, By Operating Temperature, 2020 –
2026 (USD Million) 165
TABLE 172 Rest of Latin America Industrial Burner Market, By Application, 2015 – 2019 (USD
Million) 166
TABLE 173 Rest of Latin America Industrial Burner Market, By Application, 2020 – 2026 (USD
Million) 166
TABLE 174 Middle East and Africa Industrial Burner Market, By Region, 2015 – 2019 (USD
Million) 168
TABLE 175 Middle East and Africa Industrial Burner Market, By Country, 2020 – 2026 (USD
Million) 168
TABLE 176 Middle East & Africa Industrial Burner Market, By Type, 2015 – 2019 (USD Million)
169
TABLE 177 Middle East & Africa Industrial Burner Market, By Type, 2020 – 2026 (USD Million)
169
TABLE 178 Middle East & Africa Industrial Burner Market, By Automation, 2015 – 2019 (USD
Million) 170
TABLE 179 Middle East & Africa Industrial Burner Market, By Automation, 2020 – 2026 (USD
Million) 170
TABLE 180 Middle East & Africa Industrial Burner Market, By Fuel Type, 2015 – 2019 (USD
Million) 171
TABLE 181 Middle East & Africa Industrial Burner Market, By Fuel Type, 2020 – 2026 (USD
Million) 171
TABLE 182 Middle East & Africa Industrial Burner Market, By Operating Temperature, 2015 –
2019 (USD Million) 172
TABLE 183 Middle East & Africa Industrial Burner Market, By Operating Temperature, 2020 –
2026 (USD Million) 172
TABLE 184 Middle East & Africa Industrial Burner Market, By Application, 2015 – 2019 (USD
Million) 173
TABLE 185 Middle East & Africa Industrial Burner Market, By Application, 2020 – 2026 (USD
Million) 173
TABLE 186 Middle East Industrial Burner Market, By Type, 2015 – 2019 (USD Million) 174
TABLE 187 Middle East Industrial Burner Market, By Type, 2020 – 2026 (USD Million) 174
TABLE 188 Middle East Industrial Burner Market, By Automation, 2015 – 2019 (USD Million)
175
TABLE 189 Middle East Industrial Burner Market, By Automation, 2020 – 2026 (USD Million)
175
TABLE 190 Middle East Industrial Burner Market, By Fuel Type, 2015 – 2019 (USD Million)
176
TABLE 191 Middle East Industrial Burner Market, By Fuel Type, 2020 – 2026 (USD Million)
176
TABLE 192 Middle East Industrial Burner Market, By Operating Temperature, 2015 – 2019
(USD Million) 177
TABLE 193 Middle East Industrial Burner Market, By Operating Temperature, 2020 – 2026
(USD Million) 177
TABLE 194 Middle East Industrial Burner Market, By Application, 2015 – 2019 (USD Million)
178
TABLE 195 Middle East Industrial Burner Market, By Application, 2020 – 2026 (USD Million)
178
TABLE 196 Africa Industrial Burner Market, By Type, 2015 – 2019 (USD Million) 179
TABLE 197 Africa Industrial Burner Market, By Type, 2020 – 2026 (USD Million) 179
TABLE 198 Africa Industrial Burner Market, By Automation, 2015 – 2019 (USD Million) 180
TABLE 199 Africa Industrial Burner Market, By Automation, 2020 – 2026 (USD Million) 180
TABLE 200 Africa Industrial Burner Market, By Fuel Type, 2015 – 2019 (USD 181
TABLE 201 Million) 181
TABLE 202 Africa Industrial Burner Market, By Fuel Type, 2020 – 2026 (USD Million) 181
TABLE 203 Africa Industrial Burner Market, By Operating Temperature, 2015 – 2019 (USD
Million) 182
TABLE 204 Africa Industrial Burner Market, By Operating Temperature, 2020 – 2026 (USD
Million) 182
TABLE 205 Africa Industrial Burner Market, By Application, 2015 – 2019 (USD Million) 183
TABLE 206 Africa Industrial Burner Market, By Application, 2020 – 2026 (USD Million) 183
TABLE 207 ALZETA Corporation Basic Information, Manufacturing Base and Competitors 184
TABLE 208 ALZETA Corporation Industrial Burner Type and Applications 185
TABLE 209 Andritz AG Basic Information, Manufacturing Base and Competitors 186
TABLE 210 Andritz AG Industrial Burner Type and Applications 187
TABLE 211 Bloom Engineering Company, Inc. Basic Information, Manufacturing Base and
Competitors 188
TABLE 212 Bloom Engineering Company, Inc. Industrial Burner Type and Applications 189
TABLE 213 Forbes Marshall Basic Information, Manufacturing Base and Competitors 190
TABLE 214 Forbes Marshall Industrial Burner Type and Applications 191
TABLE 215 Limpsfield Combustion Engineering Ltd. Basic Information, Manufacturing Base
and Competitors 192
TABLE 216 Limpsfield Combustion Engineering Ltd. Industrial Burner Type and Applications
193
TABLE 217 Maxon Corporation Basic Information, Manufacturing Base and Competitors 194
TABLE 218 Maxon Corporation Industrial Burner Type and Applications 195
TABLE 219 Mitsubishi Hitachi Power Systems, Ltd. Basic Information, Manufacturing Base and
Competitors 196
TABLE 220 Mitsubishi Hitachi Power Systems, Ltd. Industrial Burner Type and Applications
197
TABLE 221 Oilon Oy Basic Information, Manufacturing Base and Competitors 198
TABLE 222 Oilon Oy Industrial Burner Type and Applications 198
TABLE 223 Osaka Gas Co., Ltd. Basic Information, Manufacturing Base and Competitors 199
TABLE 224 Osaka Gas Co., Ltd. Industrial Burner Type and Applications 200
TABLE 225 Selas Heat Technology Company Basic Information, Manufacturing Base and
Competitors 201
TABLE 226 Selas Heat Technology Company Industrial Burner Type and Applications 202
TABLE 227 Weishaupt Group Basic Information, Manufacturing Base and Competitors 203
TABLE 228 Weishaupt Group Industrial Burner Type and Applications 204

Frequently Asked Questions

What is the current size of the global industrial burners market?

The global industrial burners market was valued at USD 5.8 Billion in 2022.

What is the expected growth rate of the industrial burners market between 2023 and 2030?

The industrial burners market is expected to grow at a CAGR of 5.20% between 2023 and 2030, reaching USD 8.3 Billion in 2030.

Which segment is leading the market share in terms of type?

Dual fuel category is the leading segment by type, holding over 35% share in terms of value in 2022.

Which power rating segment governs the demand for industrial burners in the world?

The monoblock segment governs the demand for industrial burners in the world, holding a massive share of over 52% in 2022.

Which sales channel segment is expected to post the highest CAGR during the forecast period?

The power generation segment is expected to post the highest CAGR during the forecast period.

Which region is fueling the growth of the industrial burners industry?

Asia Pacific is fueling the growth of the industrial burners industry, with over one-third share in 2022.

Who are the major players in the global industrial burners market?

The top players include ANDRITZ Group, Baltur S.p.A, Bloom Engineering, Wood Group PLC (Foster Wheeler AG), Honeywell International Inc. (Maxon), Limpsfield Combustion Engineering Ltd, Mitsubishi Hitachi Power Systems, Ltd (MHPS), Oilon Group, Osaka Gas Co., Ltd, Selas Heat Technology Company.

What are the major market drivers of the industrial burners industry?

The rising demand for good, dependable, more efficient, and low-emission industrial heating devices by equipment buyers and machinery manufacturers is what is driving the industrial burner market.

What are the major market opportunities of the industrial burners industry?

Over the course of the forecast period, the development of heating technology-related technologies is also anticipated to drive the growth of the industrial hob market. Manufacturers are using combustion technology more frequently to boost heating effectiveness.

Hydraulic Pumps Market

Published:
Report ID: 7796

Mobile Robotics Market

Published:
Report ID: 8913

Lab Automation in Drug Discovery Market

Published:
Report ID: 32470

Europe Rotary Kiln Market

Published:
Report ID: 30782

Motorized Drive Rollers (MDR) Market

Published:
Report ID: 23506

Cryogenic Valves Market

Published:
Report ID: 22219

Smart Wine Cellar Market

Published:
Report ID: 22795

Rotary Kiln Market

Published:
Report ID: 10095

Raised Access Floor Market

Published:
Report ID: 21868

Carbonitriding Vacuum Furnace Market

Published:
Report ID: 21867

Headless Compression Screws Market

Published:
Report ID: 7126

U.S. Navi Lens Technology Market

Published:
Report ID: 19434

Purchase Options

$2999
Delivery Format: Excel.
$4999
Designed for the individual purchaser.
$6999
Users located at a single corporate site or regional office.
$7999
Allowed for unlimited sharing globally within one company.
Smallform of Sample request

Have a question?

User Profile

Don’t settle for less – trust Mitul to help you find the best solution.

Report delivery within 24 to 48 hours

– Other Info –

What people say?-

User Review

I am very impressed with the information in this report. The author clearly did their research when they came up with this product and it has already given me a lot of ideas.

Jana Schmidt
CEDAR CX Technologies

– Connect with us –

Phone

+91 6232 49 3207


support

24/7 Research Support


sales@credenceresearch.com

– Research Methodology –

Going beyond the basics: advanced techniques in research methodology

– Trusted By –

Pepshi, LG, Nestle
Motorola, Honeywell, Johnson and johnson
LG Chem, SIEMENS, Pfizer
Unilever, Samsonite, QIAGEN