Market Overview:
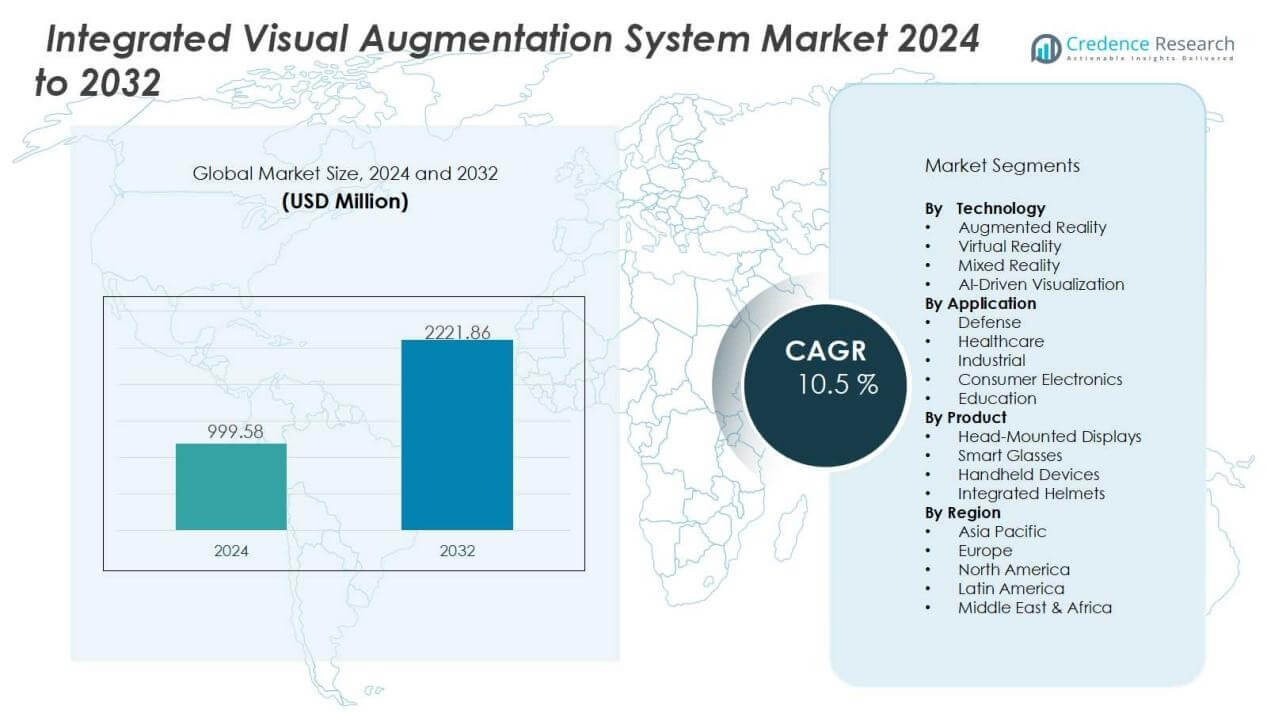
The integrated visual augmentation system market size was valued at USD 999.58 million in 2024 and is anticipated to reach USD 2221.86 million by 2032, at a CAGR of 10.5% during the forecast period.
| REPORT ATTRIBUTE | DETAILS |
|---|---|
| Historical Period | 2020-2023 |
| Base Year | 2024 |
| Forecast Period | 2025-2032 |
| Integrated Visual Augmentation System Market Size 2024 | USD 999.58 Million |
| Integrated Visual Augmentation System Market, CAGR | 10.5% |
| Integrated Visual Augmentation System Market Size 2032 | USD 2221.86 Million |
Key drivers include the growing use of AR-based solutions in defense for situational awareness and training, as well as in healthcare for surgical navigation and diagnostic imaging. Industrial applications, such as remote maintenance and assembly guidance, are gaining traction as companies invest in efficiency and accuracy. Consumer demand for immersive experiences in gaming, education, and wearable devices further accelerates market momentum. The convergence of miniaturized hardware, robust software platforms, and real-time data analytics continues to strengthen adoption.
Regionally, North America holds a leading share due to strong investments in defense modernization, healthcare innovation, and technology startups. Europe follows closely with adoption across automotive, aerospace, and medical sectors. Asia-Pacific is the fastest-growing region, driven by rapid digitization, increasing consumer electronics demand, and government initiatives promoting advanced manufacturing and smart city projects. This regional diversification ensures broad growth opportunities across industries.
 Market Insights:
- The integrated visual augmentation system market was valued at USD 999.58 million in 2024 and is projected to reach USD 2221.86 million by 2032, growing at a CAGR of 10.5%.
- AR and AI adoption in defense, healthcare, and industrial applications strengthens decision-making, safety, and operational efficiency.
- Defense remains the leading application, supported by soldier modernization programs and investments in situational awareness solutions.
- Healthcare adoption rises with usage in surgical navigation, diagnostics, and simulation-based training across hospitals and research centers.
- Consumer demand for immersive experiences in gaming, education, and wearables accelerates growth alongside industrial smart manufacturing applications.
- Challenges include high costs of deployment, technical complexity, and data privacy risks, which limit broader accessibility.
- North America led with 38% share in 2024, followed by Europe at 27% and Asia-Pacific at 24%, with Asia-Pacific being the fastest-growing region due to strong digitization and smart city initiatives.
Market Drivers:
Rising Adoption of Augmented Reality and Artificial Intelligence in Critical Applications:
The integrated visual augmentation system market benefits from the expanding use of AR and AI technologies across defense, healthcare, and industrial operations. These tools enhance situational awareness, support precision in surgical procedures, and improve efficiency in field maintenance tasks. By merging real-time data with advanced visualization, the systems enable professionals to make faster and more accurate decisions. It continues to gain traction as organizations prioritize accuracy, safety, and productivity.
- For instance, Lockheed Martin successfully integrated Red 6's augmented reality training technology with TF-50 simulators in February 2024, enabling pilots to visualize synthetic threats in real-time outdoor environments through their Airborne Tactical Augmented Reality System (ATARS).
Growing Demand from Defense and Security Sectors for Situational Awareness:
Defense agencies are investing heavily in visual augmentation solutions to improve tactical awareness and decision-making in complex environments. These systems integrate with helmets, goggles, and communication platforms to deliver real-time intelligence to soldiers and field commanders. The integrated visual augmentation system market benefits from strong procurement programs and modernization initiatives worldwide. It strengthens operational readiness while reducing risks during critical missions.
- For Instance, The U.S. Army did not award a $179 million contract to Microsoft in July 2023. At that time, improved IVAS 1.2 prototypes were delivered for testing, following prior issues with the system.
Expanding Role in Healthcare Through Enhanced Visualization and Training:
The healthcare sector is adopting visual augmentation tools to support surgical navigation, diagnostics, and medical training. Surgeons use them for improved accuracy in complex procedures, while medical institutions employ simulation-based training for skill development. The integrated visual augmentation system market sees rising adoption across hospitals, research centers, and educational institutes. It enhances clinical outcomes and supports safer, more efficient healthcare delivery.
Accelerated Consumer and Industrial Adoption Driven by Wearables and Smart Manufacturing:
Wearable devices, smart glasses, and industrial headsets are gaining popularity for their role in boosting efficiency and collaboration. Manufacturing firms employ them for assembly guidance, remote inspections, and maintenance activities, reducing downtime and error rates. The integrated visual augmentation system market expands further through consumer electronics, gaming, and education applications. It bridges the gap between digital information and physical environments, driving widespread market adoption.
Market Trends:
Integration of Miniaturized Hardware and Advanced Software Platforms Driving Product Innovation:
The integrated visual augmentation system market is shaped by the trend of combining compact hardware with advanced software ecosystems. Manufacturers are designing lightweight headsets, glasses, and portable devices that improve usability across defense, healthcare, and industrial environments. Cloud-based platforms and AI-driven analytics enhance functionality by enabling real-time decision-making and immersive visualization. It fosters innovation by creating solutions that are more mobile, durable, and capable of running complex applications. The growing alignment of hardware and software also supports interoperability with existing enterprise systems. This trend strengthens market growth by ensuring broader adoption across diverse industries.
- For Instance, Vuzix Corporation's Ultralite Pro Smart Glasses platform was recognized as a finalist for the Auggie Awards, following its debut as a reference design at CES 2025. The Ultralite OEM platform, which can be adapted by partners for specific products, weighs approximately 38 grams and is designed to operate with company-specific enterprise applications for field workers.
Expansion of Use Cases Across Consumer, Commercial, and Industrial Applications:
Demand for visual augmentation systems is rising in consumer sectors such as gaming, education, and entertainment, where immersive experiences are highly valued. Industrial adoption is expanding with applications in predictive maintenance, assembly training, and remote collaboration. Healthcare continues to integrate these solutions to advance medical imaging and surgical accuracy. The integrated visual augmentation system market benefits from a growing variety of use cases that extend beyond traditional defense and aerospace sectors. It supports organizations in achieving efficiency, accuracy, and cost savings while enhancing user engagement. This diversification of applications reinforces long-term sustainability and creates pathways for continuous innovation.
- For Instance, Mixed-reality technologies, including high-fidelity headsets like the Varjo XR-4, are being explored for applications in medical fields such as surgical training and 3D medical imaging visualization.
Market Challenges Analysis:
High Costs of Deployment and Limited Accessibility Across End-User Segments:
The integrated visual augmentation system market faces a key challenge in the form of high development and deployment costs. Advanced sensors, AI-enabled platforms, and custom hardware raise production expenses, limiting affordability for small enterprises and consumer users. It often restricts adoption to defense, large healthcare institutions, and industrial leaders with significant budgets. The lack of cost-effective solutions slows penetration in education, retail, and mid-sized organizations. This challenge emphasizes the need for scalable designs and modular systems to improve accessibility across wider user groups.
Technical Complexity, Data Privacy Concerns, and Infrastructure Limitations:
Integration with existing enterprise systems demands high technical expertise, creating barriers for many organizations. Real-time data processing requires reliable connectivity and advanced infrastructure, which remain inconsistent in emerging regions. Privacy and cybersecurity risks add further concerns, especially in defense and healthcare applications. The integrated visual augmentation system market must address these limitations through secure platforms, standardization, and global regulatory compliance. It also depends on stronger investments in network infrastructure to ensure seamless adoption. Addressing these barriers is essential to unlock the full potential of visual augmentation systems across industries.
Market Opportunities:
Expansion into Consumer and Commercial Applications Through Wearables and Smart Devices:
The integrated visual augmentation system market presents strong opportunities through the growing adoption of consumer wearables and smart devices. Demand for immersive experiences in gaming, education, and entertainment continues to expand, creating new revenue streams. Enterprises in retail and logistics are also exploring visual augmentation to improve customer engagement and operational accuracy. It drives opportunities for manufacturers to design lightweight, affordable, and user-friendly solutions tailored for mass-market adoption. Collaboration with consumer electronics brands can further accelerate product reach and brand visibility. This segment offers a pathway to balance demand across both professional and consumer markets.
Emerging Potential Across Healthcare, Industrial Automation, and Smart Cities:
Healthcare provides a significant opportunity with rising use of augmented visualization in diagnostics, surgical procedures, and medical training. Industrial automation benefits from improved assembly, predictive maintenance, and workforce training solutions. The integrated visual augmentation system market is also set to gain from government investments in smart city initiatives, where real-time data visualization supports safety and infrastructure management. It creates possibilities for cross-sector adoption, supported by 5G connectivity and AI integration. Partnerships with technology providers and infrastructure developers can enhance solution scalability. These opportunities position the market for long-term expansion across diverse industries.
Market Segmentation Analysis:
By Product:
The integrated visual augmentation system market by product is segmented into head-mounted displays, smart glasses, handheld devices, and integrated helmets. Head-mounted displays dominate due to strong demand in defense and healthcare applications, offering immersive visualization and real-time data integration. Smart glasses are gaining traction in industrial and commercial sectors for assembly, inspection, and training. Handheld devices remain popular for field maintenance and education, while integrated helmets see wide adoption in military and aerospace sectors. It continues to evolve as manufacturers invest in compact, durable, and user-friendly designs.
- For instance, Microsoft's HoloLens 2 is a significant technological advancement over its predecessor, utilizing an integrated time-of-flight (ToF) depth sensor for hand and environment tracking. Its display, based on "2k 3:2 light engines," achieves a resolution of 1440×936 pixels per eye.
By Application:
Applications span defense, healthcare, industrial, consumer electronics, and education. Defense leads the segment with strong focus on battlefield awareness, soldier training, and tactical decision-making. Healthcare increasingly integrates these systems in surgery, diagnostics, and simulation-based learning. Industrial adoption grows with predictive maintenance, workforce collaboration, and remote monitoring. Consumer electronics and education follow with strong demand for immersive experiences and skill-based learning. The integrated visual augmentation system market gains from this diverse application base.
- For instance, Anduril Industries took over Microsoft's $22 billion U.S. Army Integrated Visual Augmentation System (IVAS) program in February 2025, with the system designed to enhance situational awareness through night vision, thermal sensors, and augmented reality capabilities integrated into helmet-mounted displays weighing 3.4 pounds.
By Technology:
Key technologies include augmented reality, virtual reality, mixed reality, and AI-driven visualization. Augmented reality leads due to its compatibility with defense, healthcare, and industrial operations. Virtual reality is used in training, simulation, and education. Mixed reality finds growing relevance in manufacturing and design. AI-driven visualization enhances accuracy, personalization, and predictive insights. It strengthens adoption by aligning advanced technologies with user needs.
Segmentations:
By Product:
- Head-Mounted Displays
- Smart Glasses
- Handheld Devices
- Integrated Helmets
By Application:
- Defense
- Healthcare
- Industrial
- Consumer Electronics
- Education
By Technology:
- Augmented Reality
- Virtual Reality
- Mixed Reality
- AI-Driven Visualization
By Region:
- North America
- U.S.
- Canada
- Mexico
- Europe
- UK
- France
- Germany
- Italy
- Spain
- Russia
- Belgium
- Netherlands
- Austria
- Sweden
- Poland
- Denmark
- Switzerland
- Rest of Europe
- Asia Pacific
- China
- Japan
- South Korea
- India
- Australia
- Thailand
- Indonesia
- Vietnam
- Malaysia
- Philippines
- Taiwan
- Rest of Asia Pacific
- Latin America
- Brazil
- Argentina
- Peru
- Chile
- Colombia
- Rest of Latin America
- Middle East
- UAE
- KSA
- Israel
- Turkey
- Iran
- Rest of Middle East
- Africa
- Egypt
- Nigeria
- Algeria
- Morocco
- Rest of Africa
Regional Analysis:
North America:
North America accounted for 38% market share in 2024, supported by heavy spending in defense and healthcare. The region benefits from strong government programs in the U.S. focused on soldier modernization and battlefield technologies. Healthcare institutions adopt visual augmentation for surgical guidance, diagnostic imaging, and medical training. It also gains momentum from technology startups and established players offering AR-based enterprise solutions. High penetration of advanced infrastructure and reliable connectivity strengthens adoption across industries. Partnerships between defense contractors, healthcare providers, and technology firms further drive regional growth.
Europe:
Europe held 27% market share in 2024, driven by industrial, aerospace, and automotive applications. The region focuses on leveraging visual augmentation for assembly guidance, workforce training, and predictive maintenance. Healthcare adoption remains steady with hospitals integrating visualization tools into surgery and diagnostics. The integrated visual augmentation system market in Europe also benefits from aerospace innovations supporting pilot training and navigation. It expands further with the adoption of digital twins and smart manufacturing practices. Regional manufacturers invest in partnerships and R&D to enhance product usability and expand market presence.
Asia-Pacific:
Asia-Pacific recorded 24% market share in 2024, fueled by rapid industrialization and consumer electronics demand. Governments in China, Japan, and South Korea support smart city projects and defense modernization. It sees high adoption of wearable devices in gaming, education, and retail sectors. Healthcare providers adopt visual augmentation for training programs and advanced treatment procedures. Industrial users integrate the technology to improve accuracy and reduce downtime in large-scale operations. Strong investments in 5G infrastructure and AI integration accelerate future opportunities across the region.
Key Player Analysis:
- Rockwell Collins
- Lockheed Martin
- L3Harris Technologies
- Honeywell
- Northrop Grumman
- BAE Systems
- Raytheon Technologies
- FLIR Systems
- Elbit Systems
- Thales Group
Competitive Analysis:
The integrated visual augmentation system market is highly competitive, with strong participation from global defense and technology leaders. Key players include Rockwell Collins, Lockheed Martin, L3Harris Technologies, Honeywell, Northrop Grumman, and BAE Systems. These companies focus on advancing product design, integrating AI, and ensuring seamless connectivity across diverse applications. It emphasizes innovation in head-mounted displays, smart glasses, and helmet-mounted systems to meet the needs of defense, healthcare, and industrial users. Strategic partnerships with governments, defense agencies, and commercial enterprises strengthen market presence and drive adoption. Companies invest heavily in R&D to enhance durability, user comfort, and system interoperability. Competition also centers on cybersecurity, ensuring safe handling of sensitive data across defense and medical applications. The market landscape remains dynamic, with firms expanding global reach through joint ventures, mergers, and long-term procurement contracts that enhance their position in critical growth regions.
Recent Developments:
- In April 2025, Lockheed Martin revealed its acquisition of the Rapid Solutions business of Amentum to expand its ISR and tactical systems capability.
- In September 2025, L3Harris Technologies received a multi-year Javelin solid rocket motor contract valued up to $292 million, the largest ever for the program.
Report Coverage:
The research report offers an in-depth analysis based on Product, Application, Technology and Region. It details leading Market players, providing an overview of their business, product offerings, investments, revenue streams, and key applications. Additionally, the report includes insights into the competitive environment, SWOT analysis, current Market trends, as well as the primary drivers and constraints. Furthermore, it discusses various factors that have driven Market expansion in recent years. The report also explores Market dynamics, regulatory scenarios, and technological advancements that are shaping the industry. It assesses the impact of external factors and global economic changes on Market growth. Lastly, it provides strategic recommendations for new entrants and established companies to navigate the complexities of the Market.
Future Outlook:
- Defense modernization programs will continue to drive large-scale adoption of integrated visual augmentation systems across global militaries.
- Healthcare will emerge as one of the fastest-growing application areas, with hospitals integrating augmented visualization for surgeries and diagnostics.
- Industrial automation will expand usage of visual augmentation to improve assembly, reduce downtime, and enhance workforce training.
- Consumer electronics will play a vital role, as wearables and gaming devices adopt immersive visualization technologies.
- Integration with 5G and AI platforms will enable real-time data processing and seamless connectivity across industries.
- Enterprises will focus on improving cost efficiency by developing modular, lightweight, and scalable solutions for broader adoption.
- Cybersecurity and data protection will remain critical, prompting manufacturers to invest in secure platforms and compliance frameworks.
- Smart city projects worldwide will create opportunities for visual augmentation in traffic management, infrastructure monitoring, and public safety.
- Collaborations between technology providers, healthcare institutions, and industrial leaders will accelerate product development and innovation.
- The integrated visual augmentation system market will evolve into a multi-industry ecosystem, offering long-term opportunities across defense, healthcare, industrial, and consumer domains.

Request a Free Sample
Fill in your details and we'll send you a free sample report.
- Sample data tables & charts
- Research methodology
Market Dynamics
Adoption of AR and AI in Defense and Security
Defense agencies are increasingly integrating AR and AI-powered visual augmentation systems to enhance situational awareness, tactical decision-making, and soldier training, driving significant procurement and modernization initiatives worldwide.
Healthcare Visualization and Training
Hospitals and research centers are adopting integrated visual augmentation systems for surgical navigation, diagnostics, and simulation-based training, improving clinical outcomes and supporting safer, more efficient healthcare delivery.
Industrial Efficiency and Smart Manufacturing
Manufacturing and industrial sectors are leveraging visual augmentation for assembly guidance, remote maintenance, and workforce training, which reduces downtime, increases accuracy, and boosts operational efficiency.
Consumer Demand for Immersive Experiences
Rising interest in immersive gaming, education, and wearable devices is accelerating the adoption of visual augmentation systems in the consumer electronics sector, expanding the market beyond traditional defense and industrial applications.
Technological Advancements in Miniaturized Hardware and Software
The convergence of lightweight, durable hardware with robust software platforms and real-time analytics is making integrated visual augmentation systems more accessible and functional, supporting broader adoption across multiple industries.
Need a Custom Version of This Report?
Tailor the scope, geography, or segments to your exact requirements.
- Custom geography or segment scope
- Direct access to our analyst team
Frequently Asked Questions
What is the current market size for the Integrated Visual Augmentation System Market, and what is its projected size in 2032?
At what Compound Annual Growth Rate is the Integrated Visual Augmentation System Market prjected to grow between 2024 and 2032?
Which Integrated Visual Augmentation System Market segment held the largest share in 2024?
What are the primary factors fueling the growth of the Integrated Visual Augmentation System Market?
Who are the leading companies in the Integrated Visual Augmentation System Market?
Which region commanded the largest share of the Integrated Visual Augmentation System Market in 2024?
Table of Content
Chapter 1 Market Segmentation
- 1.1 Segmentation Framework
- 1.1.1 Product and Service Classification
- 1.1.2 Application and End-Use Classification
- 1.1.3 Technology and Solution Classification
- 1.1.4 Customer and Distribution Channel Classification
- 1.1.5 Geographic Segmentation
- 1.1.6 Market Segment Definitions and Boundaries
- 1.2 By Product
- 1.2.1 Head-Mounted Displays
- 1.2.2 Smart Glasses
- 1.2.3 Handheld Devices
- 1.2.4 Integrated Helmets
- 1.3 By Technology
- 1.3.1 Augmented Reality
- 1.3.2 Virtual Reality
- 1.3.3 Mixed Reality
- 1.3.4 AI-Driven Visualization
- 1.4 By Application
- 1.4.1 Defense
- 1.4.2 Healthcare
- 1.4.3 Industrial
- 1.4.4 Consumer Electronics
- 1.4.5 Education
Chapter 2 Introduction
- 2.1 Report Objectives and Scope
- 2.2 Product Definition and Industry Terminology
- 2.3 Market Inclusions and Exclusions
- 2.4 Research Process
- 2.4.1 Primary Research and Expert Interviews
- 2.4.2 Secondary Research and Source Review
- 2.4.3 Top-Down and Bottom-Up Estimation
- 2.4.4 Data Triangulation and Verification
- 2.5 Market Size Measurement Basis
- 2.5.1 2024: USD 999.58 million → 2032: USD 2221.86 million
- 2.6 Historical and Forecast Reference Periods
- 2.6.1 Base Year: 2024
- 2.6.2 Forecast Period: 2024-2032
- 2.7 Research Assumptions and Limitations
Chapter 3 Executive Summary
- 3.1 Market Snapshot and Key Findings
- 3.2 Base-Year Market Size, 2024
- 3.3 Forecast Market Size, 2032
- 3.4 Revenue and Volume Growth Outlook
- 3.5 Key Demand and Supply Indicators
- 3.6 Leading Market Segments
- 3.7 Fastest-Growing Market Opportunities
- 3.8 Regional Performance Highlights
- 3.9 Technology and Industry Transformation
- 3.10 Competitive Landscape Summary
- 3.11 Analyst View and Strategic Implications
Chapter 4 Global Integrated Visual Augmentation System Market Trends and Developments
- 4.1 Historical Industry Development
- 4.2 Recent Market Trends and Developments
- 4.3 Demand and Customer Behavior Trends
- 4.4 Technology and Product Innovation
- 4.5 Artificial Intelligence, Automation and Digitalization
- 4.6 Local Manufacturing and Supply Chain Realignment
- 4.7 Industry Partnerships, Mergers and Acquisitions
- 4.8 Sustainability and Circular Economy Developments
- 4.9 Government and Private Sector Investment Trends
- 4.10 Emerging Business Models and Commercialization
- 4.11 Industry Developments and Announcements
Chapter 5 Global Integrated Visual Augmentation System Market Production, Supply and Demand Analysis
- 5.1 Demand Trend and Consumption Analysis
- 5.2 Demand Forecast, 2024-2032
- 5.3 Production and Output Trend
- 5.4 Production and Output Forecast, 2024-2032
- 5.5 Installed Capacity and Capacity Utilization
- 5.6 Company-Wise Production Plants and Statistics
- 5.6.1 Installed Production Capacity
- 5.6.2 Actual Production
- 5.6.3 Planned Capacity and Expansion Targets
- 5.7 Supply Chain Structure and Procurement Trends
- 5.8 Supply-Demand Gap and Bottlenecks
- 5.9 Import Dependence and Sourcing Structure
- 5.10 Contract Manufacturing and Outsourcing
- 5.11 Regional Supply and Demand Concentration
Chapter 6 Global Integrated Visual Augmentation System Market Pricing Analysis
- 6.1 Pricing Structure and Measurement
- 6.2 Historical Pricing Trends
- 6.3 Pricing Outlook, 2024-2032
- 6.4 Average Selling Price and Unit Economics
- 6.5 Pricing by Product and Market Segment
- 6.6 Geographic Pricing Differences
- 6.7 Key Input, Energy, Labor and Logistics Costs
- 6.8 Contract Pricing and Purchasing Models
- 6.9 Pricing Sensitivity and Competitive Positioning
- 6.10 Price, Margin and Profitability Implications
Chapter 7 Global Integrated Visual Augmentation System Market Dynamics
- 7.1 Market Growth Drivers
- 7.1.1 Demand-Side Drivers
- 7.1.2 Technology and Innovation Drivers
- 7.1.3 Infrastructure and Investment Drivers
- 7.1.4 Regulatory and Policy Drivers
- 7.2 Market Restraints
- 7.2.1 Cost and Affordability Constraints
- 7.2.2 Technology and Adoption Barriers
- 7.2.3 Supply Chain and Operational Constraints
- 7.3 Market Challenges
- 7.3.1 Competitive Pressure and Margin Erosion
- 7.3.2 Skills, Infrastructure and Implementation Gaps
- 7.4 Emerging Market Opportunities
- 7.5 Market Dynamics Impact and Time-Horizon Assessment
Chapter 8 Global Integrated Visual Augmentation System Value Chain Analysis
- 8.1 Industry Value Chain Overview
- 8.2 Upstream Suppliers and Critical Inputs
- 8.3 Technology and Component Providers
- 8.4 Manufacturing or Service Delivery
- 8.5 Distribution, Channel Partners and Integrators
- 8.6 Downstream Applications and End Users
- 8.7 Value Addition and Profit Pools
- 8.8 Vertical Integration and Outsourcing
- 8.9 Supplier Concentration and Risk
- 8.10 Supply Chain Localization and Resilience
Chapter 9 Global Integrated Visual Augmentation System Market Regulations and Policies
- 9.1 Relevant Laws, Standards and Compliance Frameworks
- 9.2 Product, Service, Safety and Quality Requirements
- 9.3 Government Policies, Incentives and Subsidies
- 9.4 Imports, Exports and Trade Barriers
- 9.5 Public Procurement and Local Content Requirements
- 9.6 Environmental and Sustainability Compliance
- 9.7 Upcoming Policy Changes and Market Implications
Chapter 10 Global Integrated Visual Augmentation System Market Hotspots and Opportunities
- 10.1 Market Opportunity Mapping and Growth Hotspots
- 10.2 High-Growth Applications and Customer Groups
- 10.3 Underserved Markets and White-Space Opportunities
- 10.4 Emerging Technology and Product Opportunities
- 10.5 New Capacity and Investment Hotspots
- 10.6 Market Entry and Expansion Opportunities
- 10.7 Distribution and Partnership Opportunities
- 10.8 Near-Term and Long-Term Commercial Potential
- 10.9 Opportunity Attractiveness and Execution Risks
Chapter 11 Global Integrated Visual Augmentation System Market Outlook, 2024-2032
- 11.1 Market Size and Analysis
- 11.1.1 Revenue (Market Measurement: 2024: USD 999.58 million → 2032: USD 2221.86 million)
- 11.1.2 Market Volume and Quantity Sold
- 11.1.3 Historical Market Size
- 11.1.4 Base-Year Market Size, 2024
- 11.2 Market Forecast, 2024-2032
- 11.2.1 Revenue Forecast to 2032
- 11.2.2 Volume Forecast to 2032
- 11.2.3 CAGR and Year-on-Year Growth
- 11.2.4 Incremental Revenue Opportunity
- 11.3 Forecast Assumptions and Scenario Analysis
- 11.3.1 Base-Case Forecast
- 11.3.2 Optimistic and Conservative Scenarios
- 11.3.3 Technology, Pricing and Policy Sensitivities
- 11.4 Market Attractiveness and Growth Outlook
Chapter 12 Global Integrated Visual Augmentation System Market Segmentation and Outlook
- 12.1 Segmentation Summary and Market Shares, 2024
- 12.2 Largest and Fastest-Growing Segments
- 12.3 By Product - Market Size and Forecast, 2024-2032
- 12.3.1 Segment Definition and Scope
- 12.3.2 Historical Market Size
- 12.3.3 Revenue Forecast, 2024-2032
- 12.3.4 Volume Forecast, 2024-2032
- 12.3.5 Base-Year Market Share, 2024
- 12.3.6 Segment CAGR and Growth Drivers
- 12.3.7 Subsegment Market Size and Forecast
- 12.3.7.1 Head-Mounted Displays
- 12.3.7.2 Smart Glasses
- 12.3.7.3 Handheld Devices
- 12.3.7.4 Integrated Helmets
- 12.3.8 Subsegment Pricing and Adoption Trends
- 12.3.9 Leading Suppliers and Competition
- 12.3.10 Regional Demand and Opportunities
- 12.4 By Technology - Market Size and Forecast, 2024-2032
- 12.4.1 Segment Definition and Scope
- 12.4.2 Historical Market Size
- 12.4.3 Revenue Forecast, 2024-2032
- 12.4.4 Volume Forecast, 2024-2032
- 12.4.5 Base-Year Market Share, 2024
- 12.4.6 Segment CAGR and Growth Drivers
- 12.4.7 Subsegment Market Size and Forecast
- 12.4.7.1 Augmented Reality
- 12.4.7.2 Virtual Reality
- 12.4.7.3 Mixed Reality
- 12.4.7.4 AI-Driven Visualization
- 12.4.8 Subsegment Pricing and Adoption Trends
- 12.4.9 Leading Suppliers and Competition
- 12.4.10 Regional Demand and Opportunities
- 12.5 By Application - Market Size and Forecast, 2024-2032
- 12.5.1 Segment Definition and Scope
- 12.5.2 Historical Market Size
- 12.5.3 Revenue Forecast, 2024-2032
- 12.5.4 Volume Forecast, 2024-2032
- 12.5.5 Base-Year Market Share, 2024
- 12.5.6 Segment CAGR and Growth Drivers
- 12.5.7 Subsegment Market Size and Forecast
- 12.5.7.1 Defense
- 12.5.7.2 Healthcare
- 12.5.7.3 Industrial
- 12.5.7.4 Consumer Electronics
- 12.5.7.5 Education
- 12.5.8 Subsegment Pricing and Adoption Trends
- 12.5.9 Leading Suppliers and Competition
- 12.5.10 Regional Demand and Opportunities
- 12.6 Segment Growth Comparison
- 12.7 Segment Attractiveness and Priority Matrix
Chapter 13 Global Integrated Visual Augmentation System End-Use and Application Market Outlook
- 13.1 End-Use Industry and Customer Demand Structure
- 13.2 Leading Applications and Customer Groups
- 13.3 End-Use Market Size, Share and Forecast
- 13.4 Major End-Use Industry Deep Dives
- 13.4.1 Customer Requirements and Use Cases
- 13.4.2 Demand and Replacement Cycles
- 13.4.3 Technical and Regulatory Considerations
- 13.4.4 Purchasing and Procurement Models
- 13.4.5 Leading Vendors and Distribution Channels
- 13.4.6 Forecast and Commercial Opportunities
- 13.5 Emerging Applications and Cross-Segment Demand
- 13.6 End-Use Industry Investment Priorities
Chapter 14 Global Integrated Visual Augmentation System Geographic Market Outlook, 2024-2032
- 14.1 Regional Market Size and Share, 2024
- 14.2 Regional Market Forecast, 2024-2032
- 14.3 Regional Pricing, Production and Demand Differences
- 14.4 North America
- 14.4.1 United States
- 14.4.2 Canada
- 14.4.3 Mexico
- 14.5 Europe
- 14.5.1 Germany
- 14.5.2 France
- 14.5.3 Italy
- 14.5.4 United Kingdom
- 14.5.5 Spain
- 14.5.6 Poland
- 14.5.7 Russia
- 14.5.8 Netherlands
- 14.5.9 Belgium
- 14.5.10 Sweden
- 14.5.11 Denmark
- 14.5.12 Norway
- 14.5.13 Rest of Europe
- 14.6 Asia Pacific
- 14.6.1 China
- 14.6.2 India
- 14.6.3 Japan
- 14.6.4 South Korea
- 14.6.5 Thailand
- 14.6.6 Indonesia
- 14.6.7 Vietnam
- 14.6.8 Malaysia
- 14.6.9 Australia
- 14.6.10 Rest of Asia Pacific
- 14.7 Latin America
- 14.7.1 Brazil
- 14.7.2 Argentina
- 14.7.3 Colombia
- 14.7.4 Chile
- 14.7.5 Rest of Latin America
- 14.8 Middle East
- 14.8.1 Saudi Arabia
- 14.8.2 United Arab Emirates
- 14.8.3 Turkey
- 14.8.4 Israel
- 14.8.5 Iran
- 14.8.6 Rest of the Middle East
- 14.9 Africa
- 14.9.1 South Africa
- 14.9.2 Egypt
- 14.9.3 Nigeria
- 14.9.4 Morocco
- 14.9.5 Rest of Africa
- 14.10 Regional Investment, Policy and Supply Chain Differences
- 14.11 Regional Competitive Landscape
- 14.12 Geographic Growth Hotspots
Chapter 15 Global Integrated Visual Augmentation System Technology, Innovation and Sustainability Outlook
- 15.1 Technology Landscape and Maturity
- 15.2 Product, Process and Service Innovation
- 15.3 AI, Automation and Digital Tools in the Industry
- 15.4 Technology Adoption and Performance Benchmarking
- 15.5 Innovation Pipeline and R&D Investment
- 15.6 Patent and Intellectual Property Trends
- 15.7 Energy Efficiency and Resource Management
- 15.8 Sustainability, Recycling and Circularity
- 15.9 Technology Roadmap, 2024-2032
- 15.10 Risks of Obsolescence and Technology Substitution
Chapter 16 Global Integrated Visual Augmentation System Market Key Strategic Imperatives
- 16.1 Growth and Market Entry Priorities
- 16.2 High-Return Products and Segments
- 16.3 Pricing, Profitability and Cost Optimization
- 16.4 Technology Investment and Product Differentiation
- 16.5 Supply Chain Localization and Resilience
- 16.6 Distribution and Customer Acquisition
- 16.7 Partnership, Acquisition and Capacity Strategy
- 16.8 Regional Expansion Priorities
- 16.9 Short-, Medium- and Long-Term Actions
Chapter 17 Competition Outlook
- 17.1 Industry Competition Characteristics
- 17.2 Market Structure and Concentration
- 17.3 Market Share and Competitive Positioning, 2024
- 17.4 Company-Wise Revenue and Product Benchmarking
- 17.5 Production and Service Capacity Benchmarking
- 17.6 Technology, Pricing and Differentiation
- 17.7 Regional Footprint and Distribution Strength
- 17.8 Mergers, Acquisitions and Strategic Alliances
- 17.9 New Entrants and Competitive Threats
- 17.10 Porter's Five Forces and Industry Attractiveness
- 17.11 Competitive Outlook, 2024-2032
Chapter 18 Company Profiles
- 18.1 Company Coverage and Selection Criteria
- 18.2 Rockwell Collins
- 18.2.1 Business Description
- 18.2.2 Company Ownership and Geographic Presence
- 18.2.3 Product and Service Portfolio
- 18.2.4 Manufacturing and Operating Footprint
- 18.2.5 Production Capacity and Expansion Plans
- 18.2.6 Financial Performance and Investment
- 18.2.7 Market Share and Competitive Position
- 18.2.8 Technology and Innovation Capabilities
- 18.2.9 Strategic Alliances or Partnerships
- 18.2.10 Recent Developments
- 18.2.11 Growth Strategy and Outlook
- 18.3 Lockheed Martin
- 18.4 L3Harris Technologies
- 18.5 Honeywell
- 18.6 Northrop Grumman
- 18.7 BAE Systems
- 18.8 Raytheon Technologies
- 18.9 FLIR Systems
- 18.10 Elbit Systems
- 18.11 Thales Group
- 18.12 Other Relevant Market Participants
Note: Every listed company is profiled on the structure shown under the first company. The company list is preliminary and may change based on research findings, market developments, data availability and client requirements.
Chapter 19 Disclaimer
- 19.1 Research and Forecast Disclaimer
- 19.2 Data Source and Estimation Limitations
Note: The depth of individual sections depends on data availability for this market. Volume, capacity, trade and other unit-based metrics are included where applicable.