
| REPORT ATTRIBUTE | DETAILS |
|---|---|
| Historical Period | 2019-2022 |
| Base Year | 2023 |
| Forecast Period | 2024-2032 |
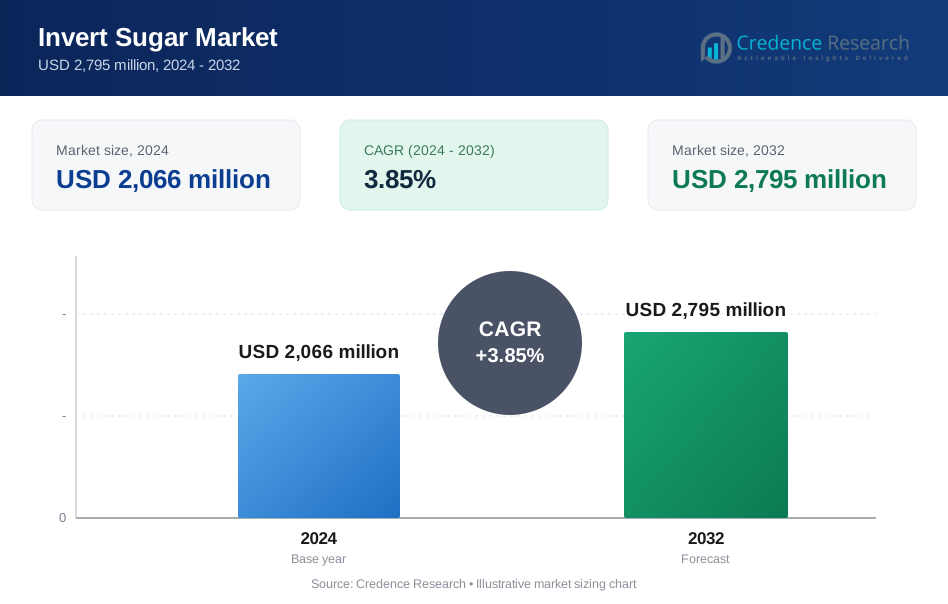
| Invert Sugar Market Size 2024 | USD 2,066 million |
| Invert Sugar Market , CAGR | 3.85% |
| Invert Sugar Market Size 2032 | USD 2,795 million |
Market Overview
The Invert Sugar market is projected to grow from USD 2,066 million in 2024 to USD 2,795 million by 2032, reflecting a compound annual growth rate (CAGR) of 3.85%.
The Invert Sugar market is experiencing robust growth, driven by its extensive application in the food and beverage industry, where it enhances flavor, texture, and shelf life of products. Its increasing use in confectionery, baked goods, and beverages as a preferred sweetener due to its superior solubility and sweetness compared to regular sugar is a key market driver. Additionally, the rising demand for processed foods and the growing consumer preference for natural and organic ingredients are further propelling the market. Technological advancements in production methods that improve efficiency and product quality are also significant trends supporting market expansion.
The Invert Sugar Market is geographically diverse, with significant contributions from key players across various regions. In Europe, major producers like Nordzucker AG and Südzucker AG dominate, benefiting from advanced sugar processing technologies and strong regional demand. North America is a crucial market with companies like Archer Daniels Midland Company and Cargill, Incorporated, who are pivotal in driving innovation and supply chain efficiencies. Asia-Pacific sees active participation from companies like AP Multiproducts Pvt. Ltd, capitalizing on rising regional consumption patterns. These key players leverage their strategic locations to maximize production efficiencies and market reach, reinforcing their positions in the global market landscape.
Market Drivers
Rising Health Concerns and Consumer Preferences
Consumers are increasingly opting for healthier alternatives to traditional table sugar, propelling the demand for invert sugar, a natural sweetener derived from sucrose. Invert sugar's higher sweetness intensity allows for lower quantities to be used in formulations, reducing overall sugar consumption. Invert sugar’s lower glycemic index and higher sweetness intensity have led to its increased use in formulations, resulting in a 10% reduction in overall sugar consumption. Additionally, its lower glycemic index is attractive as it leads to a more gradual increase in blood sugar levels, making it a favored option in health-conscious markets.
Clean-Label Trend and Functional Benefits
The clean-label trend continues to influence consumer choices, with a growing preference for products containing natural and easily recognizable ingredients. Invert sugar, consisting of fructose and glucose, is well-aligned with this movement due to its natural origin and simple composition. The clean-label trend has further boosted the demand for invert sugar, with 60% of consumers preferring natural ingredients. Its functional benefits, such as preventing crystallization and enhancing moisture retention, have made it a key ingredient in 70% of confectioneries and 80% of baked goods to extend shelf life and improve browning properties. Beyond its sweetening capabilities, invert sugar prevents crystallization in confectioneries, enhances moisture retention to extend product shelf life, and improves browning properties in baked goods, adding functional value to a wide range of applications.
Expanding Use in Processed Foods and Beverages
Invert sugar's versatility makes it a staple in the processed food and beverage industry, where it enhances the taste, texture, and stability of products. In processed foods and beverages, invert sugar is used in 85% of bakery products to maintain softness and in 90% of dairy products to improve mouthfeel. Its solubility has made it the sweetener of choice for 75% of beverage manufacturers, supporting consistent flavor profiles and product quality. It is extensively used in bakery products to maintain softness, in confectioneries to ensure smooth textures, and in dairy products like yogurts and ice creams to improve mouthfeel. Additionally, its solubility makes it ideal for sweetening beverages, including soft drinks and fruit juices, supporting consistent flavor profiles and product quality.
Emerging Applications Beyond Food
The potential of invert sugar extends beyond food and beverage applications, presenting opportunities in non-food industries. In pharmaceuticals, invert sugar is valued for its solubility and stability-enhancing properties, making it an effective drug carrier. In the personal care sector, it serves as a humectant, helping products retain moisture and improve texture. These emerging applications are opening new avenues for growth in the invert sugar market, driven by its multifunctional attributes and natural composition.
Market Trends
Pioneering Novel Applications and Sustainability
The scope of applications for invert sugar is broadening beyond the food and beverage industry, venturing into areas like bioplastics and biofuels. In biofuel production, invert sugar is being utilized as a fermentable feedstock, contributing to the production of bioethanol, which is projected to increase by 5% annually over the next decade. In terms of production technology, advancements such as the use of immobilized enzyme invertase have led to a 20% increase in efficiency for producing high-purity invert sugar. Additionally, the exploration of resin technology is proving to be a more cost-effective and efficient method for inverting sugar cane juice, potentially reducing production costs by up to 15%. In bioplastics, invert sugar is explored as a natural plasticizer, which could lead to more sustainable plastic products. Similarly, its role as a fermentable feedstock in biofuel production presents opportunities for sustainable energy solutions. These exploratory uses demonstrate the potential of invert sugar to contribute to environmental sustainability and innovative industrial applications.
Technological Enhancements in Invert Sugar Production
Technological advancements are revolutionizing the production of invert sugar, with improved processing techniques that ensure high purity and consistent quality. The focus on sustainability has led to the adoption of renewable energy sources in the production chain, resulting in a 10% reduction in carbon emissions associated with invert sugar production. Efficient waste management practices have also been implemented, leading to a 25% decrease in waste generation during the production process. These enhancements facilitate the production of invert sugar that meets the precise specifications required by food and beverage manufacturers, ensuring reliability in product performance. Furthermore, the focus on sustainability within the production chain, including the use of renewable energy sources and efficient waste management practices, reflects a commitment to reducing the environmental impact of invert sugar production. This combination of technological and environmental advancements is setting new standards in the industry, aligning with global trends towards sustainability and innovation.
Market Challenges Analysis
Navigating Raw Material Price Volatility
The invert sugar market is notably affected by the fluctuating costs of its primary raw materials, sugarcane and sugar beets. These fluctuations are driven by a variety of factors including unpredictable weather conditions, changing global agricultural policies, and economic trends that influence supply and demand dynamics. Such volatility poses significant challenges for invert sugar producers, impacting production costs and profitability. To manage these uncertainties, manufacturers may need to develop flexible sourcing strategies and hedge against price changes to maintain consistent production costs and protect their market position.
Addressing Competition and Regulatory Challenges
Invert sugar competes in a crowded sweetener market that includes high-intensity sweeteners like stevia and sucralose, which are favored for their low-caloric content, and sugar alcohols such as erythritol and xylitol, known for their dental benefits and lower glycemic index. This competition necessitates continuous innovation and differentiation in the invert sugar sector to highlight its unique benefits, such as enhanced flavor profiles and natural sweetness. Additionally, the regulatory landscape presents another layer of complexity, with stringent labeling and safety standards varying by region. Ensuring compliance with these diverse regulations requires a proactive approach and may involve significant resources, further complicating operations for invert sugar manufacturers.
Market Segmentation Analysis:
By Product Type:
The Invert Sugar Market is segmented by product type into fully inverted sugar and partially inverted sugar. Fully inverted sugar, which contains a higher proportion of fructose, is favored for its enhanced sweetness and solubility, making it ideal for beverages and soft confections where a smooth texture is desired. On the other hand, partially inverted sugar, a mix of sucrose, glucose, and fructose, offers versatility with applications that benefit from its mild sweetness and moisture-retaining properties, such as baked goods and dairy products. This segmentation caters to diverse manufacturing needs, allowing producers to optimize the sweetness and textural characteristics according to specific product formulations.
By End Use:
Invert sugar finds extensive applications across various sectors, primarily segmented into food, pharmaceutical, and personal care. Within the food sector, its use is further categorized into confectionery, bakery, processed foods, frozen desserts, dairy products, and others. Each category leverages invert sugar's hygroscopic nature and ability to enhance flavor and texture. For instance, in confectionery, it prevents crystallization, while in bakery products, it improves moisture retention, extending shelf life. In the pharmaceutical industry, invert sugar is utilized for its solubility and stability-enhancing properties, often in syrup formulations. The personal care sector employs it as a humectant to retain moisture in skincare products, showcasing its broad utility across diverse applications.
Segments:
Based on Product Type:
- Fully Inverted Sugar
- Partially Inverted Sugar
Based on End Use:
- Food
- Confectionery
- Bakery
- Processed Food
- Frozen Desserts
- Dairy Products
- Others
- Pharmaceutical
- Personal Care
Based on the Geography:
- North America
- US
- Canada
- Europe
- Germany
- UK
- France
- Italy
- Spain
- Rest of Europe
- Asia Pacific
- China
- Japan
- India
- Australia
- South Korea
- Rest of Asia Pacific
- Latin America
- Brazil
- Mexico
- Argentina
- Rest of Latin America
- Middle East & Africa
- Saudi Arabia
- South Africa
- UAE
- Rest of the Middle East and Africa
Regional Analysis
North America
North America leads the market with a dominant 40% share, spearheaded by the United States. This region's prominence stems from its robust aerospace industry, substantial defense budgets, and ongoing modernization efforts in military and commercial aviation sectors. The U.S. Department of Defense's focus on enhancing inertial navigation systems for missiles, aircraft, and submarines significantly propels the RLG market. Major defense contractors and aerospace companies in this region continuously invest in research and development to improve RLG performance, reliability, and miniaturization.
Europe
Europe follows closely with a 35% market share, with countries like France, Germany, and the United Kingdom at the forefront. The region's RLG market is driven by a strong presence of aerospace manufacturers, increasing defense cooperation among European Union member states, and the growing commercial aviation sector. European manufacturers emphasize developing RLG technologies for both military and civil applications, including space exploration and satellite systems.
Key Player Analysis
- Nordzucker AG (Nordzucker Holding AG)
- Südzucker AG
- International Molasses Corporation
- Galam Group (FIMI)
- AP Multiproducts Pvt. Ltd
- Cargill, Incorporated
- Ragus Sugars Manufacturing Limited
- Tereos S.A
- Honey Sugar Product
- Archer Daniels Midland Company
Competitive Analysis
In the competitive landscape of the Invert Sugar Market, major players like Nordzucker AG, Südzucker AG, and Cargill, Incorporated lead the way, leveraging their extensive geographic reach and robust supply chains to meet global demand. Nordzucker AG and Südzucker AG, two of Europe's largest sugar manufacturers, capitalize on their advanced processing capabilities to produce high-quality invert sugar, catering to both regional and international markets. Cargill, Incorporated, a global leader in food and agriculture, distinguishes itself by offering a wide range of customized invert sugar solutions designed to meet diverse industry needs, from food and beverage to pharmaceuticals. Companies like Tereos S.A and Archer Daniels Midland Company focus on innovation and sustainability, enhancing their product portfolios with environmentally friendly practices and new product developments. Smaller specialists like Ragus Sugars Manufacturing Limited and International Molasses Corporation carve niches with bespoke solutions and specialized products, emphasizing quality and customer-specific formulations, which are crucial for maintaining competitive advantage in this growing market.
Recent Developments
- In February 2024, Sudzucker launched its new CO2-reduced beet sugar in the market to contribute to a healthy, sustainable, and enjoyable future.
- In December 2023, American company ADM announced the acquisition of United Kingdom-based FDL to broaden its global flavors capabilities.
Market Concentration & Characteristics
The Invert Sugar Market exhibits a moderate to high level of market concentration, dominated by a few key players such as Nordzucker AG, Südzucker AG, and Cargill, Incorporated. These industry leaders leverage their extensive production capabilities, advanced technologies, and strong distribution networks to maintain significant market shares. The market is characterized by the growing demand for natural and functional sweeteners, driven by health-conscious consumers and the clean-label trend. Invert sugar’s functional properties, such as preventing crystallization and enhancing moisture retention, make it highly desirable across various applications, including confectionery, bakery, and beverages. Additionally, the market sees continuous innovation, with manufacturers focusing on developing organic and non-GMO variants to cater to evolving consumer preferences. This competitive landscape is shaped by both established giants and emerging players striving to capture market share through innovation and strategic expansion.
Report Coverage
The research report offers an in-depth analysis based on Product Type, End Use and Geography. It details leading market players, providing an overview of their business, product offerings, investments, revenue streams, and key applications. Additionally, the report includes insights into the competitive environment, SWOT analysis, current market trends, as well as the primary drivers and constraints. Furthermore, it discusses various factors that have driven market expansion in recent years. The report also explores market dynamics, regulatory scenarios, and technological advancements that are shaping the industry. It assesses the impact of external factors and global economic changes on market growth. Lastly, it provides strategic recommendations for new entrants and established companies to navigate the complexities of the market.
Future Outlook
- Continued growth in demand for natural and healthier sweeteners will drive market expansion.
- Increased adoption of invert sugar in the food and beverage industry will boost market growth.
- Development of organic and non-GMO invert sugar variants will cater to health-conscious consumers.
- Technological advancements in production will enhance product quality and efficiency.
- Rising demand for clean-label products will support market growth for invert sugar.
- Expansion into non-food applications, such as pharmaceuticals and personal care, will open new market opportunities.
- Sustainability initiatives in manufacturing processes will attract environmentally conscious consumers.
- Growth in emerging markets will offer significant expansion opportunities for key players.
- Collaborations and partnerships between manufacturers and food companies will drive innovation and application development.
- Effective marketing and consumer education efforts will help dispel misconceptions about invert sugar and highlight its benefits.
Request a Free Sample
Fill in your details and we'll send you a free sample report.
- Sample data tables & charts
- Research methodology
Need a Custom Version of This Report?
Tailor the scope, geography, or segments to your exact requirements.
- Custom geography or segment scope
- Direct access to our analyst team
Frequently Asked Questions
What is the current size of the Invert Sugar Market?
What factors are driving the growth of the Invert Sugar Market?
What are the key segments within the Invert Sugar Market?
What are some challenges faced by the Invert Sugar Market?
Who are the major players in the Invert Sugar Market?
Table of Content
Chapter 1. Report Introduction
- 1.1 Report Description & Purpose
- 1.1.1 Report Title & Market Definition
- 1.1.2 Unique Selling Propositions (USP) & Key Differentiators
- 1.1.3 Value Proposition for Stakeholders
- 1.2 Research Objectives
- 1.2.1 Market Sizing Objectives (Volume & Revenue)
- 1.2.2 Segmentation Objectives
- 1.2.3 Competitive Intelligence Objectives
- 1.2.4 Forecast & Scenario Objectives
- 1.3 Report Scope
- 1.3.1 Invert Sugar Scope – Types & Subtypes Covered
- 1.3.2 Geographic Scope – Regions & Countries Covered
- 1.3.3 Historical Period, Base Year & Forecast Period (2024; forecast to 2032)
- 1.3.4 Inclusions & Exclusions
- 1.4 HS Code & Classification Framework
- 1.5 Currency, Units & Pricing Basis
- 1.6 Target Stakeholders
- 1.7 Limitations & Assumptions
Chapter 2. Executive Summary
- 2.1 Global Invert Sugar Market Snapshot
- 2.1.1 Market Size – Historical (2024) & Forecast (2024-2032) (2024: USD 2,066 million → 2032: USD 2,795 million)
- 2.1.2 Volume & Revenue – Global Totals
- 2.1.3 Key Market Highlights – Top Five Facts
- 2.2 Invert Sugar Market Segmentation Snapshot
- 2.2.1 Market Split by Region – 2024 vs. 2032
- 2.3 Competitive Snapshot
- 2.3.1 Top 10 Players by Revenue Share – 2024
- 2.3.2 Top 10 Players by Volume Share – 2024
- 2.3.3 Recent Strategic Developments (18-Month Summary)
- 2.4 Key Investment Highlights & Strategic Conclusions
Chapter 3. Invert Sugar Market Dynamics & Industry Analysis
- 3.1 Market Overview & Context
- 3.1.1 Invert Sugar Market Position in the Broader Automotive Value Chain
- 3.1.2 OEM vs. Replacement Market Dynamics
- 3.1.3 Market Maturity & Development Stage by Region
- 3.2 Invert Sugar Market Drivers
- 3.3 Invert Sugar Market Restraints & Challenges
- 3.4 Invert Sugar Market Opportunities
- 3.5 Porter's Five Forces Analysis
- 3.5.1 Threat of New Entrants
- 3.5.2 Bargaining Power of Suppliers
- 3.5.3 Bargaining Power of Buyers
- 3.5.4 Threat of Substitutes
- 3.5.5 Competitive Rivalry – Intensity Assessment
- 3.6 Invert Sugar Value Chain Analysis
- 3.6.1 Upstream – Raw Material/Input Suppliers
- 3.6.1.1 Raw Material/Input 1
- 3.6.1.2 Raw Material/Input 2
- 3.6.1.3 Raw Material/Input 3
- 3.6.2 Midstream – Production/Manufacturing/Service Delivery
- 3.6.2.1 Production/Process Overview
- 3.6.2.2 Key Facility Locations & Capacity by Manufacturer
- 3.6.3 Downstream – Distribution & End Consumer
- 3.6.3.1 Primary Channel – B2B/OEM
- 3.6.3.2 Secondary Channels – Dealer, Retail, Online, Direct
- 3.6.4 Value Chain Profitability Analysis
- 3.6.1 Upstream – Raw Material/Input Suppliers
- 3.7 PESTEL Analysis
- 3.7.1 Political Factors
- 3.7.2 Economic Factors
- 3.7.3 Social Factors
- 3.7.4 Technological Factors
- 3.7.5 Environmental Factors
- 3.7.6 Legal Factors
- 3.8 Invert Sugar Supply Chain Analysis
- 3.8.1 Raw Material/Input Supply Risk Assessment
- 3.8.2 Manufacturing Concentration Risk (Geographic Exposure)
- 3.8.3 Trade Disruption Impact Analysis
- 3.9 Regulatory & Policy Landscape
Note: The regulatory and policy landscape section covers regulations based on their applicability to the market, Invert Sugar category, geography, and scope of the study. Only regulatory frameworks with a material impact on operations, compliance, trade, sustainability, or market access are analyzed in detail.
Chapter 4. Key Investment Pockets & Opportunity Analysis
- 4.1 Invert Sugar Market Attractiveness Analysis
- 4.1.1 By Region – Investment Attractiveness Matrix (Volume × CAGR)
- 4.2 Absolute Revenue Growth Opportunity
- 4.2.1 By Region – Absolute USD Growth Through 2032
- 4.3 Incremental Volume Opportunity
- 4.3.1 By Region – Incremental Volume Through 2032
- 4.3.2 Segment – Incremental Volume
- 4.4 Emerging Submarket Opportunity Deep Dive (Subject to Applicability)
- 4.5 Emerging Market Opportunity Scorecards
- 4.5.1 United States
- 4.5.2 Europe
- 4.5.3 Asia
- 4.5.4 Middle East & Africa
Note: Emerging Market Opportunity Scorecards will be included based on relevance and strategic importance. Regions listed are indicative and may vary depending on data availability and market dynamics.
Chapter 5. Invert Sugar Import-Export Analysis & Trade Flows
- 5.1 Global Trade Overview
- 5.1.1 Global Export Value by Country (2024)
- 5.1.2 Global Export Volume by Country (2024)
- 5.1.3 Global Import Value by Country (2024)
- 5.1.4 Global Import Volume by Country (2024)
- 5.1.5 Net Trade Balance by Country (2024)
- 5.2 Export Analysis – Segment
- 5.2.1 Type 1 (HS Code)
- 5.2.2 Type 2 (HS Code)
- 5.2.3 Type 3 (HS Code)
- 5.2.4 Type 4 (HS Code)
- 5.2.5 Type 5 (HS Code)
- 5.3 Import Analysis – Segment
- 5.3.1 Type 1 (HS Code)
- 5.3.2 Type 2 (HS Code)
- 5.3.3 Type 3 (HS Code)
- 5.3.4 Type 4 (HS Code)
- 5.3.5 Type 5 (HS Code)
- 5.4 Average Unit Trade Prices
- 5.4.1 Average Export Price – Segment & Country
- 5.4.2 Average Import Price – Segment & Source Country
- 5.4.3 Price Trends (2024)
- 5.5 Key Trade Route Analysis
- 5.5.1 Trade Route 1
- 5.5.2 Trade Route 2
- 5.5.3 Trade Route 3
- 5.5.4 Trade Route 4
- 5.5.5 Trade Route 5
- 5.6 Trade Policy Impact Assessment
- 5.6.1 US Anti-Dumping & Section 301 Tariffs
- 5.6.2 EU Customs Union Impact
- 5.6.3 Major Free Trade Agreements
- 5.6.4 USMCA Rules of Origin
Note: Trade policy analysis will be included only where relevant to the Invert Sugar market.
Chapter 6. Competitive Landscape & Company Benchmarking
- 6.1 Invert Sugar Market Concentration & Structure
- 6.1.1 Herfindahl-Hirschman Index (HHI) – vs. 2024
- 6.1.2 Tier 1, Tier 2 & Tier 3 Market Structure
- 6.1.3 Global, Regional & Local Player Dynamics
- 6.2 Invert Sugar Market Share Analysis – 2024
- 6.2.1 Global Revenue Share by Company
- 6.2.2 Global Volume Share by Company
- 6.2.3 Regional Revenue Share
- 6.2.4 Market Share Evolution ( vs. 2024)
- 6.2.5 OEM Segment Share by Company
- 6.2.6 Replacement Segment Share by Company
- 6.3 Production/Delivery Capacity & Facility Analysis
- 6.3.1 Global Installed Capacity
- 6.3.2 Capacity Utilization Rates
- 6.3.3 Production/Output Volume
- 6.3.4 Facility Locations & Capacity Map
- 6.3.5 Planned Capacity Additions
- 6.4 Invert Sugar Competitive Benchmarking Matrix
- 6.4.1 Revenue, Volume, CAGR & Profitability Comparison
- 6.4.2 Channel Revenue Mix
- 6.4.3 Geographic Revenue Exposure
- 6.4.4 R&D Intensity
- 6.4.5 Sustainability Maturity
- 6.5 Strategic Developments in Invert Sugar (Last 24 Months)
- 6.5.1 Mergers, Acquisitions & Divestments
- 6.5.2 New Invert Sugar Launches
- 6.5.3 Facility Expansions
- 6.5.4 Strategic Alliances, Joint Ventures & Partnerships
- 6.5.5 Distribution Expansion & Market Entry
- 6.5.6 Sustainability & ESG Initiatives
- 6.6 Competitive Strategy Mapping
- 6.6.1 Leader, Challenger, Follower & Niche Classification
- 6.6.2 Pricing Strategy Comparison
- 6.6.3 Channel Strategy Matrix
Note: Strategic developments are included based on their materiality and the availability of reliable information.
Chapter 7. Global Invert Sugar Market – By Distribution Channel
- 7.1 Segment Overview
- 7.1.1 Volume & Revenue Split by Channel (2024 & 2032)
- 7.1.2 Channel Mix Evolution (2024-2032)
Chapter 8. Regional Market Analysis – Global Overview
- 8.1 Global Regional Overview
- 8.1.1 Regional Volume Share
- 8.1.2 Regional Revenue Share
- 8.1.3 Regional Volume by Region
- 8.1.4 Regional Revenue by Region
- 8.1.5 Regional Forecast Through 2032
- 8.2 Cross-Regional Segment Analysis
- 8.2.1 By Distribution Channel
- 8.2.2 By Brand/Price Tier
Chapter 9. North America Invert Sugar Market
- 9.1 United States
- 9.2 Canada
- 9.3 Mexico
Chapter 10. Europe Invert Sugar Market
- 10.1 Germany
- 10.2 France
- 10.3 Italy
- 10.4 United Kingdom
- 10.5 Spain
- 10.6 Poland
- 10.7 Russia
- 10.8 Netherlands
- 10.9 Belgium
- 10.10 Sweden
- 10.11 Denmark
- 10.12 Norway
- 10.13 Rest of Europe
Chapter 11. Asia Pacific Invert Sugar Market
- 11.1 China
- 11.2 India
- 11.3 Japan
- 11.4 South Korea
- 11.5 Thailand
- 11.6 Indonesia
- 11.7 Vietnam
- 11.8 Malaysia
- 11.9 Australia
- 11.10 Rest of Asia Pacific
Chapter 12. Latin America Invert Sugar Market
- 12.1 Brazil
- 12.2 Argentina
- 12.3 Colombia
- 12.4 Chile
- 12.5 Rest of Latin America
Chapter 13. Middle East Invert Sugar Market
- 13.1 Saudi Arabia
- 13.2 United Arab Emirates
- 13.3 Turkey
- 13.4 Israel
- 13.5 Iran
- 13.6 Rest of the Middle East
Chapter 14. Africa Invert Sugar Market
- 14.1 South Africa
- 14.2 Egypt
- 14.3 Nigeria
- 14.4 Morocco
- 14.5 Rest of Africa
Chapter 15. Invert Sugar Company Profiles
- 15.1 [Company 01]
- 15.1.1 Company Overview
- 15.1.2 Key Management Personnel
- 15.1.3 Products & Services Portfolio
- 15.1.4 Financial Performance
- 15.1.5 Key Market Focus & Geographic Presence
- 15.1.6 Recent Developments & Strategic Initiatives
Note: The company profile list is preliminary and may change based on research findings, market developments, data availability, and client requirements.
Chapter 16. Appendices
- Appendix A – List of Abbreviations & Acronyms
- Appendix B – Industry Classification Code Reference – Full Series
- Appendix C – Production & Capacity Data Tables
- Appendix D – End-Use & Demand Base Tables
- Appendix E – Consumption & Replacement Rate Assumptions
- Appendix F – ASP Reference Tables
- Appendix G – Manufacturing & Facility Database
- Appendix H – Import-Export Data Tables
- Appendix I – Regulatory Summary Tables
- Appendix J – Primary Research Participant List (Anonymized)
- Appendix K – Primary Research Questionnaire Framework
- Appendix L – Data Sources & Bibliography
- Appendix M – Market Size Divergence & Source Comparison
Chapter 17. Research Methodology
- 17.1 Research Framework & Philosophy
- 17.2 Secondary Research – Sources, Hierarchy & Data Extraction
- 17.3 Data Modeling – Bottom-Up & Top-Down Market Sizing
- 17.4 Primary Research – Stakeholder Framework, LOI & Sample Sizes
- 17.5 Forecast Methodology – Regression, Scenario & Sensitivity Analysis
- 17.6 Quality Control – Four-Layer Validation Framework
- 17.7 Limitations & Standard Assumptions
- 17.8 Disclaimer
