
Market Overview
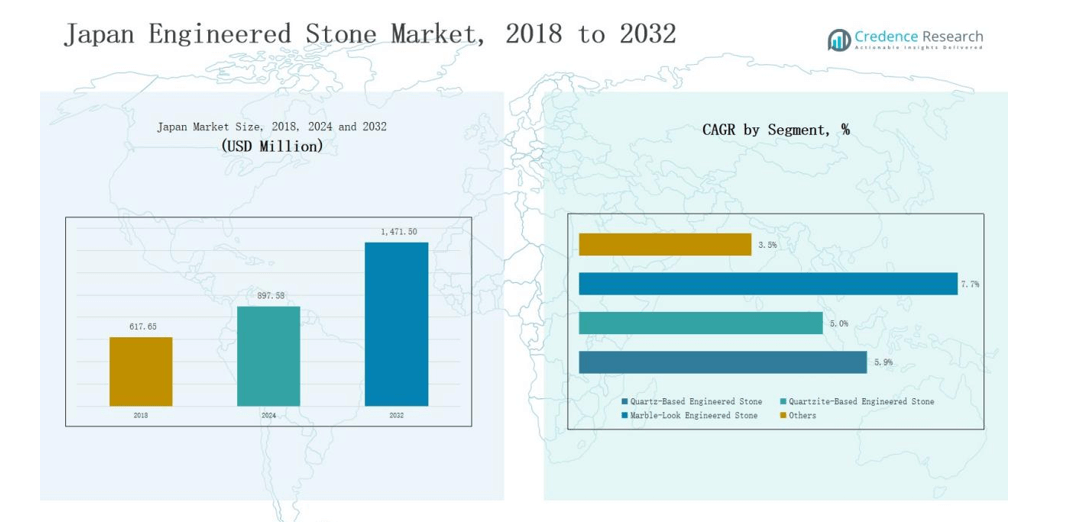
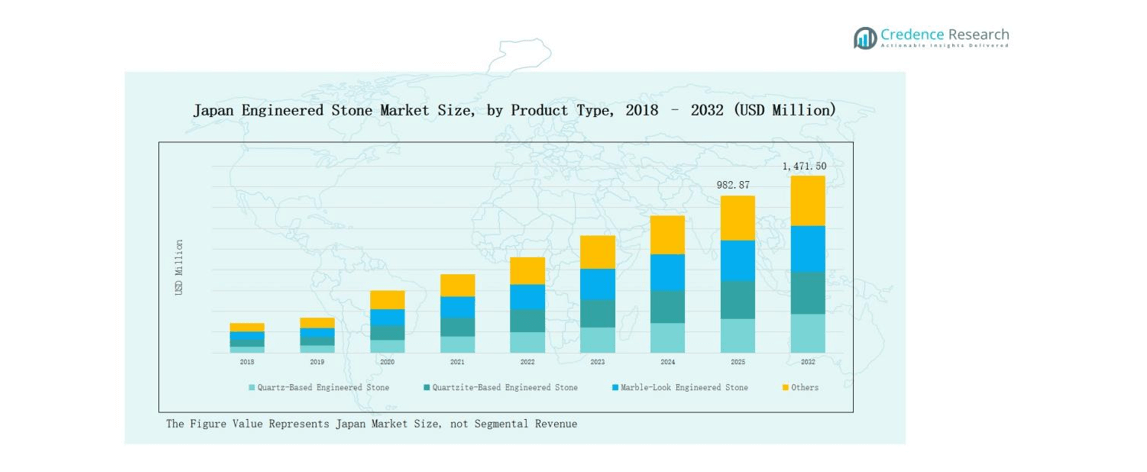
Japan Engineered Stone Market size was valued at USD 617.65 million in 2018, reached USD 897.58 million in 2024, and is anticipated to reach USD 1,471.50 million by 2032, growing at a CAGR of 5.93% during the forecast period.
| REPORT ATTRIBUTE | DETAILS |
|---|---|
| Historical Period | 2020-2023 |
| Base Year | 2024 |
| Forecast Period | 2025-2032 |
| Japan Engineered Stone Market Size 2024 | USD 897.58 million |
| Japan Engineered Stone Market, CAGR | 5.93% |
| Japan Engineered Stone Market Size 2032 | USD 1,471.50 million |
The Japan Engineered Stone Market features strong competition among global leaders and domestic specialists focusing on product innovation, sustainability, and tailored solutions. Prominent players include Caesarstone, Cosentino (Silestone, Dekton), Smartstone, Quantum Quartz, Hanstone Quartz, WK Marble & Granite, Essa Stone, Laminex Japan, Lapitec, and Vicostone, each strengthening their presence through premium quartz-based surfaces, eco-friendly offerings, and strategic partnerships with contractors, architects, and distributors. Among regions, Kanto commanded the largest share of 38% in 2024, supported by luxury housing projects, commercial infrastructure, and strong demand for durable, low-maintenance surfaces in Tokyo and Yokohama.
Market Insights
- The Japan Engineered Stone Market reached USD 897.58 million in 2024 and is expected to hit USD 1,471.50 million by 2032, growing steadily at 5.93%.
- Quartz-based engineered stone dominated with a 62% share in 2024, driven by durability, stain resistance, and versatile design options appealing to both residential and commercial projects.
- Kitchen countertops led applications with a 48% share, followed by bathroom vanities at 20%, while flooring, wall cladding, and decorative uses steadily expanded adoption across premium projects.
- The residential sector commanded 55% share in 2024, supported by urban housing modernization, while commercial projects held 32% and institutional uses 13%, highlighting diverse demand drivers.
- Kanto remained the largest region with 38% share, followed by Kansai at 27%, Chubu at 18%, and Kyushu and others at 17%, reflecting balanced regional growth.
Market Segment Insights
By Product Type
Quartz-based engineered stone dominated the Japan market in 2024, accounting for nearly 62% share. Its popularity stems from superior durability, stain resistance, and wide design options, making it the preferred choice for residential and commercial surfaces. Marble-based engineered stone captured around 25%, driven by premium interior projects demanding elegance. Other materials such as granite blends and recycled content held the remaining 13%, supported by growing sustainability initiatives and demand for cost-effective alternatives.
- For instance, Trend Group has an engineered stone portfolio with recycled glass surfaces. The company's catalogues and sustainability information detail their engineered stone products, including the etherium line, which is made using a significant percentage of post-consumer recycled glass.
By Application
Kitchen countertops led the application segment in 2024 with a 48% market share, fueled by Japan’s rising housing renovations, luxury apartment demand, and preference for durable, low-maintenance surfaces. Bathroom vanities followed with 20%, supported by upscale residential designs. Flooring and wall cladding contributed 15%, while furniture and decorative applications accounted for 10%, targeting niche aesthetic markets. Other uses, including commercial and institutional projects, made up 7%, driven by hotels, offices, and healthcare facilities adopting engineered stone surfaces.
- For instance, LIXIL Corporation introduced high-end bathroom vanities in Japan, integrating engineered stone surfaces to align with luxury apartment projects.
By End User
The residential sector held the largest share of 55% in 2024, underpinned by rising urban housing projects, modernization of interiors, and consumer preference for stylish, durable materials. The commercial sector followed with 32%, driven by retail outlets, offices, and hospitality projects emphasizing premium surfaces. Industrial and institutional users contributed around 13%, supported by hospitals, universities, and large facilities prioritizing hygiene and durability. Growing investment in residential remodeling continues to position the residential segment as the primary market driver.
Market Overview
Rising Demand for Residential Renovation and Remodeling
The Japanese housing market is witnessing a surge in renovation and remodeling activities, particularly in urban regions like Tokyo, Osaka, and Nagoya. Homeowners increasingly prefer engineered stone for kitchen countertops and bathroom vanities due to its durability, stain resistance, and aesthetic appeal. Growing disposable incomes and lifestyle upgrades further drive adoption in premium and mid-range homes. The demand for modern, low-maintenance surfaces positions engineered stone as the preferred choice, fueling steady growth in the residential segment across the country.
- For instance, Cosentino expanded its Silestone and Dekton ranges in Japan to cater to demand for sustainable, low-maintenance engineered surfaces.
Expansion of Commercial and Hospitality Projects
Japan’s commercial construction sector, especially retail outlets, offices, and hospitality establishments, is driving engineered stone demand. High-end hotels, shopping malls, and office spaces prioritize engineered stone for its blend of luxury, hygiene, and long-term durability. Government-backed infrastructure projects and private sector investments are fueling new developments, increasing the material’s penetration in the commercial segment. This trend aligns with rising international tourism and demand for premium hospitality facilities, positioning engineered stone as a strategic material for modern urban infrastructure.
Focus on Sustainability and Eco-Friendly Surfaces
Environmental consciousness is shaping consumer and corporate preferences in Japan’s construction industry. Engineered stone manufacturers are increasingly adopting recycled content, sustainable resins, and energy-efficient processes to meet strict environmental standards. Demand for eco-friendly and low-carbon building materials is rising among developers and institutional projects. This sustainability focus is not only aligning with Japan’s decarbonization targets but also providing manufacturers with opportunities to differentiate through green certifications and innovative product launches, thereby strengthening their competitive edge in the domestic market.
- For instance, BASF Japan introduced Hydrofluoroolefin (HFO)-blown PIR technology that improves energy efficiency in sandwich panels while substantially lowering global warming potential and enhancing fire safety compliance.
Key Trends & Opportunities
Growing Popularity of Quartz-Based Engineered Stone
Quartz-based engineered stone is emerging as the dominant material due to its superior performance characteristics, representing more than half of the market share in 2024. Japanese consumers value its resistance to scratches, stains, and heat, making it ideal for busy kitchens and high-traffic areas. The segment is also benefiting from growing product innovation in colors, finishes, and textures tailored for modern interiors. This trend reflects the rising preference for durable, aesthetic, and versatile surfaces in both residential and commercial applications.
- For instance, Caesarstone Japan expanded its portfolio with the Pebbles Collection, offering five neutral-toned surface designs inspired by natural landscapes to match modern interiors.
Expansion of Online and Specialty Store Distribution
The distribution landscape for engineered stone in Japan is evolving with increasing reliance on specialty stores and online platforms. Specialty stores cater to customized design requirements and offer technical expertise to contractors and homeowners, while online platforms improve accessibility and convenience. The shift toward digital channels is supported by consumer demand for product comparisons and visualization tools before purchase. These evolving sales strategies present significant opportunities for manufacturers and distributors to expand market reach and strengthen customer engagement.
- For instance, Cosentino expanded its digital showroom concept in Japan, allowing customers to explore surface materials virtually with 3D visualization tools.
Key Challenges
High Competition from Natural Stone and Alternative Materials
Engineered stone faces stiff competition from natural stone options such as granite and marble, which continue to appeal to premium customers seeking exclusivity. In addition, alternative materials like ceramics, laminates, and solid surfaces are capturing cost-sensitive buyers. These substitutes often provide comparable aesthetics at lower prices, limiting engineered stone’s penetration in certain market segments. Overcoming this challenge requires manufacturers to emphasize unique value propositions such as durability, consistency, and eco-friendliness to retain competitive advantage in Japan.
Price Sensitivity and Installation Costs
The relatively high cost of engineered stone, coupled with specialized installation expenses, poses a barrier for wider adoption in Japan’s price-sensitive consumer market. While premium customers are willing to pay for durability and aesthetics, mid-range buyers often seek cheaper alternatives. Installation challenges further add to project costs, discouraging some residential and small commercial buyers. Addressing this challenge requires cost optimization, expanded financing options, and awareness campaigns emphasizing engineered stone’s long-term value compared to short-term savings from substitutes.
Dependence on Imports and Supply Chain Constraints
A significant portion of engineered stone in Japan is imported, making the market vulnerable to supply chain disruptions, currency fluctuations, and global trade dynamics. Any disruption in sourcing raw materials or finished slabs can affect pricing and timely availability for local projects. Dependence on imports also reduces the bargaining power of domestic distributors. This challenge underscores the need for developing local manufacturing capabilities, strengthening regional partnerships, and diversifying supply sources to ensure market stability and long-term growth.
Regional Analysis
Kanto
Kanto led the Japan Engineered Stone Market in 2024 with a 38% share. The region benefits from high urban density, luxury housing projects, and commercial developments in Tokyo and Yokohama. Strong demand for premium kitchen countertops and bathroom vanities continues to support growth. Developers and homeowners prioritize durable, low-maintenance surfaces to meet modern design preferences. The region’s hospitality and retail sectors also adopt engineered stone to enhance functionality and aesthetics. Ongoing real estate investments further strengthen Kanto’s position as the leading regional market.
Kansai
Kansai accounted for 27% share of the Japan Engineered Stone Market in 2024. Osaka and Kyoto drive demand through a mix of residential remodeling and expanding commercial projects. Rising tourism in Kyoto has spurred the use of engineered stone in hotels and restaurants. Homeowners in Osaka increasingly prefer quartz-based products for kitchens and bathrooms. The market benefits from government-backed infrastructure upgrades that include public and institutional buildings. Kansai maintains strong momentum due to its balance of residential and commercial demand.
Chubu
Chubu held 18% share of the Japan Engineered Stone Market in 2024. Nagoya anchors growth with demand from both housing and industrial projects. Rising adoption in office buildings and retail facilities boosts the market’s regional strength. Residential customers in the area prefer engineered stone for durability and design versatility. The presence of large contractors and steady investments in urban housing support stable growth. Chubu continues to strengthen its role through a mix of residential and commercial adoption.
Kyushu and Others
Kyushu and other regions collectively captured 17% share of the Japan Engineered Stone Market in 2024. The region records growing demand from mid-scale housing and public infrastructure projects. Rising use in institutional facilities, hospitals, and universities supports expansion. Tourism-driven developments in southern prefectures create additional opportunities for commercial applications. The market also benefits from rising awareness of sustainable and eco-friendly surfaces. Kyushu and others remain secondary contributors but provide steady growth opportunities through regional construction activities.
Market Segmentations:
By Product Type
- Quartz-based engineered stone
- Marble-based engineered stone
- Others (granite blends, recycled content)
By Application
- Kitchen countertops
- Bathroom vanities
- Flooring & wall cladding
- Furniture & decorative applications
- Others (commercial surfaces, institutional projects)
By End User
- Residential
- Commercial
- Industrial/Institutional
By Distribution Channel
- Specialty stores
- Direct sales (fabricators, contractors)
- Online platforms
- Others (distributors, wholesalers)
By Region
- Kanto (Tokyo, Yokohama)
- Kansai (Osaka, Kyoto)
- Chubu (Nagoya)
- Kyushu & Others
Competitive Landscape
The Japan Engineered Stone Market is characterized by the presence of global leaders and strong domestic players competing across product innovation, distribution reach, and brand positioning. International brands such as Caesarstone and Cosentino maintain significant visibility, leveraging premium quartz-based product portfolios and established relationships with contractors, architects, and distributors. Domestic companies like WK Marble & Granite, Laminex Japan, and Essa Stone focus on catering to localized demand through tailored designs, cost-efficient offerings, and faster supply networks. Players emphasize sustainability by introducing recycled content and eco-friendly surfaces to align with Japan’s environmental goals. Partnerships with specialty stores and online channels strengthen customer access, while collaborations with construction firms enhance project-based adoption. Intense competition pushes companies to differentiate through aesthetics, durability, and customization, making innovation a key driver of long-term positioning in the market.
Key Players
- Caesarstone
- Cosentino (Silestone, Dekton)
- Smartstone
- Quantum Quartz
- Hanstone Quartz
- WK Marble & Granite
- Essa Stone
- Laminex Japan
- Lapitec
- Vicostone
Recent Developments
- l In July 2025, Caesarstone launched Caesarstone ICON, a new line of advanced fusion surfaces with a crystalline silica-free formula and eight new colors.
- In early 2024, Smartstone announced plans to introduce its Sintered Collection, a silica-free alternative to traditional engineered stone.
- In 2024, HanStone Quartz introduced its Next Generation Quartz (NGQ) technology, designed to cut crystalline silica content and enhance sustainability.
Report Coverage
The research report offers an in-depth analysis based on Product Type, Application, End User, Distribution Channel and Region. It details leading market players, providing an overview of their business, product offerings, investments, revenue streams, and key applications. Additionally, the report includes insights into the competitive environment, SWOT analysis, current market trends, as well as the primary drivers and constraints. Furthermore, it discusses various factors that have driven market expansion in recent years. The report also explores market dynamics, regulatory scenarios, and technological advancements that are shaping the industry. It assesses the impact of external factors and global economic changes on market growth. Lastly, it provides strategic recommendations for new entrants and established companies to navigate the complexities of the market.
Future Outlook
- Demand for quartz-based engineered stone will continue to dominate residential and commercial projects.
- Kitchen countertops will remain the leading application driven by urban housing renovations.
- Bathroom vanities will record steady adoption supported by premium home designs.
- Commercial projects in retail, offices, and hospitality will expand the market footprint.
- Eco-friendly and recycled-content engineered stone will gain traction due to sustainability targets.
- Specialty stores and online platforms will play a stronger role in distribution.
- Local players will strengthen competitiveness through tailored designs and cost-efficient offerings
- Kanto will remain the largest regional market supported by dense urbanization.
- Kansai and Chubu will see stable growth driven by infrastructure and tourism-led projects.
- Supply chain diversification and regional manufacturing will reduce dependence on imports.

Request a Free Sample
Fill in your details and we'll send you a free sample report.
- Sample data tables & charts
- Research methodology
Need a Custom Version of This Report?
Tailor the scope, geography, or segments to your exact requirements.
- Custom geography or segment scope
- Direct access to our analyst team
Frequently Asked Questions
What is the current market size for Japan Engineered Stone Market, and what is its projected size in 2032?
At what Compound Annual Growth Rate is the Japan Engineered Stone Market projected to grow between 2025 and 2032?
Which Japan Engineered Stone Market segment held the largest share in 2024?
What are the primary factors fueling the growth of the Japan Engineered Stone Market?
Who are the leading companies in the Japan Engineered Stone Market?
Table of Content
Chapter 1. Report Introduction
- 1.1 Report Description & Purpose
- 1.1.1 Report Title & Market Definition
- 1.1.2 Unique Selling Propositions (USP) & Key Differentiators
- 1.1.3 Value Proposition for Stakeholders
- 1.2 Research Objectives
- 1.2.1 Market Sizing Objectives (Volume & Revenue) (Volume Where Applicable)
- 1.2.2 Segmentation Objectives
- 1.2.3 Competitive Intelligence Objectives
- 1.2.4 Forecast & Scenario Objectives
- 1.3 Report Scope
- 1.3.1 Japan Engineered Stone Scope – Segments & Subsegments Covered
- 1.3.2 Geographic Scope – Selected Country & Subnational Markets Covered
- 1.3.3 Historical Period, Base Year & Forecast Period (2024; forecast to 2032)
- 1.3.4 Inclusions & Exclusions
- 1.4 Industry Classification & Applicable Codes
- 1.5 Currency, Measurement Units & Valuation Basis
- 1.6 Target Stakeholders
- 1.7 Limitations & Assumptions
Chapter 2. Executive Summary
- 2.1 Japan Engineered Stone Snapshot
- 2.1.1 Market Size – Historical (2024) & Forecast (2024-2032) (2024: USD 897.58 million → 2032: USD 1,471.50 million)
- 2.1.2 Volume & Revenue – National Totals (Volume Where Applicable)
- 2.1.3 Key Market Highlights – Top Five Facts
- 2.2 Japan Engineered Stone Segmentation Snapshot
- 2.2.1 Market Split by Subnational Area – 2024 vs. 2032
- 2.3 Competitive Snapshot
- 2.3.1 Top 10 Players by Revenue Share – 2024
- 2.3.2 Top 10 Players by Volume Share – 2024 (Volume Where Applicable)
- 2.3.3 Recent Strategic Developments (18-Month Summary)
- 2.4 Key Investment Highlights & Strategic Conclusions
Chapter 3. Japan Engineered Stone Dynamics & Industry Analysis
- 3.1 Market Overview & Context
- 3.1.1 Japan Engineered Stone Position in the Broader Industry Value Chain
- 3.1.2 Demand Structure & Purchasing Dynamics
- 3.1.3 Market Maturity & Development Stage Across Domestic Markets
- 3.2 Japan Engineered Stone Drivers
- 3.3 Japan Engineered Stone Restraints & Challenges
- 3.4 Japan Engineered Stone Opportunities
- 3.5 Porter's Five Forces Analysis
- 3.5.1 Threat of New Entrants
- 3.5.2 Bargaining Power of Suppliers
- 3.5.3 Bargaining Power of Buyers
- 3.5.4 Threat of Substitutes
- 3.5.5 Competitive Rivalry – Intensity Assessment
- 3.6 Japan Engineered Stone Value Chain Analysis
- 3.6.1 Upstream – Key Inputs, Resources & Suppliers
- 3.6.1.1 Key Input/Resource 1
- 3.6.1.2 Key Input/Resource 2
- 3.6.1.3 Key Input/Resource 3
- 3.6.2 Midstream – Core Operations & Value Creation
- 3.6.2.1 Operating Model & Process Overview
- 3.6.2.2 Key Operating Locations & Capabilities by Company
- 3.6.3 Downstream – Market Channels & End Users
- 3.6.3.1 Direct Sales & Customer Engagement Channels
- 3.6.3.2 Indirect Sales, Intermediaries & Partner Channels
- 3.6.4 Value Chain Profitability Analysis
- 3.6.1 Upstream – Key Inputs, Resources & Suppliers
- 3.7 PESTEL Analysis
- 3.7.1 Political Factors
- 3.7.2 Economic Factors
- 3.7.3 Social Factors
- 3.7.4 Technological Factors
- 3.7.5 Environmental Factors
- 3.7.6 Legal Factors
- 3.8 Japan Engineered Stone Supply Chain Analysis
- 3.8.1 Critical Input & Resource Availability Risk Assessment
- 3.8.2 Supplier & Operational Concentration Risk (Geographic Exposure)
- 3.8.3 Supply & Service Disruption Impact Analysis
- 3.9 National & Subnational Regulatory Landscape
Note: The regulatory and policy landscape section covers regulations based on their applicability to the market, Japan Engineered Stone category, geography, and scope of the study. Only regulatory frameworks with a material impact on operations, compliance, trade, sustainability, or market access are analyzed in detail.
Chapter 4. Key Investment Pockets & Opportunity Analysis
- 4.1 Japan Engineered Stone Attractiveness Analysis
- 4.1.1 By Subnational Area – Investment Attractiveness Matrix (Market Size × CAGR)
- 4.2 Absolute Revenue Growth Opportunity
- 4.2.1 By Subnational Area – Absolute Revenue Growth Through 2032
- 4.3 Incremental Demand Opportunity
- 4.3.1 By Subnational Area – Incremental Demand Through 2032
- 4.3.2 Segment – Incremental Demand
- 4.4 Emerging Submarket Opportunity Deep Dive (Subject to Applicability)
- 4.5 Priority Domestic Market Opportunity Scorecards
- 4.5.1 Priority Domestic Market 1
- 4.5.2 Priority Domestic Market 2
- 4.5.3 Priority Domestic Market 3
- 4.5.4 Priority Domestic Market 4
Note: Domestic market scorecards cover relevant states, provinces, territories, cities, or economic zones within the selected country. Numbered entries are populated with market names suited to the national administrative structure and research scope. Geographic share tables use one consistent, nonoverlapping set of areas.
Chapter 5. Japan Engineered Stone Cross-Border Trade & Market Access Analysis
- 5.1 National Trade & International Partner Overview
- 5.1.1 Export Value by Destination Country (2024)
- 5.1.2 Export Volume by Destination Country (2024) (Where Applicable)
- 5.1.3 Import Value by Source Country (2024)
- 5.1.4 Import Volume by Source Country (2024) (Where Applicable)
- 5.1.5 National & Partner-Country Trade Balances (2024)
- 5.2 Export Analysis – Segment
- 5.2.1 Category 1 (Applicable Classification Code)
- 5.2.2 Category 2 (Applicable Classification Code)
- 5.2.3 Category 3 (Applicable Classification Code)
- 5.2.4 Category 4 (Applicable Classification Code)
- 5.2.5 Category 5 (Applicable Classification Code)
- 5.3 Import Analysis – Segment
- 5.3.1 Category 1 (Applicable Classification Code)
- 5.3.2 Category 2 (Applicable Classification Code)
- 5.3.3 Category 3 (Applicable Classification Code)
- 5.3.4 Category 4 (Applicable Classification Code)
- 5.3.5 Category 5 (Applicable Classification Code)
- 5.4 Cross-Border Pricing & Transaction Benchmarks
- 5.4.1 Export Pricing – Segment & Destination Country
- 5.4.2 Import Pricing – Segment & Source Country
- 5.4.3 Price Trends (2024)
- 5.5 Key Cross-Border Trade & Delivery Routes
- 5.5.1 Cross-Border Trade/Delivery Route 1
- 5.5.2 Cross-Border Trade/Delivery Route 2
- 5.5.3 Cross-Border Trade/Delivery Route 3
- 5.5.4 Cross-Border Trade/Delivery Route 4
- 5.5.5 Cross-Border Trade/Delivery Route 5
- 5.6 Trade Policy & Market Access Impact Assessment
- 5.6.1 Tariff & Non-Tariff Barriers
- 5.6.2 National Participation in Regional Trade & Economic Frameworks
- 5.6.3 Bilateral & Multilateral Trade Agreements
- 5.6.4 Cross-Border Operating, Licensing & Localization Requirements
Note: This chapter covers international trade relevant to Japan Engineered Stone in the selected country. Exports are analyzed by destination and imports by source. Domestic interregional flows are excluded from international trade totals. Goods, services, and digital offerings use applicable classifications; volume and route analyses apply only where meaningful.
Chapter 6. Competitive Landscape & Company Benchmarking
- 6.1 Japan Engineered Stone Concentration & Structure
- 6.1.1 Herfindahl-Hirschman Index (HHI) – vs. 2024
- 6.1.2 Leading, Mid-Sized & Emerging Player Structure
- 6.1.3 Multinational, National & Local Player Dynamics
- 6.2 Japan Engineered Stone Share Analysis – 2024
- 6.2.1 National Revenue Share by Company
- 6.2.2 National Volume Share by Company (Volume Where Applicable)
- 6.2.3 Company Revenue Share by Subnational Area
- 6.2.4 Market Share Evolution ( vs. 2024)
- 6.2.5 Company Market Share by Key Segment
- 6.2.6 Company Market Share by Customer Group
- 6.3 Operating Scale, Capacity & Infrastructure Analysis
- 6.3.1 National Operating Scale & Supply Capacity
- 6.3.2 Resource Utilization & Operating Efficiency
- 6.3.3 Output, Service Delivery & Activity Metrics
- 6.3.4 Operating Footprint & Infrastructure Map
- 6.3.5 Planned Operational & Capacity Expansion
- 6.4 Japan Engineered Stone Competitive Benchmarking Matrix
- 6.4.1 Revenue, Growth, Profitability & Operating Metric Comparison
- 6.4.2 Channel Revenue Mix
- 6.4.3 Revenue Exposure Across Domestic Markets
- 6.4.4 R&D Intensity
- 6.4.5 Sustainability Maturity
- 6.5 Strategic Developments in Japan Engineered Stone (Last 24 Months)
- 6.5.1 Mergers, Acquisitions & Divestments
- 6.5.2 New Products, Services & Solutions in Japan Engineered Stone
- 6.5.3 Operational & Infrastructure Expansions
- 6.5.4 Strategic Alliances, Joint Ventures & Partnerships
- 6.5.5 Distribution Expansion & Market Entry
- 6.5.6 Sustainability & ESG Initiatives
- 6.6 Competitive Strategy Mapping
- 6.6.1 Leader, Challenger, Follower & Niche Classification
- 6.6.2 Pricing Strategy Comparison
- 6.6.3 Channel Strategy Matrix
Note: Strategic developments are included based on their materiality and the availability of reliable information.
Chapter 7. Japan Engineered Stone – By Sales & Delivery Channel
- 7.1 Segment Overview
- 7.1.1 Volume & Revenue Split by Channel (2024 & 2032) (Volume Where Applicable)
- 7.1.2 Channel Mix Evolution (2024-2032)
Chapter 8. Subnational Market Analysis – Country Overview
- 8.1 Domestic Geographic Market Overview
- 8.1.1 Subnational Volume Share (Where Applicable)
- 8.1.2 Subnational Revenue Share
- 8.1.3 Market Volume by Subnational Area (Where Applicable)
- 8.1.4 Market Revenue by Subnational Area
- 8.1.5 Subnational Forecasts Through 2032
- 8.2 Cross-Area Segment Analysis Within the Country
- 8.2.1 By Sales & Delivery Channel
- 8.2.2 By Competitive Positioning & Price Tier
Chapter 9. Japan Engineered Stone – Priority Domestic Market 1
Chapter 10. Japan Engineered Stone – Priority Domestic Market 2
Chapter 11. Japan Engineered Stone – Priority Domestic Market 3
Chapter 12. Japan Engineered Stone – Priority Domestic Market 4
Chapter 13. Japan Engineered Stone Company Profiles
- 13.1 [Company 01]
- 13.1.1 Company Overview
- 13.1.2 Key Management Personnel
- 13.1.3 Products & Services Portfolio
- 13.1.4 Financial Performance
- 13.1.5 Domestic Market Focus & Local Operating Presence
- 13.1.6 Recent Developments & Strategic Initiatives
Note: The company profile list is preliminary and may change based on research findings, market developments, data availability, and client requirements.
Chapter 14. Appendices
- Appendix A – List of Abbreviations & Acronyms
- Appendix B – Industry Classification Code Reference – Full Series
- Appendix C – Supply, Output & Operating Capacity Data Tables
- Appendix D – End-Use & Demand Base Tables
- Appendix E – Demand, Adoption & Usage Assumptions
- Appendix F – Pricing & Revenue Metric Reference Tables
- Appendix G – Company Operations & Infrastructure Database
- Appendix H – Cross-Border Trade & Activity Data Tables (Where Applicable)
- Appendix I – Regulatory Summary Tables
- Appendix J – Primary Research Participant List (Anonymized)
- Appendix K – Primary Research Questionnaire Framework
- Appendix L – Data Sources & Bibliography
- Appendix M – Market Size Divergence & Source Comparison
Chapter 15. Research Methodology
- 15.1 Research Framework & Philosophy
- 15.2 Secondary Research – Sources, Hierarchy & Data Extraction
- 15.3 Data Modeling – National Market Sizing & Subnational Allocation
- 15.4 Primary Research – Stakeholder Framework, LOI & Sample Sizes
- 15.5 Forecast Methodology – Regression, Scenario & Sensitivity Analysis
- 15.6 Quality Control – Four-Layer Validation Framework
- 15.7 Limitations & Standard Assumptions
- 15.8 Disclaimer
