Market Overview
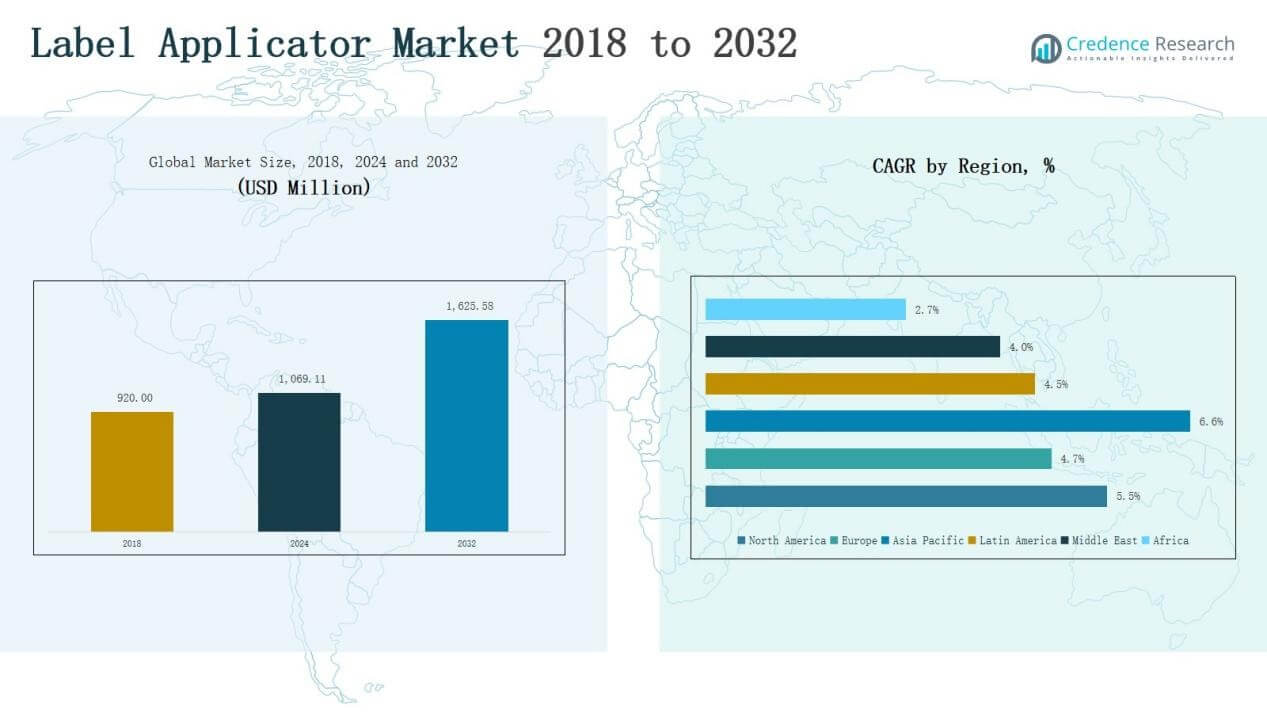
Label Applicator Market size was valued at USD 920.00 million in 2018, reaching USD 1,069.11 million in 2024, and is anticipated to reach USD 1,625.58 million by 2032, at a CAGR of 5.45% during the forecast period (2024–2032).
| REPORT ATTRIBUTE |
DETAILS |
| Historical Period |
2020-2023 |
| Base Year |
2024 |
| Forecast Period |
2025-2032 |
| Label Applicator Market Size 2024 |
USD 1,069.11 Million |
| Label Applicator Market, CAGR |
5.45% |
| Label Applicator Market Size 2032 |
USD 1,625.58 Million |
The label applicator market is shaped by key players such as ProMach, Herma GmbH, Accraply (a Barry-Wehmiller company), Nita Labeling Systems, Krones AG, CTM Labeling Systems, Aesus Packaging Systems, Worldpack Automation, Videojet Technologies, and Label-Aire. These companies maintain competitive strength through advanced automation technologies, diversified product portfolios, and strong distribution networks. Many focus on integrating IoT-enabled solutions and sustainability-driven innovations to meet evolving industry demands. Regionally, North America led the market in 2024 with a 34% share, driven by early adoption of automated labeling systems, strong regulatory compliance, and established manufacturing infrastructure.
Market Insights
- The Label Applicator Market grew from USD 920.00 million in 2018 to USD 1,069.11 million in 2024, and is forecasted to reach USD 1,625.58 million by 2032.
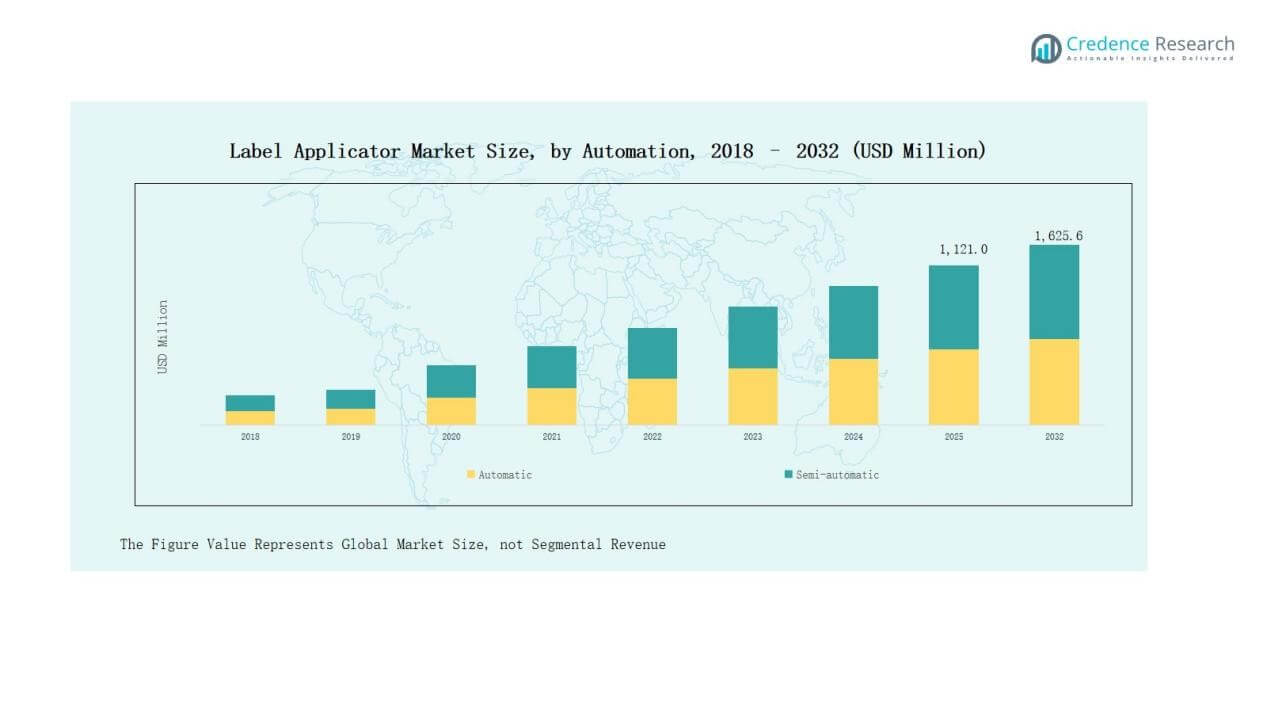
- Automatic label applicators dominated with 68% share in 2024, driven by strong demand in food, beverage, and pharmaceutical industries, while semi-automatic systems held a 32% share.
- Linear machines accounted for 61% share in 2024 due to cost efficiency and adaptability, whereas rotary machines captured 39% share, supported by high-speed beverage and pharmaceutical labeling.
- Label applicators operating at 71–120 products/min led with 37% share in 2024, followed by up to 70 products/min at 25%, 121–150 at 20%, and above 150 at 18%.
- North America led the global market with a 34% share in 2024, while Asia Pacific followed at 29.3% with the fastest growth, supported by industrialization and expanding packaged goods demand.
Access crucial information at unmatched prices!
Request your sample report today & start making informed decisions powered by Credence Research Inc.!
Download Sample
Market Segment Insights
By Automatic Segment
The automatic segment accounted for 68% share of the label applicator market in 2024, establishing itself as the dominant category. Its growth is driven by rising demand for high-speed, error-free labeling solutions in food, beverage, and pharmaceutical industries. Automatic applicators reduce labor dependency and enhance productivity, which makes them the preferred choice for large-scale manufacturing units. The semi-automatic segment, holding 32% share, continues to serve small and medium enterprises where flexibility and lower upfront investment are prioritized.
For instance, Herma GmbH introduced its 500 Label Applicator with a servo-driven control system, designed to handle up to 200 labels per minute for pharmaceutical packaging lines.
By Machine Segment
The linear segment held a 61% share in 2024, dominating the machine type segment due to its suitability for handling diverse packaging formats at cost-effective rates. Linear applicators are widely adopted in industries with moderate to high production volumes, offering easier setup and maintenance. The rotary segment, with a 39% share, caters to high-capacity production environments, especially in beverages and pharmaceuticals, where precision and speed are critical. Increasing investment in advanced rotary systems indicates steady growth potential within this sub-segment.
For instance, Krones AG introduced its Modulpal Pro linear palletizing system designed for flexible packaging operations, emphasizing efficiency with reduced setup time.
By Operating Speed Segment
Label applicators operating at 71 to 120 products/min captured the largest share of 37% in 2024. This speed range provides an optimal balance of efficiency, accuracy, and affordability, making it attractive for food and personal care packaging lines. The up to 70 products/min segment accounted for 25% share, primarily serving SMEs and low-volume applications. Applicators with 121 to 150 products/min held a 20% share, gaining traction in sectors requiring mid-to-high throughput. The above 150 products/min sub-segment commanded 18% share, driven by large beverage and pharmaceutical plants prioritizing ultra-high-speed automated solutions.
 Key Growth Drivers
Rising Automation in Packaging Lines
The shift toward automated packaging solutions is a primary driver for the label applicator market. Manufacturers across food, beverage, and pharmaceutical sectors are adopting automated systems to reduce labor dependency, improve precision, and enhance throughput. Automatic label applicators deliver consistent performance and minimize operational errors, which directly supports compliance with labeling standards. Growing investments in smart factories and Industry 4.0 initiatives further accelerate the integration of these solutions, strengthening demand across developed and emerging economies.
For instance, Domino Printing Sciences launched its Mx-Series automated label applicators, designed for high-speed food and beverage packaging lines, enabling consistent labeling at up to 500 products per minute.
Expanding Demand in Food and Beverage Sector
Food and beverage applications account for a significant share of label applicator installations. Increasing consumption of packaged food, coupled with strict regulations for product labeling, fuels the demand for efficient labeling machines. Automatic applicators allow manufacturers to handle diverse packaging formats such as bottles, cans, and pouches with speed and accuracy. Rising consumer preference for branded and visually appealing packaging adds further momentum. This expanding demand positions the sector as a consistent growth driver for the market.
For instance, Multivac expanded its portfolio with the L 310 full wrap labeller for bakery products, designed to apply labels that also act as tamper-evident seals while enabling full branding coverage.
Stringent Labeling and Traceability Regulations
Global regulatory frameworks on labeling compliance and traceability continue to drive market adoption. Pharmaceutical and healthcare industries, in particular, require accurate placement of labels with barcodes and product information to meet safety standards. Governments are enforcing strict labeling rules to ensure consumer transparency and product authentication. Label applicators help businesses achieve compliance while maintaining efficiency and reducing manual errors. This regulatory push compels industries to invest in advanced labeling systems, thereby fueling market expansion.
 Key Trends & Opportunities
Integration of Smart and IoT-Enabled Labeling Systems
A key trend shaping the market is the adoption of IoT-enabled and smart label applicators. These systems provide real-time monitoring, predictive maintenance, and seamless integration with enterprise resource planning (ERP) platforms. Manufacturers benefit from enhanced efficiency and reduced downtime, while ensuring data-driven decision-making. With packaging lines moving toward digitization, IoT-enabled solutions present strong opportunities for vendors to differentiate offerings. This trend is expected to gain traction in high-output industries seeking precision and connected production environments.
For instance, Videojet Technologies launched the 9560 Label Print & Apply System, designed with advanced sensor connectivity and integration into MES/ERP platforms, allowing manufacturers to cut changeover times by 50%.
Growth in E-commerce and Logistics Sector
The rapid rise of e-commerce and global logistics creates new opportunities for label applicator adoption. Shipping and logistics companies increasingly rely on automated labeling systems to process high parcel volumes accurately and efficiently. Label applicators streamline operations by enabling fast barcode and shipping label application, reducing errors and turnaround times. With cross-border trade and last-mile delivery expanding, demand for advanced and high-speed labeling solutions in logistics centers is projected to remain strong over the forecast period.
For instance, Weber Marking introduced the Legi-Air 6000, a labeling machine designed specifically for e-commerce logistics that can apply up to 2400 shipping labels per hour with high precision, improving speed and reducing errors in parcel handling.
Key Challenges
High Initial Capital Investment
One of the key challenges restraining market growth is the high upfront cost of advanced label applicators. Small and medium-sized enterprises (SMEs) often find it difficult to invest in automated or rotary systems due to budget constraints. While automation reduces long-term costs, the initial expense for installation, integration, and operator training remains significant. This cost barrier leads many smaller players to rely on semi-automatic systems or manual labeling, which limits adoption in cost-sensitive regions.
Maintenance and Operational Complexity
Advanced label applicators, especially those with IoT integration or high-speed capacity, require specialized maintenance and skilled operators. Complex systems can lead to operational downtime if not managed properly, creating production delays and added costs. Regular calibration and spare part availability also contribute to higher lifecycle expenses. For companies with limited technical expertise, these challenges can undermine the efficiency benefits of automation. As a result, maintenance complexity remains a hurdle in widespread adoption.
Compatibility with Diverse Packaging Formats
The growing variety of packaging formats poses a challenge for manufacturers. Label applicators must handle different container shapes, sizes, and materials such as bottles, cartons, or flexible pouches. Achieving versatility without compromising speed or accuracy is technically demanding and often requires costly customization. Businesses operating across multiple product categories face difficulties in standardizing labeling systems. Limited adaptability can discourage investment in advanced systems, especially in industries where packaging innovation is frequent.
Regional Analysis
North America
North America accounted for 34.5% share in 2018, holding USD 317.40 million, and is projected to reach USD 552.86 million by 2032, with a CAGR of 5.5%. In 2024, the region retained a 34% share at USD 364.13 million. Growth is driven by early adoption of automation technologies, strong demand from packaged food and pharmaceuticals, and a mature manufacturing sector. The U.S. leads regional adoption due to advanced production facilities and stringent labeling regulations. Increasing investments in smart factories further strengthen North America’s leadership in the market.
Europe
Europe represented 25.7% share in 2018 with USD 236.44 million and is expected to expand to USD 378.36 million by 2032, at a CAGR of 4.7%. In 2024, it maintained 24.7% share, valued at USD 263.83 million. The region benefits from robust regulatory compliance on labeling standards and high adoption across food, beverages, and personal care industries. Germany, France, and the UK remain major markets due to advanced packaging technologies. Growing sustainability initiatives in packaging are also driving investments in modern, energy-efficient label applicators across European markets.
Asia Pacific
Asia Pacific held 28.2% share in 2018 at USD 259.81 million and is projected to reach USD 519.70 million by 2032, growing at the highest CAGR of 6.6%. By 2024, the region reached USD 313.51 million with 29.3% share, surpassing Europe in growth pace. China, India, and Japan dominate due to expanding manufacturing capacity, rising packaged food consumption, and booming pharmaceutical production. Rapid industrialization, urbanization, and investments in automation continue to position Asia Pacific as the fastest-growing region for label applicators.
Latin America
Latin America accounted for 6.2% share in 2018 with USD 57.32 million and is forecasted to reach USD 92.93 million by 2032, at a CAGR of 4.5%. In 2024, the region posted USD 65.95 million with a 6.1% share. Brazil and Mexico lead demand due to expanding consumer goods and beverage industries. Despite economic volatility, increasing investment in modern packaging solutions supports steady adoption. Growth opportunities are emerging in e-commerce and logistics, where efficient labeling systems are increasingly required to streamline operations.
Middle East
The Middle East market represented 3.5% share in 2018 at USD 32.38 million and is projected to grow to USD 47.64 million by 2032, at a CAGR of 4.0%. In 2024, the region reached USD 35.06 million with 3.3% share. GCC countries drive demand through food, beverages, and pharmaceuticals, supported by strong retail expansion. Modernization of manufacturing facilities and rising investments in logistics hubs are boosting demand for automated labeling systems. However, adoption remains concentrated in a few high-growth countries, limiting regional scale.
Africa
Africa accounted for 1.8% share in 2018 with USD 16.65 million and is forecast to reach USD 34.09 million by 2032, at a CAGR of 2.7%, the slowest among all regions. In 2024, the market stood at USD 26.63 million with 2.5% share. Growth is supported by gradual industrialization, expanding food processing, and pharmaceuticals in South Africa, Egypt, and Nigeria. However, limited technological adoption, high capital costs, and infrastructure challenges continue to constrain faster growth, keeping Africa a smaller yet emerging market for label applicators.
 Market Segmentations:
By Automatic Segment
By Machine Segment
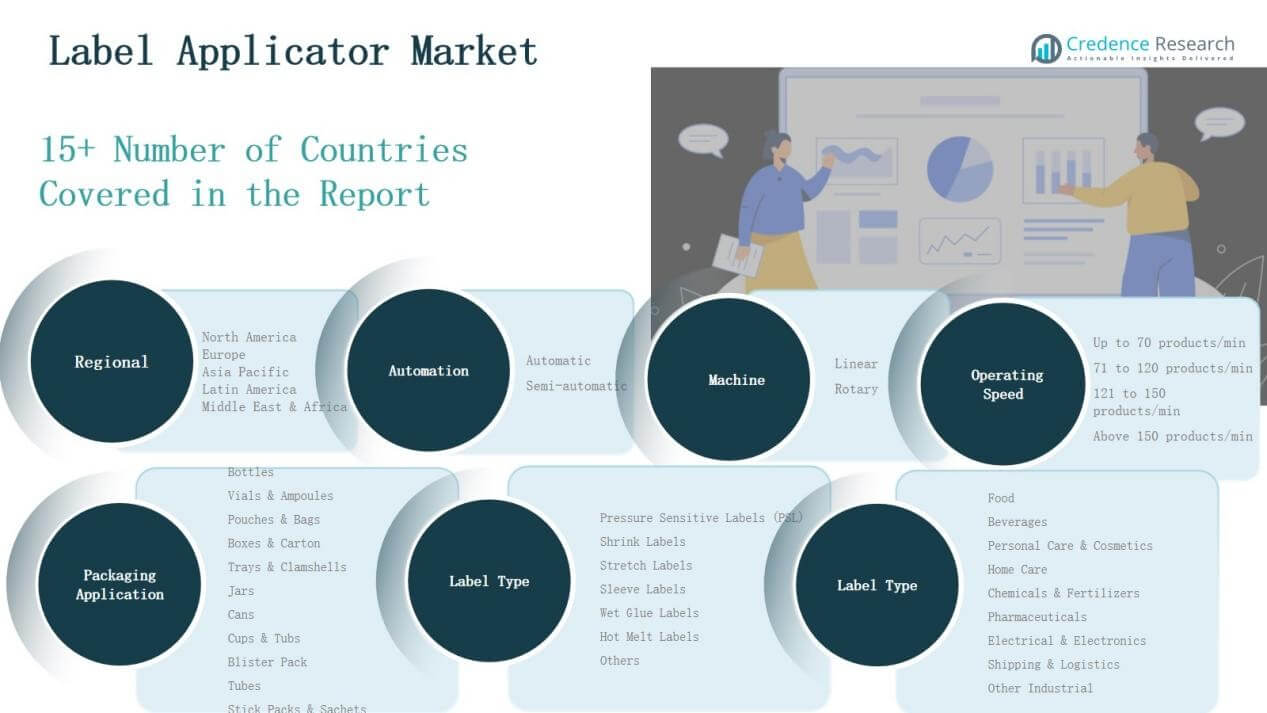
By Operating Speed Segment
- Up to 70 products/min
- 71 to 120 products/min
- 121 to 150 products/min
- Above 150 products/min
By Packaging Application Segment
- Bottles
- Vials & Ampoules
- Pouches & Bags
- Boxes & Carton
- Trays & Clamshells
- Jars
- Cans
- Cups & Tubs
- Blister Pack
- Tubes
- Stick Packs & Sachets
By Label Type Segment
By End Use Segment
- Food
- Beverages
- Personal Care & Cosmetics
- Home Care
- Chemicals & Fertilizers
- Pharmaceuticals
- Electrical & Electronics
- Shipping & Logistics
- Other Industrial
By Region
- North America
- Europe
- UK
- France
- Germany
- Italy
- Spain
- Russia
- Rest of Europe
- Asia Pacific
- China
- Japan
- South Korea
- India
- Australia
- Southeast Asia
- Rest of Asia Pacific
- Latin America
- Brazil
- Argentina
- Rest of Latin America
- Middle East
- GCC Countries
- Israel
- Turkey
- Rest of Middle East
- Africa
- South Africa
- Egypt
- Rest of Africa
Competitive Landscape
The competitive landscape of the label applicator market is characterized by a mix of global leaders and regional players focusing on innovation, efficiency, and customization. Key companies such as ProMach, Herma GmbH, Accraply (a Barry-Wehmiller company), Nita Labeling Systems, and Krones AG maintain strong market positions through advanced product portfolios and global distribution networks. These players emphasize automation, precision labeling technologies, and integration with digital and IoT-enabled packaging lines to meet growing demand across industries. Mid-sized firms including CTM Labeling Systems, Worldpack Automation, and Aesus Packaging Systems target niche markets by offering cost-effective and flexible solutions for SMEs. Competition is further intensified by continuous investments in R&D, strategic partnerships, and expansion into emerging markets such as Asia Pacific and Latin America. Sustainability also plays a key role, with leading companies developing energy-efficient and eco-friendly applicators to align with regulatory frameworks and rising consumer preferences for sustainable packaging practices.
Shape Your Report to Specific Countries or Regions & Enjoy 30% Off!
Key Players
- ProMach, Inc.
- Herma GmbH
- Advanced Labeling Technologies
- Accraply, a Barry-Wehmiller company
- Nita Labeling Systems
- Accutek Packaging Equipment Company, Inc.
- Advent Label Applicator Co
- CTM Labeling Systems
- Krones AG
- ILTI s.r.l.
- Aesus Packaging Systems Inc.
- Nautilus Systems Inc.
- Worldpack Automation Systems PVT. LTD.
- Phoenix Italia S.r.l.
- B & H Labeling Systems
- Videojet Technologies, Inc.
- Primera Technology, Inc.
- Label-Aire, Inc.
- Alpha-Pack Group
- Etisoft Sp. z o.o.
Recent Developments
- In January 2025, cab Produkttechnik GmbH launched its HQ applicators compatible with Hermes Q printers and introduced the HERMES QL linerless print-and-apply solution.
- In February 2024, Primera Technology, Inc. introduced the AP380 Label Applicator, which runs 30% faster than earlier models and features a liner rewinder.
- In March 2025, ProMach’s ID Technology acquired KelCode Solutions to strengthen its marking, coding, and labeling solutions portfolio in North America.
- In March 2025, Crestview Partners acquired Smyth Companies, expanding its presence in labels and custom packaging solutions.
Report Coverage
The research report offers an in-depth analysis based on Type, Distribution Channel and Region. It details leading market players, providing an overview of their business, product offerings, investments, revenue streams, and key applications. Additionally, the report includes insights into the competitive environment, SWOT analysis, current market trends, as well as the primary drivers and constraints. Furthermore, it discusses various factors that have driven market expansion in recent years. The report also explores market dynamics, regulatory scenarios, and technological advancements that are shaping the industry. It assesses the impact of external factors and global economic changes on market growth. Lastly, it provides strategic recommendations for new entrants and established companies to navigate the complexities of the market.
Future Outlook
- Demand for automatic label applicators will continue to outpace semi-automatic systems.
- Food and beverage industries will remain the leading adopters of labeling solutions.
- Asia Pacific will strengthen its position as the fastest-growing regional market.
- IoT-enabled and smart label applicators will see wider industrial integration.
- Sustainability initiatives will drive development of energy-efficient labeling systems.
- Pharmaceutical labeling demand will rise with stricter global compliance regulations.
- E-commerce and logistics sectors will increase investments in high-speed applicators.
- Rotary applicators will gain traction in large-scale, high-output production environments.
- Customizable and versatile solutions will attract SMEs in emerging economies.
- Strategic partnerships and acquisitions will shape competitive positioning among key players.


