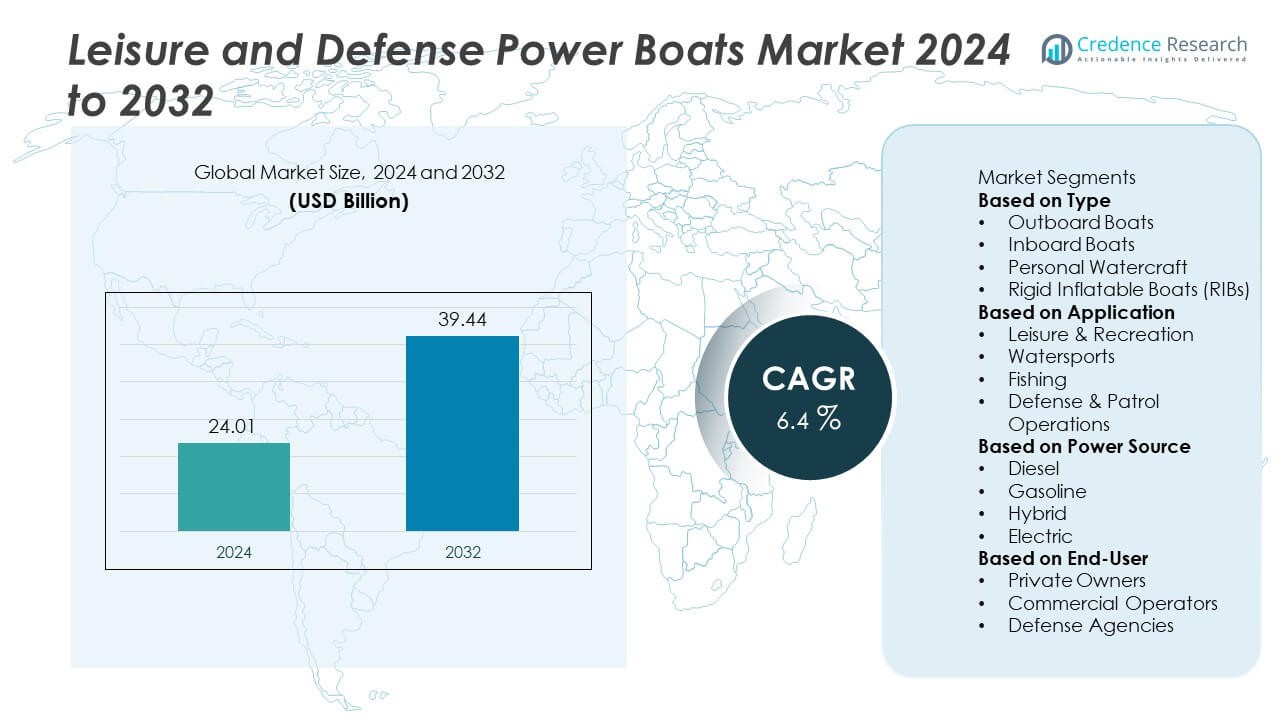
Home » Aerospace & defense » Leisure and Defense Power Boats Market

Global Leisure and Defense Power Boats Market By Propulsion (Outboard Boats, Inboard & Sterndrive Boats, and Sailboats) By Boat Size (Up to 20 Ft., 21 Ft. to 35 Ft., and 36 Ft. to 50 Ft.) By Engine (Diesel, Electric, and Solar) By Horsepower (Up to 250 HP, 250 HP to 500 HP, and Above 500 HP) By Application (Leisure, Fishing, Transportation, Sports, Travel & Tourism, Defense, Military, Police Patrol, and Others) Growth, Future Prospects & Competitive Analysis, 2016 – 2030

Price: $4999

Published: | Report ID: 16204 | Report Format : PDF

Key Highlights of the report

How are the major segments performing in the Leisure and Defense Power Boats market?

  • In 2022, the outboard boat propulsion segment accounted for the largest global market revenue share. Outboard engines provide high efficiency and speed, making them popular among boaters who value agility and speed. Using lightweight materials and sophisticated technologies has also improved the efficiency and performance of outboard engines.
  • In 2022, the 36- to 50 ft. boat size segment was projected to hold a major share of the global leisure and defense power boats market. Boats in this size range provide plenty of room for passengers and amenities, making them a popular choice for recreational boaters who value comfort and luxury. They frequently have larger cabins, more storage areas, and sophisticated entertainment and navigation systems.
  • In 2022, the diesel engine segment accounted for the largest market share and was estimated to grow at the fastest CAGR in the forecast period. Diesel engines are known for their superior fuel efficiency compared to gasoline engines, making them a popular option for boaters prioritizing fuel economy and range. This is especially essential for commercial and military applications where boats must travel long distances.
  • The above 500 hp segment dominated the global leisure and defense power boats market share in 2022. Boats with engines that produce more than 500 horsepower provide exceptional speed and acceleration, making them a popular option among boaters who value efficiency and speed. This is especially essential in high-performance applications such as powerboat racing.
  • In 2022, the defense application segment accounted for the largest global market revenue share. Powerboats in defense applications are essential for national security because they are frequently used for patrolling, surveillance, and border protection. Defense powerboat demand is expected to remain high as countries prioritize their national security interests globally.

Which region dominated the leisure and defense power boats market?

In 2022, North America region was anticipated to hold a major share of the global leisure and defense power boats market. Rising demand for leisure water sports in the region and government support for the recreational boat sector are driving the market growth. The growing interest in water sports and fishing competitions creates lucrative development possibilities for the regional market. A shift in boat usage trends from long vacations to short day trips and weekends contributes to increasing demand for recreational boats in the United States and Canada. Similarly, regional government defense expenditures can positively impact military and naval power boat demand.

Design Element 2

Access crucial information at unmatched prices!

Request your free sample report today & start making informed decisions powered by Credence Research!

Download Free Sample
CTA Design Element 3

How is US Market Performing in the leisure and defense power boats market?

North America currently leads the global leisure and defense powerboat market, with the United States accounting for the largest revenue share. The leisure power boat market in the United States has been gradually growing due to rising disposable income, improved economic conditions, and increased interest in recreational boating activities. On the other hand, the US defense powerboat market has been performing well due to increased defense spending and a growing need for naval defense capabilities. The US Navy, in particular, has been investing in creating advanced power boats, such as high-speed attack boats and unmanned surface vessels, to improve its operational powers.

How is the economy impacting the global leisure and defense power boats market growth?

Various economic factors influence the development of the global leisure and defense power boats market. During a recession, for example, consumers have less discretionary income, which can reduce demand for luxury items such as power boats. Higher interest rates can make financing more expensive, reducing demand and affecting power boats’ affordability. Trade, tariffs, recession, wages, and government policies can impact material and production costs, customer affordability, and global economic stability. Geopolitical tensions, such as the Russia-Ukraine conflict, also affect the market. These tensions cause global economic instability, lowering customer confidence and reducing demand for leisure goods like power boats.

What is the competitive environment of the leisure and defense power boats market?

The leisure and defense power boats market is extremely competitive, with numerous makers and suppliers seeking market dominance. Various factors impact the competitive environment, including technological advancements, shifting buyer preferences, and global economic conditions. Leisure and defense powerboat manufacturers are working to improve their goods and incorporate new technologies. For instance, Yamaha Marine Systems Company, a division of Yamaha Motor Corporation, acquired Siren Marine, a provider of IoT solutions for marine applications, in January 2022.

Executive Summary

What are the key trends in the Leisure and Defense Power Boats market?

  • Increasing demand for electric and hybrid power boats: Several factors drive the shift towards electric and hybrid power boats, including the need for a more environmentally friendly choice, government regulations, and technological advancements. These boats have benefits such as being quieter, emitting zero emissions, and being more fuel-efficient, making them an appealing choice for consumers. As a result, leisure and defense power boat manufacturers are investing in R&D to develop new and innovative electric and hybrid power boat models.

What are all the technical developments in the leisure and defense power boats market?

In recent years, several significant technological developments have occurred in the leisure and defense powerboat markets. Developing more efficient and environmentally friendly propulsion systems has been one of the most important. For instance, hybrid and electric power systems are gaining popularity as customers and governments look to cut emissions and boost fuel economy. Major advances have been in the defense industry’s design and capabilities of military and naval power boats. For example, there has been a tendency towards smaller, more agile vessels that can work in shallow waters and navigate narrow channels. The development of stealth technology has also helped vessels become less visible to radar and other types of surveillance equipment.

Which are the key investments by the leisure and defense power boats market players?

Companies in the leisure and defense power boats market invest in manufacturing and production facilities, focusing on improving efficiency, reducing costs, and increasing capacity. This involves adopting advanced manufacturing techniques like 3D printing, automation, robotics, supply chain management, and logistics investments. Key players also invest in mergers and acquisitions to expand their product offerings, geographic reach, or market share. For example, Groupe Beneteau, a French business specializing in recreational boats, purchased Starfisher for an undisclosed sum in October 2021. The acquisition improves Group Beneteau’s ability to establish a presence in Portugal, strengthen its position in the 25 to 35-foot powerboat market, and increase its production capacity for small motorboats. Starfisher is a Portuguese company that develops and manufactures motorboats.

Major global leisure and defense power boat market players are Groupe Beneteau, Brunswick Corporation, Marine Products Corporation, Carnival Corporation & Plc, Royal Caribbean Cruises Ltd, Norwegian Cruise Line Holdings Ltd, MCBC Holdings Inc, Malibu Boats Inc, Grand Banks Yachts Ltd, Porter Inc, Grady-White Boats Inc, Maverick Boat Group Inc, Correct Craft, Baja Marine, Pacific Asian Enterprises, Albemarle Boats, Yamaha Motors Co. Ltd, and Sunseeker International Limited.

What are the Major Driving Factors for the Leisure and Defense Power Boats Market?

The growing disposable income of end-consumers globally and the associated thriving tourism sector are some of the primary factors driving the demand for leisure power boats. People increasingly want to spend time with their families and friends at holiday homes and accommodations on the banks of a body of water, which drives up demand for leisure power boats in the global market. On the other hand, greater patrolling and search and rescue operations are driving up demand for defense power boats globally. As a result, the global leisure and defense power boats market is expected to grow considerably in the coming years.

What are the Major Risks for the Leisure and Defense Power Boats Market?

Leisure power boats can still be prohibitively expensive for some population segments, which will likely limit market development over the coming years. Also, expensive initial costs may hinder the future growth of the leisure and defense powerboat markets.

Which is the key application in the leisure and defense power boats market?

Over the forecast period, the defense segment will hold a substantial revenue share of the leisure and defense powerboats market. Powerboats in defense uses are critical for national security because they are frequently used for patrolling, surveillance, and border protection. Defense powerboat demand is expected to stay strong as countries prioritize their national security interests globally. Defense powerboats are frequently highly specialized and customized to satisfy specific requirements. This includes ballistic protection, sophisticated navigation and communication systems, and specialized weapons. Defense powerboat manufacturers spend heavily on advanced technologies and materials to improve their products’ speed, agility, and performance. This includes the development of autonomous and unmanned powerboats, which are anticipated to play an increasingly important role in future defense applications.

How is the leisure and defense power boats market performing in regions?

The Asia Pacific region is expected to experience the fastest growth in the global leisure and defense power boats market during the forecast period, owing to significant steps taken by the governments of several countries in the region to develop tourist activities. China’s leisure power boats market is expected to grow fastest during the forecast timeframe. The abundance of water resources in the country, such as the vast coastline, inland lakes, and rivers, can be attributed to the country’s market development. Also, the Chinese government’s efforts to promote yachting as a leisure pastime are expected to increase demand for recreational watercraft in the nation.

What is the regulatory landscape for the leisure and defense power boats market?

The regulatory environment for the leisure and defense power boat markets is complex and differs depending on location and intended use. Powerboat manufacturers must follow several laws and standards concerning safety, emissions, noise, vibration, electrical systems, and navigation equipment. Powerboats for military and law enforcement objectives must adhere to strict security, weapons systems, and other specialized equipment regulations. The International Maritime Organization recently updated its safety and pollution prevention regulations, which affect the leisure and defense power boat markets.

What does the Market Size of Leisure and Defense Power Boats regard as value?

The global leisure and defense power boats market is anticipated to grow at a substantial CAGR of 5.9% in the upcoming years. The global Leisure and Defense Power Boats industry was estimated to be worth USD 24165.2 million in 2022 and was expected to be worth USD 36096.25 million by 2028.

Leisure and Defense Power Boats Market

What are the major players planning for the future of the leisure and defense power boats market?

Shape Your Report to Specific Countries or Regions & Enjoy 30% Off!

Major players in the leisure and defense powerboat market focus on innovation, diversification, sustainability, and improving the customer experience as they seek to capitalize on new opportunities and manage the challenges of an evolving market. For example, in June 2021, Sunseeker, a UK-based company specializing in building luxury motor yachts, released their new 100 yachts with a main suite, private bow terrace, sunbathing hideaways, and opulent furnishings. The yacht is powered by MTU 12V 2000 M96X and MTU 16V 2000 M96L engines and can handle smaller jet boats for water sports. This new model includes industry-first features and entertainment options, such as an open-plan bow-to-stern entertainment flybridge and a king Stateroom with a private entrance to the bow terrace.

REPORT ATTRIBUTE DETAILS
Leisure and Defense Power Boats Market by Volume Yes
Leisure and Defense Power Boats Market by Value Yes
Leisure and Defense Power Boats Market, Tornado Analysis Yes
Leisure and Defense Power Boats Market, STAR Analysis Yes
Leisure and Defense Power Boats Market, SRC Analysis Yes
Leisure and Defense Power Boats Market, Import-Export Data Yes (On Demand)
Leisure and Defense Power Boats Market Pricing Analysis Yes (On Demand)
Leisure and Defense Power Boats Market Segment Analysis By Propulsion (Outboard Boats, Inboard & Sterndrive Boats, and Sailboats)

By Boat Size (Up to 20 Ft., 21 Ft. to 35 Ft., and 36 Ft. to 50 Ft.)

By Engine (Diesel, Electric, and Solar)

By Horsepower (Up to 250 HP, 250 HP to 500 HP, and Above 500 HP)

By Application (Leisure, Fishing, Transportation, Sports, Travel & Tourism, Defense, Military, Police Patrol, and Others)

Leisure and Defense Power Boats Market, Regional Analysis North America (US and Canada)

Europe (UK, Germany, Italy, Spain, France, and the Rest of Europe)

Asia Pacific (China, Japan, South Korea, India, South East Asia, and the Rest of Asia Pacific)

Latin America (Brazil, Mexico, and the Rest of Latin America)

Middle East and Africa (GCC Countries, South Africa, and the Rest of the Middle East and Africa)

Leisure and Defense Power Boats Market Key Companies Groupe Beneteau, Brunswick Corporation, Marine Products Corporation, Carnival Corporation & Plc, Royal Caribbean Cruises Ltd, Norwegian Cruise Line Holdings Ltd, MCBC Holdings Inc, Malibu Boats Inc, Grand Banks Yachts Ltd, Porter Inc, Grady-White Boats Inc, Maverick Boat Group Inc, Correct Craft, Baja Marine, Pacific Asian Enterprises, Albemarle Boats, Yamaha Motors Co. Ltd, and Sunseeker International Limited
Leisure and Defense Power Boats Market Competitive Landscape Market Share Analysis

Competitive Benchmarking

Key Players Market Positioning

Geographical Presence Analysis

Major Strategies Adopted

Segmentation of Global Leisure and Defense Power Boats Market-

Global Leisure and Defense Power Boats Market – By Propulsion

  • Outboard Boats
  • Inboard & Sterndrive Boats
  • Sailboats

Global Leisure and Defense Power Boats Market – By Boat Size

  • Up to 20 Ft.
  • 21 Ft. to 35 Ft.
  • 36 Ft. to 50 Ft.

Global Leisure and Defense Power Boats Market – By Engine

  • Diesel
  • Electric
  • Solar

Global Leisure and Defense Power Boats Market – By Horsepower

  • Up to 250 HP
  • 250 HP to 500 HP
  • Above 500 HP

Global Leisure and Defense Power Boats Market – By Application

  • Leisure
  • Fishing
  • Transportation
  • Sports
  • Travel & Tourism
  • Defense
  • Military
  • Police Patrol
  • Others

Global Leisure and Defense Power Boats Market – By Region

  • North America
    • The U.S.
    • Canada
  • Europe
    • Germany
    • France
    • The U.K.
    • Italy
    • Spain
    • Rest of Europe
  • Asia Pacific
    • China
    • Japan
    • India
    • South Korea
    • South-east Asia
    • Rest of Asia Pacific
  • Latin America
    • Brazil
    • Mexico
    • Rest of Latin America
  • Middle East & Africa
    • GCC Countries
    • South Africa
    • Rest of the Middle East and Africa

1. Preface
1.1. Report Description
1.1.1. Purpose of the Report
1.1.2. Target Audience
1.1.3. USP and Key Offerings
1.2. Research Scope
1.3. Research Methodology
1.3.1. Phase I – Secondary Research
1.3.2. Phase II – Primary Research
1.3.3. Phase III – Expert Panel Review
1.3.4. Approach Adopted
1.3.4.1. Top-Down Approach
1.3.4.2. Bottom-Up Approach
1.3.5. Assumptions
1.4. Market Introduction
1.5. Market Research Scope

2. Executive Summary
2.1. Market Snapshot: Global Leisure and Defense Power Boats Market
2.2. Global Leisure and Defense Power Boats Market, By Propulsion
2.3. Global Leisure and Defense Power Boats Market, By Boat Size
2.4. Global Leisure and Defense Power Boats Market, By Engine
2.5. Global Leisure and Defense Power Boats Market, By Horsepower
2.6. Global Leisure and Defense Power Boats Market, By Application
2.7. Global Leisure and Defense Power Boats Market, By Region
3. Market Dynamics & Factors Analysis
3.1. Introduction
3.1.1. Global Leisure and Defense Power Boats Market Value, 2017-2030, (US$ Mn))
3.1.2. Y-o-Y Growth Trend Analysis
3.2. Market Dynamics
3.2.1. Market Drivers
3.2.2. Market Restraints
3.2.3. Market Opportunities
3.2.4. Major Industry Challenges
3.3. Growth and Development Patterns
3.4. Investment Feasibility Analysis
3.5. Market Opportunity Analysis
3.5.1. Propulsion
3.5.2. Boat Size
3.5.3. Engine
3.5.4. Horsepower
3.5.5. Application
3.5.6. Geography

4. Premium Insights
4.1. STAR (Situation, Task, Action, Results) Analysis
4.2. Porter’s Five Forces Analysis
4.2.1. Threat of New Entrants
4.2.2. Bargaining Power of Buyers/Consumers
4.2.3. Bargaining Power of Suppliers
4.2.4. Threat of Substitute Types
4.2.5. Intensity of Competitive Rivalry
4.3. Key Market Trends
4.3.1. Demand Side Trends
4.3.2. Supply Side Trends
4.4. Value Chain Analysis
4.5. Technology Analysis
4.6. Analysis and Recommendations
4.7. Marketing Strategy Analysis
4.7.1. Direct Marketing
4.7.2. Indirect Marketing
4.7.3. Marketing Channel Development Trend

5. Market Positioning of Key Players, 2022
5.1. Company Market Share of Key Players, 2022
5.2. Competitive Benchmarking
5.3. Market Positioning of Key Vendors
5.4. Geographical Presence Analysis
5.5. Major Strategies Adopted by Key Players
5.5.1. Key Strategies Analysis
5.5.2. Mergers and Acquisitions
5.5.3. Partnerships
5.5.4. Product Launch
5.5.5. Geographical Expansion
5.5.6. Others

6. Economic Impact Analysis
6.1. Recession Impact
6.1.1. North America
6.1.2. Europe
6.1.3. Asia Pacific
6.1.4. Latin America
6.1.5. Middle East and Africa
6.2. Ukraine-Russia War Impact
6.2.1. North America
6.2.2. Europe
6.2.3. Asia Pacific
6.2.4. Latin America
6.2.5. Middle East and Africa
6.3. COVID-19 Impact Analysis
6.3.1. North America
6.3.2. Europe
6.3.3. Asia Pacific
6.3.4. Latin America
6.3.5. Middle East and Africa

7. Global Leisure and Defense Power Boats Market
7.1. Global Leisure and Defense Power Boats Market, by Propulsion, 2017-2030 (US$ Mn))
7.1.1. Overview
7.1.2. Global Leisure and Defense Power Boats Market, By Propulsion, 2022 vs 2030 (in%)
7.1.3. Global Leisure and Defense Power Boats Market, By Outboard Boats, 2017-2030 (US$ Mn))
7.1.4. Global Leisure and Defense Power Boats Market, By Inboard & Sterndrive Boats, 2017-2030 (US$ Mn))
7.1.5. Global Leisure and Defense Power Boats Market, By Sailboats, 2017-2030 (US$ Mn))
7.2. Global Leisure and Defense Power Boats Market, by Boat Size, 2017-2030 (US$ Mn))
7.2.1. Overview
7.2.2. Global Leisure and Defense Power Boats Market, By Boat Size, 2022 vs 2030 (in%)
7.2.3. Global Leisure and Defense Power Boats Market, By Up to 20 Ft., 2017-2030 (US$ Mn))
7.2.4. Global Leisure and Defense Power Boats Market, By 21 Ft. to 35 Ft., 2017-2030 (US$ Mn))
7.2.5. Global Leisure and Defense Power Boats Market, By 36 Ft. to 50 Ft., 2017-2030 (US$ Mn))
7.3. Global Leisure and Defense Power Boats Market, by Engine, 2017-2030 (US$ Mn))
7.3.1. Overview
7.3.2. Global Leisure and Defense Power Boats Market, By Engine, 2022 vs 2030 (in%)
7.3.3. Global Leisure and Defense Power Boats Market, By Diesel, 2017-2030 (US$ Mn))
7.3.4. Global Leisure and Defense Power Boats Market, By Electric, 2017-2030 (US$ Mn))
7.3.5. Global Leisure and Defense Power Boats Market, By Solar, 2017-2030 (US$ Mn))
7.4. Global Leisure and Defense Power Boats Market, by Horsepower, 2017-2030 (US$ Mn))
7.4.1. Overview
7.4.2. Global Leisure and Defense Power Boats Market, By Horsepower, 2022 vs 2030 (in%)
7.4.3. Global Leisure and Defense Power Boats Market, By Up to 250 HP, 2017-2030 (US$ Mn))
7.4.4. Global Leisure and Defense Power Boats Market, By 250 HP to 500 HP, 2017-2030 (US$ Mn))
7.4.5. Global Leisure and Defense Power Boats Market, By Above 500 HP, 2017-2030 (US$ Mn))
7.5. Global Leisure and Defense Power Boats Market, by Application, 2017-2030 (US$ Mn))
7.5.1. Overview
7.5.2. Global Leisure and Defense Power Boats Market, By Application, 2022 vs 2030 (in%)
7.5.3. Global Leisure and Defense Power Boats Market, By Leisure, 2017-2030 (US$ Mn))
7.5.4. Global Leisure and Defense Power Boats Market, By Fishing, 2017-2030 (US$ Mn))
7.5.5. Global Leisure and Defense Power Boats Market, By Transportation, 2017-2030 (US$ Mn))
7.5.6. Global Leisure and Defense Power Boats Market, By Sports, 2017-2030 (US$ Mn))
7.5.7. Global Leisure and Defense Power Boats Market, By Travel & Tourism, 2017-2030 (US$ Mn))
7.5.8. Global Leisure and Defense Power Boats Market, By Defense, 2017-2030 (US$ Mn))
7.5.9. Global Leisure and Defense Power Boats Market, By Military, 2017-2030 (US$ Mn))
7.5.10. Global Leisure and Defense Power Boats Market, By Police Patrol, 2017-2030 (US$ Mn))
7.5.11. Global Leisure and Defense Power Boats Market, By Others, 2017-2030 (US$ Mn))

8. North America Leisure and Defense Power Boats Market Analysis
8.1. North America Leisure and Defense Power Boats Market, by Propulsion, 2017-2030(US$ Mn))
8.1.1. Overview
8.1.2. SRC Analysis
8.2. North America Leisure and Defense Power Boats Market, by Boat Size, 2017-2030(US$ Mn))
8.2.1. Overview
8.2.2. SRC Analysis
8.3. North America Leisure and Defense Power Boats Market, by Engine, 2017-2030(US$ Mn))
8.3.1. Overview
8.3.2. SRC Analysis
8.4. North America Leisure and Defense Power Boats Market, by Horsepower, 2017-2030(US$ Mn))
8.4.1. Overview
8.4.2. SRC Analysis
8.5. North America Leisure and Defense Power Boats Market, by Application, 2017-2030(US$ Mn))
8.5.1. Overview
8.5.2. SRC Analysis
8.6. North America Leisure and Defense Power Boats Market, by Country, 2017-2030 (US$ Mn))
8.6.1. U.S.
8.6.1.1. U.S. Leisure and Defense Power Boats Market Estimates and Forecast, 2017-2030 (US$ Mn))
8.6.1.2. U.S. Leisure and Defense Power Boats, By Propulsion, 2017-2030 (US$ Mn))
8.6.1.3. U.S. Leisure and Defense Power Boats, By Boat Size, 2017-2030 (US$ Mn))
8.6.1.4. U.S. Leisure and Defense Power Boats, By Engine, 2017-2030 (US$ Mn))
8.6.1.5. U.S. Leisure and Defense Power Boats, By Horsepower, 2017-2030 (US$ Mn))
8.6.1.6. U.S. Leisure and Defense Power Boats, By Application, 2017-2030 (US$ Mn))
8.6.2. Canada
8.6.2.1. Canada Leisure and Defense Power Boats Market Estimates and Forecast, 2017-2030 (US$ Mn))
8.6.2.2. Canada Leisure and Defense Power Boats, By Propulsion, 2017-2030 (US$ Mn))
8.6.2.3. Canada Leisure and Defense Power Boats, By Boat Size, 2017-2030 (US$ Mn))
8.6.2.4. Canada Leisure and Defense Power Boats, By Engine, 2017-2030 (US$ Mn))
8.6.2.5. Canada Leisure and Defense Power Boats, By Horsepower, 2017-2030 (US$ Mn))
8.6.2.6. Canada Leisure and Defense Power Boats, By Application, 2017-2030 (US$ Mn))

9. Europe Leisure and Defense Power Boats Market Analysis
9.1. Europe Leisure and Defense Power Boats Market, by Propulsion, 2017-2030(US$ Mn))
9.1.1. Overview
9.1.2. SRC Analysis
9.2. Europe Leisure and Defense Power Boats Market, by Boat Size, 2017-2030(US$ Mn))
9.2.1. Overview
9.2.2. SRC Analysis
9.3. Europe Leisure and Defense Power Boats Market, by Engine, 2017-2030(US$ Mn))
9.3.1. Overview
9.3.2. SRC Analysis
9.4. Europe Leisure and Defense Power Boats Market, by Horsepower, 2017-2030(US$ Mn))
9.4.1. Overview
9.4.2. SRC Analysis
9.5. Europe Leisure and Defense Power Boats Market, by Application, 2017-2030(US$ Mn))
9.5.1. Overview
9.5.2. SRC Analysis
9.6. Europe Leisure and Defense Power Boats Market, by Country, 2017-2030 (US$ Mn))
9.6.1. Germany
9.6.1.1. Germany Leisure and Defense Power Boats Market Estimates and Forecast, 2017-2030 (US$ Mn))
9.6.1.2. Germany Leisure and Defense Power Boats, By Propulsion, 2017-2030 (US$ Mn))
9.6.1.3. Germany Leisure and Defense Power Boats, By Boat Size, 2017-2030 (US$ Mn))
9.6.1.4. Germany Leisure and Defense Power Boats, By Engine, 2017-2030 (US$ Mn))
9.6.1.5. Germany Leisure and Defense Power Boats, By Horsepower, 2017-2030 (US$ Mn))
9.6.1.6. Germany Leisure and Defense Power Boats, By Application, 2017-2030 (US$ Mn))
9.6.2. France
9.6.2.1. France Leisure and Defense Power Boats Market Estimates and Forecast, 2017-2030 (US$ Mn))
9.6.2.2. France Leisure and Defense Power Boats, By Propulsion, 2017-2030 (US$ Mn))
9.6.2.3. France Leisure and Defense Power Boats, By Boat Size, 2017-2030 (US$ Mn))
9.6.2.4. France Leisure and Defense Power Boats, By Engine, 2017-2030 (US$ Mn))
9.6.2.5. France Leisure and Defense Power Boats, By Horsepower, 2017-2030 (US$ Mn))
9.6.2.6. France Leisure and Defense Power Boats, By Application, 2017-2030 (US$ Mn))
9.6.3. UK
9.6.3.1. UK Leisure and Defense Power Boats Market Estimates and Forecast, 2017-2030 (US$ Mn))
9.6.3.2. UK Leisure and Defense Power Boats, By Propulsion, 2017-2030 (US$ Mn))
9.6.3.3. UK Leisure and Defense Power Boats, By Boat Size, 2017-2030 (US$ Mn))
9.6.3.4. UK Leisure and Defense Power Boats, By Engine, 2017-2030 (US$ Mn))
9.6.3.5. UK Leisure and Defense Power Boats, By Horsepower, 2017-2030 (US$ Mn))
9.6.3.6. UK Leisure and Defense Power Boats, By Application, 2017-2030 (US$ Mn))
9.6.4. Italy
9.6.4.1. Italy Leisure and Defense Power Boats Market Estimates and Forecast, 2017-2030 (US$ Mn))
9.6.4.2. Italy Leisure and Defense Power Boats, By Propulsion, 2017-2030 (US$ Mn))
9.6.4.3. Italy Leisure and Defense Power Boats, By Boat Size, 2017-2030 (US$ Mn))
9.6.4.4. Italy Leisure and Defense Power Boats, By Engine, 2017-2030 (US$ Mn))
9.6.4.5. Italy Leisure and Defense Power Boats, By Horsepower, 2017-2030 (US$ Mn))
9.6.4.6. Italy Leisure and Defense Power Boats, By Application, 2017-2030 (US$ Mn))
9.6.5. Spain
9.6.5.1. Spain Leisure and Defense Power Boats Market Estimates and Forecast, 2017-2030 (US$ Mn))
9.6.5.2. Spain Leisure and Defense Power Boats, By Propulsion, 2017-2030 (US$ Mn))
9.6.5.3. Spain Leisure and Defense Power Boats, By Boat Size, 2017-2030 (US$ Mn))
9.6.5.4. Spain Leisure and Defense Power Boats, By Engine, 2017-2030 (US$ Mn))
9.6.5.5. Spain Leisure and Defense Power Boats, By Horsepower, 2017-2030 (US$ Mn))
9.6.5.6. Spain Leisure and Defense Power Boats, By Application, 2017-2030 (US$ Mn))
9.6.6. Rest of Europe
9.6.6.1. Rest of Europe Leisure and Defense Power Boats Market Estimates and Forecast, 2017-2030 (US$ Mn))
9.6.6.2. Rest of Europe Leisure and Defense Power Boats, By Propulsion, 2017-2030 (US$ Mn))
9.6.6.3. Rest of Europe Leisure and Defense Power Boats, By Boat Size, 2017-2030 (US$ Mn))
9.6.6.4. Rest of Europe Leisure and Defense Power Boats, By Engine, 2017-2030 (US$ Mn))
9.6.6.5. Rest of Europe Leisure and Defense Power Boats, By Horsepower, 2017-2030 (US$ Mn))
9.6.6.6. Rest of Europe Leisure and Defense Power Boats, By Application, 2017-2030 (US$ Mn))

10. Asia Pacific Leisure and Defense Power Boats Market Analysis
10.1. Asia Pacific Leisure and Defense Power Boats Market, by Propulsion, 2017-2030(US$ Mn))
10.1.1. Overview
10.1.2. SRC Analysis
10.2. Asia Pacific Leisure and Defense Power Boats Market, by Boat Size, 2017-2030(US$ Mn))
10.2.1. Overview
10.2.2. SRC Analysis
10.3. Asia Pacific Leisure and Defense Power Boats Market, by Engine, 2017-2030(US$ Mn))
10.3.1. Overview
10.3.2. SRC Analysis
10.4. Asia Pacific Leisure and Defense Power Boats Market, by Horsepower, 2017-2030(US$ Mn))
10.4.1. Overview
10.4.2. SRC Analysis
10.5. Asia Pacific Leisure and Defense Power Boats Market, by Application, 2017-2030(US$ Mn))
10.5.1. Overview
10.5.2. SRC Analysis
10.6. Asia Pacific Leisure and Defense Power Boats Market, by Country, 2017-2030 (US$ Mn))
10.6.1. China
10.6.1.1. China Leisure and Defense Power Boats Market Estimates and Forecast, 2017-2030 (US$ Mn))
10.6.1.2. China Leisure and Defense Power Boats, By Propulsion, 2017-2030 (US$ Mn))
10.6.1.3. China Leisure and Defense Power Boats, By Boat Size, 2017-2030 (US$ Mn))
10.6.1.4. China Leisure and Defense Power Boats, By Engine, 2017-2030 (US$ Mn))
10.6.1.5. China Leisure and Defense Power Boats, By Horsepower, 2017-2030 (US$ Mn))
10.6.1.6. China Leisure and Defense Power Boats, By Application, 2017-2030 (US$ Mn))
10.6.2. Japan
10.6.2.1. Japan Leisure and Defense Power Boats Market Estimates and Forecast, 2017-2030 (US$ Mn))
10.6.2.2. Japan Leisure and Defense Power Boats, By Propulsion, 2017-2030 (US$ Mn))
10.6.2.3. Japan Leisure and Defense Power Boats, By Boat Size, 2017-2030 (US$ Mn))
10.6.2.4. Japan Leisure and Defense Power Boats, By Engine, 2017-2030 (US$ Mn))
10.6.2.5. Japan Leisure and Defense Power Boats, By Horsepower, 2017-2030 (US$ Mn))
10.6.2.6. Japan Leisure and Defense Power Boats, By Application, 2017-2030 (US$ Mn))
10.6.3. India
10.6.3.1. India Leisure and Defense Power Boats Market Estimates and Forecast, 2017-2030 (US$ Mn))
10.6.3.2. India Leisure and Defense Power Boats, By Propulsion, 2017-2030 (US$ Mn))
10.6.3.3. India Leisure and Defense Power Boats, By Boat Size, 2017-2030 (US$ Mn))
10.6.3.4. India Leisure and Defense Power Boats, By Engine, 2017-2030 (US$ Mn))
10.6.3.5. India Leisure and Defense Power Boats, By Horsepower, 2017-2030 (US$ Mn))
10.6.3.6. India Leisure and Defense Power Boats, By Application, 2017-2030 (US$ Mn))
10.6.4. South Korea
10.6.4.1. South Korea Leisure and Defense Power Boats Market Estimates and Forecast, 2017-2030 (US$ Mn))
10.6.4.2. South Korea Leisure and Defense Power Boats, By Propulsion, 2017-2030 (US$ Mn))
10.6.4.3. South Korea Leisure and Defense Power Boats, By Boat Size, 2017-2030 (US$ Mn))
10.6.4.4. South Korea Leisure and Defense Power Boats, By Engine, 2017-2030 (US$ Mn))
10.6.4.5. South Korea Leisure and Defense Power Boats, By Horsepower, 2017-2030 (US$ Mn))
10.6.4.6. South Korea Leisure and Defense Power Boats, By Application, 2017-2030 (US$ Mn))
10.6.5. South-East Asia
10.6.5.1. South-East Asia Leisure and Defense Power Boats Market Estimates and Forecast, 2017-2030 (US$ Mn))
10.6.5.2. South-East Asia Leisure and Defense Power Boats, By Propulsion, 2017-2030 (US$ Mn))
10.6.5.3. South-East Asia Leisure and Defense Power Boats, By Boat Size, 2017-2030 (US$ Mn))
10.6.5.4. South-East Asia Leisure and Defense Power Boats, By Engine, 2017-2030 (US$ Mn))
10.6.5.5. South-East Asia Leisure and Defense Power Boats, By Horsepower, 2017-2030 (US$ Mn))
10.6.5.6. South-East Asia Leisure and Defense Power Boats, By Application, 2017-2030 (US$ Mn))
10.6.6. Rest of Asia Pacific
10.6.6.1. Rest of Asia Pacific Leisure and Defense Power Boats Market Estimates and Forecast, 2017-2030 (US$ Mn))
10.6.6.2. Rest of Asia Pacific Leisure and Defense Power Boats, By Propulsion, 2017-2030 (US$ Mn))
10.6.6.3. Rest of Asia Pacific Leisure and Defense Power Boats, By Boat Size, 2017-2030 (US$ Mn))
10.6.6.4. Rest of Asia Pacific Leisure and Defense Power Boats, By Engine, 2017-2030 (US$ Mn))
10.6.6.5. Rest of Asia Pacific Leisure and Defense Power Boats, By Horsepower, 2017-2030 (US$ Mn))
10.6.6.6. Rest of Asia Pacific Leisure and Defense Power Boats, By Application, 2017-2030 (US$ Mn))

11. Latin America Leisure and Defense Power Boats Market Analysis
11.1. Latin America Leisure and Defense Power Boats Market, by Propulsion, 2017-2030(US$ Mn))
11.1.1. Overview
11.1.2. SRC Analysis
11.2. Latin America Leisure and Defense Power Boats Market, by Boat Size, 2017-2030(US$ Mn))
11.2.1. Overview
11.2.2. SRC Analysis
11.3. Latin America Leisure and Defense Power Boats Market, by Engine, 2017-2030(US$ Mn))
11.3.1. Overview
11.3.2. SRC Analysis
11.4. Latin America Leisure and Defense Power Boats Market, by Horsepower, 2017-2030(US$ Mn))
11.4.1. Overview
11.4.2. SRC Analysis
11.5. Latin America Leisure and Defense Power Boats Market, by Application, 2017-2030(US$ Mn))
11.5.1. Overview
11.5.2. SRC Analysis
11.6. Latin America Leisure and Defense Power Boats Market, by Country, 2017-2030 (US$ Mn))
11.6.1. Brazil
11.6.1.1. Brazil Leisure and Defense Power Boats Market Estimates and Forecast, 2017-2030 (US$ Mn))
11.6.1.2. Brazil Leisure and Defense Power Boats, By Propulsion, 2017-2030 (US$ Mn))
11.6.1.3. Brazil Leisure and Defense Power Boats, By Boat Size, 2017-2030 (US$ Mn))
11.6.1.4. Brazil Leisure and Defense Power Boats, By Engine, 2017-2030 (US$ Mn))
11.6.1.5. Brazil Leisure and Defense Power Boats, By Horsepower, 2017-2030 (US$ Mn))
11.6.1.6. Brazil Leisure and Defense Power Boats, By Application, 2017-2030 (US$ Mn))
11.6.2. Mexico
11.6.2.1. Mexico Leisure and Defense Power Boats Market Estimates and Forecast, 2017-2030 (US$ Mn))
11.6.2.2. Mexico Leisure and Defense Power Boats, By Propulsion, 2017-2030 (US$ Mn))
11.6.2.3. Mexico Leisure and Defense Power Boats, By Boat Size, 2017-2030 (US$ Mn))
11.6.2.4. Mexico Leisure and Defense Power Boats, By Engine, 2017-2030 (US$ Mn))
11.6.2.5. Mexico Leisure and Defense Power Boats, By Horsepower, 2017-2030 (US$ Mn))
11.6.2.6. Mexico Leisure and Defense Power Boats, By Application, 2017-2030 (US$ Mn))
11.6.3. Rest of Latin America
11.6.3.1. Rest of Latin America Leisure and Defense Power Boats Market Estimates and Forecast, 2017-2030 (US$ Mn))
11.6.3.2. Rest of Latin America Leisure and Defense Power Boats, By Propulsion, 2017-2030 (US$ Mn))
11.6.3.3. Rest of Latin America Leisure and Defense Power Boats, By Boat Size, 2017-2030 (US$ Mn))
11.6.3.4. Rest of Latin America Leisure and Defense Power Boats, By Engine, 2017-2030 (US$ Mn))
11.6.3.5. Rest of Latin America Leisure and Defense Power Boats, By Horsepower, 2017-2030 (US$ Mn))
11.6.3.6. Rest of Latin America Leisure and Defense Power Boats, By Application, 2017-2030 (US$ Mn))

12. Middle East and Africa Leisure and Defense Power Boats Market Analysis
12.1. Middle East and Africa Leisure and Defense Power Boats Market, by Propulsion, 2017-2030(US$ Mn))
12.1.1. Overview
12.1.2. SRC Analysis
12.2. Middle East and Africa Leisure and Defense Power Boats Market, by Boat Size, 2017-2030(US$ Mn))
12.2.1. Overview
12.2.2. SRC Analysis
12.3. Middle East and Africa Leisure and Defense Power Boats Market, by Engine, 2017-2030(US$ Mn))
12.3.1. Overview
12.3.2. SRC Analysis
12.4. Middle East and Africa Leisure and Defense Power Boats Market, by Horsepower, 2017-2030(US$ Mn))
12.4.1. Overview
12.4.2. SRC Analysis
12.5. Middle East and Africa Leisure and Defense Power Boats Market, by Application, 2017-2030(US$ Mn))
12.5.1. Overview
12.5.2. SRC Analysis
12.6. Middle East and Africa Leisure and Defense Power Boats Market, by Country, 2017-2030 (US$ Mn))
12.6.1. GCC Countries
12.6.1.1. GCC Countries Leisure and Defense Power Boats Market Estimates and Forecast, 2017-2030 (US$ Mn))
12.6.1.2. GCC Countries Leisure and Defense Power Boats, By Propulsion, 2017-2030 (US$ Mn))
12.6.1.3. GCC Countries Leisure and Defense Power Boats, By Boat Size, 2017-2030 (US$ Mn))
12.6.1.4. GCC Countries Leisure and Defense Power Boats, By Engine, 2017-2030 (US$ Mn))
12.6.1.5. GCC Countries Leisure and Defense Power Boats, By Horsepower, 2017-2030 (US$ Mn))
12.6.1.6. GCC Countries Leisure and Defense Power Boats, By Application, 2017-2030 (US$ Mn))
12.6.2. South Africa
12.6.2.1. South Africa Leisure and Defense Power Boats Market Estimates and Forecast, 2017-2030 (US$ Mn))
12.6.2.2. South Africa Leisure and Defense Power Boats, By Propulsion, 2017-2030 (US$ Mn))
12.6.2.3. South Africa Leisure and Defense Power Boats, By Boat Size, 2017-2030 (US$ Mn))
12.6.2.4. South Africa Leisure and Defense Power Boats, By Engine, 2017-2030 (US$ Mn))
12.6.2.5. South Africa Leisure and Defense Power Boats, By Horsepower, 2017-2030 (US$ Mn))
12.6.2.6. South Africa Leisure and Defense Power Boats, By Application, 2017-2030 (US$ Mn))
12.6.3. Rest of Middle East and Africa
12.6.3.1. Rest of Middle East and Africa Leisure and Defense Power Boats Market Estimates and Forecast, 2017-2030 (US$ Mn))
12.6.3.2. Rest of Middle East and Africa Leisure and Defense Power Boats, By Propulsion, 2017-2030 (US$ Mn))
12.6.3.3. Rest of Middle East and Africa Leisure and Defense Power Boats, By Boat Size, 2017-2030 (US$ Mn))
12.6.3.4. Rest of Middle East and Africa Leisure and Defense Power Boats, By Engine, 2017-2030 (US$ Mn))
12.6.3.5. Rest of Middle East and Africa Leisure and Defense Power Boats, By Horsepower, 2017-2030 (US$ Mn))
12.6.3.6. Rest of Middle East and Africa Leisure and Defense Power Boats, By Application, 2017-2030 (US$ Mn))

13. Company Profiles
13.1. Groupe Beneteau
13.1.1. Company Overview
13.1.2. Products/Services Portfolio
13.1.3. Geographical Presence
13.1.4. Financial Summary
13.1.4.1. Market Revenue and Net Profit (2019-2022)
13.1.4.2. Business Segment Revenue Analysis
13.1.4.3. Geographical Revenue Analysis
13.2. Brunswick Corporation
13.3. Marine Products Corporation
13.4. Carnival Corporation & Plc
13.5. Royal Caribbean Cruises Ltd
13.6. Norwegian Cruise Line Holdings Ltd
13.7. MCBC Holdings Inc
13.8. Malibu Boats Inc
13.9. Grand Banks Yachts Ltd
13.10. Porter Inc
13.11. Grady-White Boats Inc
13.12. Maverick Boat Group Inc
13.13. Correct Craft
13.14. Baja Marine
13.15. Pacific Asian Enterprises
13.16. Albemarle Boats
13.17. Yamaha Motors Co. Ltd
13.18. Sunseeker International Limited

List of Figures

FIG. 1 Global Leisure and Defense Power Boats Market: Research Methodology
FIG. 2 Market Size Estimation – Top Down & Bottom up Approach
FIG. 3 Global Leisure and Defense Power Boats Market Segmentation
FIG. 4 Global Leisure and Defense Power Boats Market, by Propulsion, 2022 (US$ Mn))
FIG. 5 Global Leisure and Defense Power Boats Market, by Boat Size, 2022 (US$ Mn))
FIG. 6 Global Leisure and Defense Power Boats Market, by Engine, 2022 (US$ Mn))
FIG. 7 Global Leisure and Defense Power Boats Market, by Horsepower, 2022 (US$ Mn))
FIG. 8 Global Leisure and Defense Power Boats Market, by Application, 2022 (US$ Mn))
FIG. 9 Global Leisure and Defense Power Boats Market, by Geography, 2022 (US$ Mn))
FIG. 10 Attractive Investment Proposition, by Propulsion, 2022
FIG. 11 Attractive Investment Proposition, by Boat Size, 2022
FIG. 12 Attractive Investment Proposition, by Engine, 2022
FIG. 13 Attractive Investment Proposition, by Horsepower, 2022
FIG. 14 Attractive Investment Proposition, by Application, 2022
FIG. 15 Attractive Investment Proposition, by Geography, 2022
FIG. 16 Global Market Share Analysis of Key Leisure and Defense Power Boats Market Manufacturers, 2022
FIG. 17 Global Market Positioning of Key Leisure and Defense Power Boats Market Manufacturers, 2022
FIG. 18 Global Leisure and Defense Power Boats Market Value Contribution, By Propulsion, 2022 & 2030 (Value %)
FIG. 19 Global Leisure and Defense Power Boats Market, by Outboard Boats, Value, 2017-2030 (US$ Mn))
FIG. 20 Global Leisure and Defense Power Boats Market, by Inboard & Sterndrive Boats, Value, 2017-2030 (US$ Mn))
FIG. 21 Global Leisure and Defense Power Boats Market, by Sailboats, Value, 2017-2030 (US$ Mn))
FIG. 22 Global Leisure and Defense Power Boats Market Value Contribution, By Boat Size, 2022 & 2030 (Value %)
FIG. 23 Global Leisure and Defense Power Boats Market, by Up to 20 Ft., Value, 2017-2030 (US$ Mn))
FIG. 24 Global Leisure and Defense Power Boats Market, by 21 Ft. to 35 Ft., 2017-2030 (US$ Mn))
FIG. 25 Global Leisure and Defense Power Boats Market, by 36 Ft. to 50 Ft., 2017-2030 (US$ Mn))
FIG. 26 Global Leisure and Defense Power Boats Market Value Contribution, By Engine, 2022 & 2030 (Value %)
FIG. 27 Global Leisure and Defense Power Boats Market, by Diesel, Value, 2017-2030 (US$ Mn))
FIG. 28 Global Leisure and Defense Power Boats Market, by Electric, 2017-2030 (US$ Mn))
FIG. 29 Global Leisure and Defense Power Boats Market, by Solar, 2017-2030 (US$ Mn))
FIG. 30 Global Leisure and Defense Power Boats Market Value Contribution, By Horsepower, 2022 & 2030 (Value %)
FIG. 31 Global Leisure and Defense Power Boats Market, by Up to 250 HP, Value, 2017-2030 (US$ Mn))
FIG. 32 Global Leisure and Defense Power Boats Market, by 250 HP to 500 HP, Value, 2017-2030 (US$ Mn))
FIG. 33 Global Leisure and Defense Power Boats Market, by Above 500 HP, 2017-2030 (US$ Mn))
FIG. 34 Global Leisure and Defense Power Boats Market Value Contribution, By Application, 2022 & 2030 (Value %)
FIG. 35 Global Leisure and Defense Power Boats Market, by Leisure, Value, 2017-2030 (US$ Mn))
FIG. 36 Global Leisure and Defense Power Boats Market, by Fishing, Value, 2017-2030 (US$ Mn))
FIG. 37 Global Leisure and Defense Power Boats Market, by Transportation, 2017-2030 (US$ Mn))
FIG. 38 Global Leisure and Defense Power Boats Market, by Sports, 2017-2030 (US$ Mn))
FIG. 39 Global Leisure and Defense Power Boats Market, by Travel & Tourism, 2017-2030 (US$ Mn))
FIG. 40 Global Leisure and Defense Power Boats Market, by Defense, 2017-2030 (US$ Mn))
FIG. 41 Global Leisure and Defense Power Boats Market, by Military, 2017-2030 (US$ Mn))
FIG. 42 Global Leisure and Defense Power Boats Market, by Police Patrol, 2017-2030 (US$ Mn))
FIG. 43 North America Leisure and Defense Power Boats Market, 2017-2030 (US$ Mn))
FIG. 44 U.S. Leisure and Defense Power Boats Market, 2017-2030 (US$ Mn))
FIG. 45 Canada Leisure and Defense Power Boats Market, 2017-2030 (US$ Mn))
FIG. 46 Europe Leisure and Defense Power Boats Market, 2017-2030 (US$ Mn))
FIG. 47 Germany Leisure and Defense Power Boats Market, 2017-2030 (US$ Mn))
FIG. 48 France Leisure and Defense Power Boats Market, 2017-2030 (US$ Mn))
FIG. 49 U.K. Leisure and Defense Power Boats Market, 2017-2030 (US$ Mn))
FIG. 50 Italy Leisure and Defense Power Boats Market, 2017-2030 (US$ Mn))
FIG. 51 Spain Leisure and Defense Power Boats Market, 2017-2030 (US$ Mn))
FIG. 52 Rest of Europe Leisure and Defense Power Boats Market, 2017-2030 (US$ Mn))
FIG. 53 Asia Pacific Leisure and Defense Power Boats Market, 2017-2030 (US$ Mn))
FIG. 54 China Leisure and Defense Power Boats Market, 2017-2030 (US$ Mn))
FIG. 55 Japan Leisure and Defense Power Boats Market, 2017-2030 (US$ Mn))
FIG. 56 India Leisure and Defense Power Boats Market, 2017-2030 (US$ Mn))
FIG. 57 South Korea Leisure and Defense Power Boats Market, 2017-2030 (US$ Mn))
FIG. 58 South-East Asia Leisure and Defense Power Boats Market, 2017-2030 (US$ Mn))
FIG. 59 Rest of Asia Pacific Leisure and Defense Power Boats Market, 2017-2030 (US$ Mn))
FIG. 60 Latin America Leisure and Defense Power Boats Market, 2017-2030 (US$ Mn))
FIG. 61 Brazil Leisure and Defense Power Boats Market, 2017-2030 (US$ Mn))
FIG. 62 Mexico Leisure and Defense Power Boats Market, 2017-2030 (US$ Mn))
FIG. 63 Rest of Latin America Leisure and Defense Power Boats Market, 2017-2030 (US$ Mn))
FIG. 64 Middle East & Africa Leisure and Defense Power Boats Market, 2017-2030 (US$ Mn))
FIG. 65 GCC Countries Leisure and Defense Power Boats Market, 2017-2030 (US$ Mn))
FIG. 66 South Africa Leisure and Defense Power Boats Market, 2017-2030 (US$ Mn))
FIG. 67 Rest of Middle East and Africa Leisure and Defense Power Boats Market, 2017-2030 (US$ Mn))

List of Tables

TABLE 1 Market Snapshot: Global Leisure and Defense Power Boats Market
TABLE 2 Global Leisure and Defense Power Boats Market, by Competitive Benchmarking, 2022
TABLE 3 Global Leisure and Defense Power Boats Market, by Geographical Presence Analysis, 2022
TABLE 4 Global Leisure and Defense Power Boats Market, by Key Strategies Analysis, 2022
TABLE 5 Global Leisure and Defense Power Boats Market, by Propulsion, 2017-2030 (US$ Mn))
TABLE 6 Global Leisure and Defense Power Boats Market, by Boat Size, 2017-2030 (US$ Mn))
TABLE 7 Global Leisure and Defense Power Boats Market, by Engine, 2017-2030 (US$ Mn))
TABLE 8 Global Leisure and Defense Power Boats Market, by Horsepower, 2017-2030 (US$ Mn))
TABLE 9 Global Leisure and Defense Power Boats Market, by Application, 2017-2030 (US$ Mn))
TABLE 10 Global Leisure and Defense Power Boats Market, by Geography, 2017-2030 (US$ Mn))
TABLE 11 North America Leisure and Defense Power Boats Market, by Propulsion, 2017-2030 (US$ Mn))
TABLE 12 North America Leisure and Defense Power Boats Market, by Boat Size, 2017-2030 (US$ Mn))
TABLE 13 North America Leisure and Defense Power Boats Market, by Engine, 2017-2030 (US$ Mn))
TABLE 14 North America Leisure and Defense Power Boats Market, by Horsepower, 2017-2030 (US$ Mn))
TABLE 15 North America Leisure and Defense Power Boats Market, by Application, 2017-2030 (US$ Mn))
TABLE 16 North America Leisure and Defense Power Boats Market, by Country, 2017-2030 (US$ Mn))
TABLE 17 US Leisure and Defense Power Boats Market, by Propulsion, 2017-2030 (US$ Mn))
TABLE 18 US Leisure and Defense Power Boats Market, by Boat Size, 2017-2030 (US$ Mn))
TABLE 19 US Leisure and Defense Power Boats Market, by Engine, 2017-2030 (US$ Mn))
TABLE 20 US Leisure and Defense Power Boats Market, by Horsepower, 2017-2030 (US$ Mn))
TABLE 21 US Leisure and Defense Power Boats Market, by Application, 2017-2030 (US$ Mn))
TABLE 22 Canada Leisure and Defense Power Boats Market, by Propulsion, 2017-2030 (US$ Mn))
TABLE 23 Canada Leisure and Defense Power Boats Market, by Boat Size, 2017-2030 (US$ Mn))
TABLE 24 Canada Leisure and Defense Power Boats Market, by Engine, 2017-2030 (US$ Mn))
TABLE 25 Canada Leisure and Defense Power Boats Market, by Horsepower, 2017-2030 (US$ Mn))
TABLE 26 Canada Leisure and Defense Power Boats Market, by Application, 2017-2030 (US$ Mn))
TABLE 27 Europe Leisure and Defense Power Boats Market, by Propulsion, 2017-2030 (US$ Mn))
TABLE 28 Europe Leisure and Defense Power Boats Market, by Boat Size, 2017-2030 (US$ Mn))
TABLE 29 Europe Leisure and Defense Power Boats Market, by Engine, 2017-2030 (US$ Mn))
TABLE 30 Europe Leisure and Defense Power Boats Market, by Horsepower, 2017-2030 (US$ Mn))
TABLE 31 Europe Leisure and Defense Power Boats Market, by Application, 2017-2030 (US$ Mn))
TABLE 32 Europe Leisure and Defense Power Boats Market, by Country, 2017-2030 (US$ Mn))
TABLE 33 Germany Leisure and Defense Power Boats Market, by Propulsion, 2017-2030 (US$ Mn))
TABLE 34 Germany Leisure and Defense Power Boats Market, by Boat Size, 2017-2030 (US$ Mn))
TABLE 35 Germany Leisure and Defense Power Boats Market, by Engine, 2017-2030 (US$ Mn))
TABLE 36 Germany Leisure and Defense Power Boats Market, by Horsepower, 2017-2030 (US$ Mn))
TABLE 37 Germany Leisure and Defense Power Boats Market, by Application, 2017-2030 (US$ Mn))
TABLE 38 France Leisure and Defense Power Boats Market, by Propulsion, 2017-2030 (US$ Mn))
TABLE 39 France Leisure and Defense Power Boats Market, by Boat Size, 2017-2030 (US$ Mn))
TABLE 40 France Leisure and Defense Power Boats Market, by Engine, 2017-2030 (US$ Mn))
TABLE 41 France Leisure and Defense Power Boats Market, by Horsepower, 2017-2030 (US$ Mn))
TABLE 42 France Leisure and Defense Power Boats Market, by Application, 2017-2030 (US$ Mn))
TABLE 43 UK Leisure and Defense Power Boats Market, by Propulsion, 2017-2030 (US$ Mn))
TABLE 44 UK Leisure and Defense Power Boats Market, by Boat Size, 2017-2030 (US$ Mn))
TABLE 45 UK Leisure and Defense Power Boats Market, by Engine, 2017-2030 (US$ Mn))
TABLE 46 UK Leisure and Defense Power Boats Market, by Horsepower, 2017-2030 (US$ Mn))
TABLE 47 UK Leisure and Defense Power Boats Market, by Application, 2017-2030 (US$ Mn))
TABLE 48 Italy Leisure and Defense Power Boats Market, by Propulsion, 2017-2030 (US$ Mn))
TABLE 49 Italy Leisure and Defense Power Boats Market, by Boat Size, 2017-2030 (US$ Mn))
TABLE 50 Italy Leisure and Defense Power Boats Market, by Engine, 2017-2030 (US$ Mn))
TABLE 51 Italy Leisure and Defense Power Boats Market, by Horsepower, 2017-2030 (US$ Mn))
TABLE 52 Italy Leisure and Defense Power Boats Market, by Application, 2017-2030 (US$ Mn))
TABLE 53 Spain Leisure and Defense Power Boats Market, by Propulsion, 2017-2030 (US$ Mn))
TABLE 54 Spain Leisure and Defense Power Boats Market, by Boat Size, 2017-2030 (US$ Mn))
TABLE 55 Spain Leisure and Defense Power Boats Market, by Engine, 2017-2030 (US$ Mn))
TABLE 56 Spain Leisure and Defense Power Boats Market, by Horsepower, 2017-2030 (US$ Mn))
TABLE 57 Spain Leisure and Defense Power Boats Market, by Application, 2017-2030 (US$ Mn))
TABLE 58 Rest of Europe Leisure and Defense Power Boats Market, by Propulsion, 2017-2030 (US$ Mn))
TABLE 59 Rest of Europe Leisure and Defense Power Boats Market, by Boat Size, 2017-2030 (US$ Mn))
TABLE 60 Rest of Europe Leisure and Defense Power Boats Market, by Engine, 2017-2030 (US$ Mn))
TABLE 61 Rest of Europe Leisure and Defense Power Boats Market, by Horsepower, 2017-2030 (US$ Mn))
TABLE 62 Rest of Europe Leisure and Defense Power Boats Market, by Application, 2017-2030 (US$ Mn))
TABLE 63 Asia Pacific Leisure and Defense Power Boats Market, by Propulsion, 2017-2030 (US$ Mn))
TABLE 64 Asia Pacific Leisure and Defense Power Boats Market, by Boat Size, 2017-2030 (US$ Mn))
TABLE 65 Asia Pacific Leisure and Defense Power Boats Market, by Engine, 2017-2030 (US$ Mn))
TABLE 66 Asia Pacific Leisure and Defense Power Boats Market, by Horsepower, 2017-2030 (US$ Mn))
TABLE 67 Asia Pacific Leisure and Defense Power Boats Market, by Application, 2017-2030 (US$ Mn))
TABLE 68 Asia Pacific Leisure and Defense Power Boats Market, by Country, 2017-2030 (US$ Mn))
TABLE 69 China Leisure and Defense Power Boats Market, by Propulsion, 2017-2030 (US$ Mn))
TABLE 70 China Leisure and Defense Power Boats Market, by Boat Size, 2017-2030 (US$ Mn))
TABLE 71 China Leisure and Defense Power Boats Market, by Engine, 2017-2030 (US$ Mn))
TABLE 72 China Leisure and Defense Power Boats Market, by Horsepower, 2017-2030 (US$ Mn))
TABLE 73 China Leisure and Defense Power Boats Market, by Application, 2017-2030 (US$ Mn))
TABLE 74 Japan Leisure and Defense Power Boats Market, by Propulsion, 2017-2030 (US$ Mn))
TABLE 75 Japan Leisure and Defense Power Boats Market, by Boat Size, 2017-2030 (US$ Mn))
TABLE 76 Japan Leisure and Defense Power Boats Market, by Engine, 2017-2030 (US$ Mn))
TABLE 77 Japan Leisure and Defense Power Boats Market, by Horsepower, 2017-2030 (US$ Mn))
TABLE 78 Japan Leisure and Defense Power Boats Market, by Application, 2017-2030 (US$ Mn))
TABLE 79 India Leisure and Defense Power Boats Market, by Propulsion, 2017-2030 (US$ Mn))
TABLE 80 India Leisure and Defense Power Boats Market, by Boat Size, 2017-2030 (US$ Mn))
TABLE 81 India Leisure and Defense Power Boats Market, by Engine, 2017-2030 (US$ Mn))
TABLE 82 India Leisure and Defense Power Boats Market, by Horsepower, 2017-2030 (US$ Mn))
TABLE 83 India Leisure and Defense Power Boats Market, by Application, 2017-2030 (US$ Mn))
TABLE 84 South Korea Leisure and Defense Power Boats Market, by Propulsion, 2017-2030 (US$ Mn))
TABLE 85 South Korea Leisure and Defense Power Boats Market, by Boat Size, 2017-2030 (US$ Mn))
TABLE 86 South Korea Leisure and Defense Power Boats Market, by Engine, 2017-2030 (US$ Mn))
TABLE 87 South Korea Leisure and Defense Power Boats Market, by Horsepower, 2017-2030 (US$ Mn))
TABLE 88 South Korea Leisure and Defense Power Boats Market, by Application, 2017-2030 (US$ Mn))
TABLE 89 South-East Asia Leisure and Defense Power Boats Market, by Propulsion, 2017-2030 (US$ Mn))
TABLE 90 South-East Asia Leisure and Defense Power Boats Market, by Boat Size, 2017-2030 (US$ Mn))
TABLE 91 South-East Asia Leisure and Defense Power Boats Market, by Engine, 2017-2030 (US$ Mn))
TABLE 92 South-East Asia Leisure and Defense Power Boats Market, by Horsepower, 2017-2030 (US$ Mn))
TABLE 93 South-East Asia Leisure and Defense Power Boats Market, by Application, 2017-2030 (US$ Mn))
TABLE 94 Rest of Asia Pacific Leisure and Defense Power Boats Market, by Propulsion, 2017-2030 (US$ Mn))
TABLE 95 Rest of Asia Pacific Leisure and Defense Power Boats Market, by Boat Size, 2017-2030 (US$ Mn))
TABLE 96 Rest of Asia Pacific Leisure and Defense Power Boats Market, by Engine, 2017-2030 (US$ Mn))
TABLE 97 Rest of Asia Pacific Leisure and Defense Power Boats Market, by Horsepower, 2017-2030 (US$ Mn))
TABLE 98 Rest of Asia Pacific Leisure and Defense Power Boats Market, by Application, 2017-2030 (US$ Mn))
TABLE 99 Latin America Leisure and Defense Power Boats Market, by Propulsion, 2017-2030 (US$ Mn))
TABLE 100 Latin America Leisure and Defense Power Boats Market, by Boat Size, 2017-2030 (US$ Mn))
TABLE 101 Latin America Leisure and Defense Power Boats Market, by Engine, 2017-2030 (US$ Mn))
TABLE 102 Latin America Leisure and Defense Power Boats Market, by Horsepower, 2017-2030 (US$ Mn))
TABLE 103 Latin America Leisure and Defense Power Boats Market, by Application, 2017-2030 (US$ Mn))
TABLE 104 Latin America Leisure and Defense Power Boats Market, by Country, 2017-2030 (US$ Mn))
TABLE 105 Brazil Leisure and Defense Power Boats Market, by Propulsion, 2017-2030 (US$ Mn))
TABLE 106 Brazil Leisure and Defense Power Boats Market, by Boat Size, 2017-2030 (US$ Mn))
TABLE 107 Brazil Leisure and Defense Power Boats Market, by Engine, 2017-2030 (US$ Mn))
TABLE 108 Brazil Leisure and Defense Power Boats Market, by Horsepower, 2017-2030 (US$ Mn))
TABLE 109 Brazil Leisure and Defense Power Boats Market, by Application, 2017-2030 (US$ Mn))
TABLE 110 Mexico Leisure and Defense Power Boats Market, by Propulsion, 2017-2030 (US$ Mn))
TABLE 111 Mexico Leisure and Defense Power Boats Market, by Boat Size, 2017-2030 (US$ Mn))
TABLE 112 Mexico Leisure and Defense Power Boats Market, by Engine, 2017-2030 (US$ Mn))
TABLE 113 Mexico Leisure and Defense Power Boats Market, by Horsepower, 2017-2030 (US$ Mn))
TABLE 114 Mexico Leisure and Defense Power Boats Market, by Application, 2017-2030 (US$ Mn))
TABLE 115 Rest of Latin America Leisure and Defense Power Boats Market, by Propulsion, 2017-2030 (US$ Mn))
TABLE 116 Rest of Latin America Leisure and Defense Power Boats Market, by Boat Size, 2017-2030 (US$ Mn))
TABLE 117 Rest of Latin America Leisure and Defense Power Boats Market, by Engine, 2017-2030 (US$ Mn))
TABLE 118 Rest of Latin America Leisure and Defense Power Boats Market, by Horsepower, 2017-2030 (US$ Mn))
TABLE 119 Rest of Latin America Leisure and Defense Power Boats Market, by Application, 2017-2030 (US$ Mn))
TABLE 120 Middle East and Africa Leisure and Defense Power Boats Market, by Propulsion, 2017-2030 (US$ Mn))
TABLE 121 Middle East and Africa Leisure and Defense Power Boats Market, by Boat Size, 2017-2030 (US$ Mn))
TABLE 122 Middle East and Africa Leisure and Defense Power Boats Market, by Engine, 2017-2030 (US$ Mn))
TABLE 123 Middle East and Africa Leisure and Defense Power Boats Market, by Horsepower, 2017-2030 (US$ Mn))
TABLE 124 Middle East and Africa Leisure and Defense Power Boats Market, by Application, 2017-2030 (US$ Mn))
TABLE 125 Middle East and Africa Leisure and Defense Power Boats Market, by Country, 2017-2030 (US$ Mn))
TABLE 126 GCC Countries Leisure and Defense Power Boats Market, by Propulsion, 2017-2030 (US$ Mn))
TABLE 127 GCC Countries Leisure and Defense Power Boats Market, by Boat Size, 2017-2030 (US$ Mn))
TABLE 128 GCC Countries Leisure and Defense Power Boats Market, by Engine, 2017-2030 (US$ Mn))
TABLE 129 GCC Countries Leisure and Defense Power Boats Market, by Horsepower, 2017-2030 (US$ Mn))
TABLE 130 GCC Countries Leisure and Defense Power Boats Market, by Application, 2017-2030 (US$ Mn))
TABLE 131 South Africa Leisure and Defense Power Boats Market, by Propulsion, 2017-2030 (US$ Mn))
TABLE 132 South Africa Leisure and Defense Power Boats Market, by Boat Size, 2017-2030 (US$ Mn))
TABLE 133 South Africa Leisure and Defense Power Boats Market, by Engine, 2017-2030 (US$ Mn))
TABLE 134 South Africa Leisure and Defense Power Boats Market, by Horsepower, 2017-2030 (US$ Mn))
TABLE 135 South Africa Leisure and Defense Power Boats Market, by Application, 2017-2030 (US$ Mn))
TABLE 136 Rest of Middle East and Africa Leisure and Defense Power Boats Market, by Propulsion, 2017-2030 (US$ Mn))
TABLE 137 Rest of Middle East and Africa Leisure and Defense Power Boats Market, by Boat Size, 2017-2030 (US$ Mn))
TABLE 138 Rest of Middle East and Africa Leisure and Defense Power Boats Market, by Engine, 2017-2030 (US$ Mn))
TABLE 139 Rest of Middle East and Africa Leisure and Defense Power Boats Market, by Horsepower, 2017-2030 (US$ Mn))
TABLE 140 Rest of Middle East and Africa Leisure and Defense Power Boats Market, by Application, 2017-2030 (US$ Mn))

Frequently Asked Questions

How does COVID-19 impact the global leisure and defense power boats market?

The COVID-19 pandemic has significantly affected the global leisure and defense powerboat market. The pandemic caused extensive lockdowns, travel restrictions, and economic uncertainty, resulting in a drop in demand for powerboats.

 
Which is the leading region of the market for leisure and defense power boats?

 In 2022, North America held the largest revenue share of the global leisure and defense power boats market.

What are the key drivers for the growth of the leisure and defense powerboat market?

The main drivers for the growth of the leisure and defense power boats market are rising recreational boating demand, growing global defense and security investments, increasing adoption of advanced technologies and materials, and expanding the tourism and travel industry.

Which is the major leisure and defense power boats market segment by horsepower?

The above 500 HP segment had a major global market share in 2022.

Which is the major segment in the leisure and defense power boats market by application?

The defense segment had a major share in the global market.

Arms and Ammunition Market

Published:
Report ID: 36300

Airport Ground and Cargo Handling Services Market

Published:
Report ID: 17986

Military Helmet Market

Published:
Report ID: 35391

Solar-Powered Drone Market

Published:
Report ID: 33586

Aerial Imaging Market

Published:
Report ID: 2597

Commercial Aircraft Passenger Service Unit (PSU) Market

Published:
Report ID: 32095

Aviation Fuel Market

Published:
Report ID: 23337

Defense Cyber Security Market

Published:
Report ID: 23353

Aerospace Valves Market

Published:
Report ID: 22847

Intelligent Marine Navigation Systems Market

Published:
Report ID: 6903

Flight Management Systems (FMS) Market

Published:
Report ID: 18832

Purchase Options

$2999
Delivery Format: Excel.
$4999
Designed for the individual purchaser.
$6999
Users located at a single corporate site or regional office.
$7999
Allowed for unlimited sharing globally within one company.
Smallform of Sample request

Have a question?

User Profile

Don’t settle for less – trust Mitul to help you find the best solution.

Report delivery within 24 to 48 hours

– Other Info –

What people say?-

User Review

I am very impressed with the information in this report. The author clearly did their research when they came up with this product and it has already given me a lot of ideas.

Jana Schmidt
CEDAR CX Technologies

– Connect with us –

Phone

+91 6232 49 3207


support

24/7 Research Support


sales@credenceresearch.com

– Research Methodology –

Going beyond the basics: advanced techniques in research methodology

– Trusted By –

Pepshi, LG, Nestle
Motorola, Honeywell, Johnson and johnson
LG Chem, SIEMENS, Pfizer
Unilever, Samsonite, QIAGEN