
Market Overview:
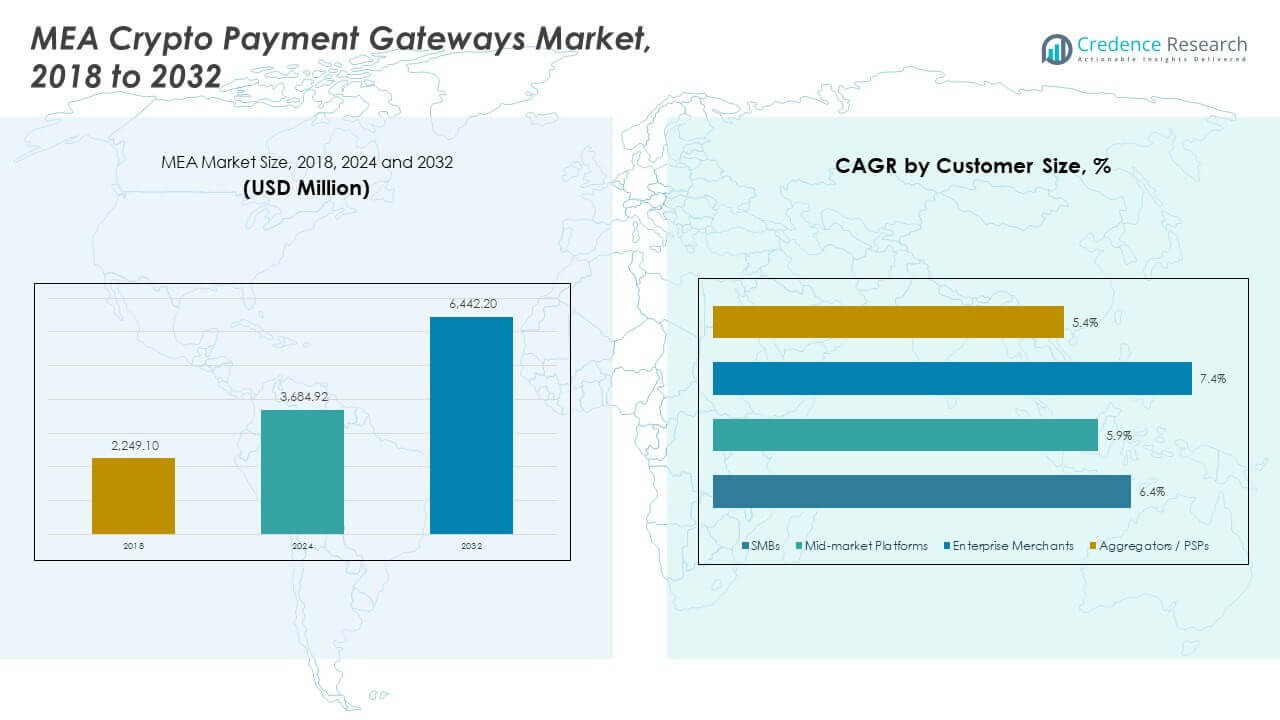
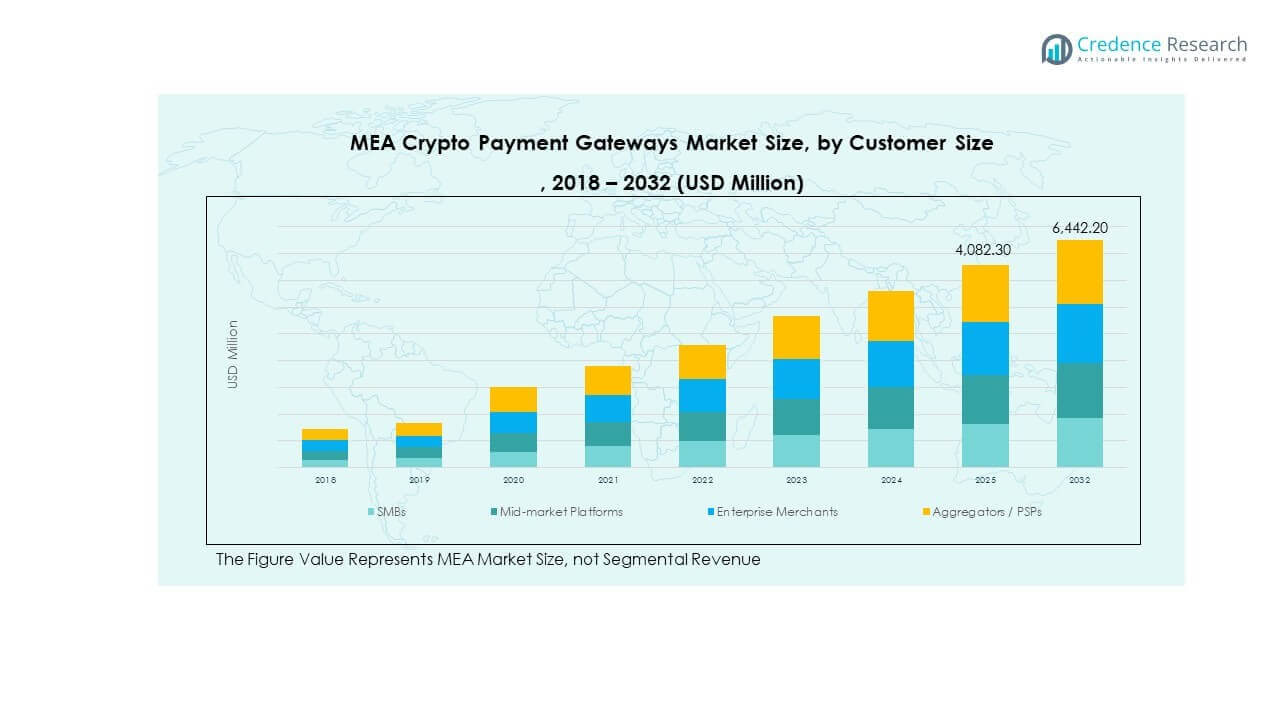
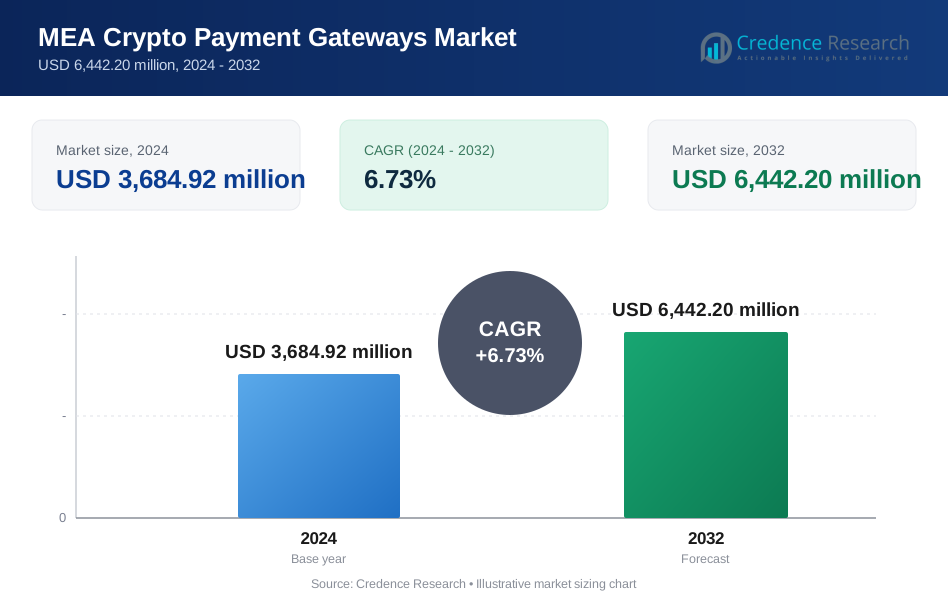
The MEA Crypto Payment Gateways Market size was valued at USD 2,249.10 million in 2018 to USD 3,684.92 million in 2024 and is anticipated to reach USD 6,442.20 million by 2032, at a CAGR of 6.73% during the forecast period.
| REPORT ATTRIBUTE | DETAILS |
|---|---|
| Historical Period | 2020-2023 |
| Base Year | 2024 |
| Forecast Period | 2025-2032 |
| MEA Crypto Payment Gateways Market Size 2024 | USD 3,684.92 Million |
| MEA Crypto Payment Gateways Market, CAGR | 6.73% |
| MEA Crypto Payment Gateways Market Size 2032 | USD 6,442.20 Million |
Market growth is driven by rising demand for fast digital payments across online commerce and services. Businesses adopt crypto gateways to cut fees and reduce settlement time. Stablecoins improve trust by lowering price swings. Fintech firms expand blockchain-based payment tools for merchants. Growing smartphone use supports wallet adoption. Regulatory clarity in select markets boosts enterprise confidence. Cross-border trade benefits from lower conversion costs. Retailers target younger users who prefer digital assets. Payment processors also improve security and fraud control.
The Middle East leads adoption due to fintech hubs and strong digital policy support. The UAE and Saudi Arabia drive enterprise use through regulated sandbox programs. Africa shows fast growth from mobile-led payments and remittance needs. Nigeria and South Africa act as early adopters. North Africa sees steady uptake from e-commerce growth. Smaller Gulf states emerge with tourism-linked digital payments. Infrastructure gaps still limit rural reach. Urban centers remain the main demand drivers.
Market Insights:
- The MEA Crypto Payment Gateways Market was valued at USD 2,249.10 million in 2018, reached USD 3,684.92 million in 2024, and is projected to hit USD 6,442.20 million by 2032, expanding at a CAGR of 6.73%, driven by rising digital commerce and cross-border payment demand.
- The Middle East dominates with nearly 50% market share due to advanced fintech ecosystems, regulatory sandboxes, and high enterprise readiness, while Africa holds about 36% supported by mobile-first payments and remittance use, followed by North Africa and Rest of MEA at around 14% with steady e-commerce growth.
- Africa stands out as the fastest-growing region despite infrastructure gaps, holding roughly 36% share, driven by SME adoption, limited banking access, and strong demand for low-cost cross-border payment solutions.
- By customer size, enterprise merchants account for the largest share at roughly 35%, reflecting higher transaction volumes, compliance focus, and preference for scalable, secure gateway platforms.
- Aggregators and PSPs contribute close to 30% share, while SMBs and mid-market platforms together represent about 35%, supported by simplified onboarding needs and growing participation in digital trade.
Market Drivers:
Rapid Expansion Of Digital Commerce And Merchant Payment Modernization Needs
The MEA Crypto Payment Gateways Market benefits from strong growth in digital commerce across retail and services. Online merchants seek faster settlement cycles and lower payment friction to improve cash flow. Crypto gateways support direct value transfer without traditional banking delays. This payment structure improves liquidity control for merchants. Cross-border sellers prefer unified digital payment rails to reach global customers. Flexible checkout options support higher conversion rates. It strengthens merchant competitiveness in online channels.
- For instance, Binance Pay announced in November 2025, that it surpassed 20 million merchant acceptance points globally, enabled through QR-based and platform-integrated payment endpoints. The service supports 100+ digital assets and uses off-chain settlement technology to deliver near-instant, low-cost merchant payments, with stablecoins accounting for over 98% of B2C transactions on the platform.
High Cross-Border Trade Activity and Regional Remittance Dependence
The MEA Crypto Payment Gateways Market gains traction from high cross-border trade and remittance activity. Regional commerce requires fast and transparent settlement methods. Crypto payments reduce reliance on correspondent banking chains. Merchants limit currency conversion exposure through digital assets. Remittance-heavy corridors create stable transaction flows. Export-focused firms value blockchain traceability and settlement visibility. It improves working capital efficiency.
- For instance, Yellow Card processed transactions across more than 20 African countries by 2024, supporting regulated crypto-to-fiat settlement rails for cross-border merchant payments and remittance-linked commerce.
Fintech Ecosystem Growth And Blockchain Infrastructure Development
The MEA Crypto Payment Gateways Market advances through growing fintech ecosystems. Startups develop merchant-focused gateway platforms with simple interfaces. Blockchain APIs reduce integration complexity for businesses. Cloud-native systems support scalable transaction handling. Innovation hubs accelerate product testing cycles. Local customization improves merchant adoption. It enhances service availability and uptime.
Selective Regulatory Progress And Enterprise Risk Alignment
The MEA Crypto Payment Gateways Market gains support from selective regulatory progress. Sandbox frameworks allow controlled payment innovation. Clear rules improve enterprise risk assessment. Banks explore compliant crypto partnerships. Payment firms align systems with AML standards. Corporate users seek regulated digital payment alternatives. It encourages long-term platform investment.
Market Trends:
Growing Use of Stable Digital Assets for Merchant Settlements
The MEA Crypto Payment Gateways Market shows rising use of stable digital assets. Merchants prefer predictable settlement outcomes for daily transactions. Stable assets reduce pricing uncertainty. Gateways embed fiat-pegged payment options at checkout. Customers gain trust during payment authorization. Settlement automation improves success rates. It supports consistent transaction volumes. Stablecoin rails also simplify reconciliation for finance teams. Treasury planning becomes easier with reduced volatility exposure. This trend strengthens repeat merchant usage.
- For instance, CoinGate reported in its 2024 payments report that USDT surpassed Bitcoin as the most used payment asset, with stablecoins representing about 35% of all processed transactions, driven by merchant demand for settlement stability.
Mobile Wallet Integration Across Consumer and Merchant Platforms
The MEA Crypto Payment Gateways Market aligns with mobile wallet expansion. Wallet-first payment behavior gains traction across urban users. Super apps integrate crypto payment features. QR-based crypto payments enter retail environments. Mobile access improves payment reach. Gateways optimize interfaces for smartphones. It increases daily transaction frequency. One-tap checkout improves customer experience. Wallet interoperability supports multi-platform usage. This shift drives higher payment engagement.
- For instance, Binance Pay began rolling out QR-based crypto payments across select UAE retail locations from mid-2022, enabling mobile wallet checkouts without reliance on traditional card infrastructure through local merchant partnerships.
Enterprise Focus On Security, Compliance, and Audit Readiness
The MEA Crypto Payment Gateways Market trends toward stronger security frameworks. Providers deploy advanced custody controls. Continuous monitoring reduces fraud exposure. Compliance tools screen transactions in real time. Audit-ready records meet enterprise needs. Security assurance builds merchant trust. It supports higher-value payments. Enterprises demand clear reporting trails. Internal controls align with governance standards. This focus enables long-term enterprise adoption.
Modular API Adoption and Checkout Customization Demand
The MEA Crypto Payment Gateways Market favors modular gateway design. APIs enable tailored checkout workflows. Merchants control currency and wallet options. Plug-and-play tools shorten deployment time. Developers reduce setup effort. Customization supports diverse business models. It accelerates merchant onboarding. API flexibility supports rapid scaling. White-label options aid brand control. This approach improves platform adaptability.
Market Challenges Analysis:
Fragmented Regulatory Landscape and Compliance Complexity
The MEA Crypto Payment Gateways Market faces regulatory inconsistency across countries. Rules differ widely between jurisdictions. Licensing clarity remains uneven. Cross-border compliance raises operational cost. Policy shifts increase planning risk. Large merchants delay adoption decisions. It slows regional scaling efforts. Compliance teams face higher reporting burdens. Market entry timelines extend due to approvals. This environment favors well-capitalized providers.
Infrastructure Limitations and Consumer Trust Gaps
The MEA Crypto Payment Gateways Market encounters infrastructure and trust barriers. Internet quality varies across regions. Rural access remains limited. User education on crypto payments stays low. Security concerns affect consumer confidence. Fraud incidents impact public perception. It restricts mass-market adoption. Merchants invest more in user support. Trust-building campaigns gain importance. Gradual adoption follows education efforts.
Market Opportunities:
Merchant Digitization Across Emerging Urban Economies
The MEA Crypto Payment Gateways Market holds strong growth potential in emerging cities. Small merchants seek low-cost digital payment tools. Crypto gateways reduce entry barriers. Urban commerce adopts wallet-based payments. Youth-led digital adoption supports demand. Informal sectors explore blockchain settlements. It expands the merchant ecosystem. Local marketplaces digitize faster through mobile payments. Cashless acceptance improves transaction transparency. This shift supports formalization of small businesses.
Strategic Partnerships with Banks and Payment Networks
The MEA Crypto Payment Gateways Market can scale through institutional partnerships. Banks seek exposure to digital payment models. Gateways provide blockchain expertise. Joint models improve regulatory alignment. Hybrid fiat and crypto rails attract enterprises. Partnerships enhance customer trust. It strengthens long-term market position. Settlement reliability improves through banking ties. Compliance processes align with financial standards. These alliances support broader enterprise adoption.
Market Segmentation Analysis:
By Merchant Type
The MEA Crypto Payment Gateways Market shows varied adoption across merchant categories. E-commerce merchants lead adoption due to high online sales volumes and cross-border reach. Digital service providers adopt crypto to support instant settlement and global billing. Travel and tourism platforms prefer crypto to reduce card dependency and chargeback exposure. Gaming and entertainment platforms value fast processing for frequent low-value transactions. Subscription-based businesses use crypto for recurring payments and global customer access. It improves payment flexibility across multiple merchant segments.
- For instance, BitPay reported a 16% growth in crypto transactions within the gaming sector in 2025, with increasing usage across emerging markets in Asia and Latin America.
By Transaction Type
The MEA Crypto Payment Gateways Market reflects strong segmentation by transaction type. Domestic crypto payments support local digital commerce and merchant settlements. Cross-border crypto payments remain the primary demand driver due to speed and cost efficiency. Stablecoin-based transactions gain preference for predictable settlement value. Bitcoin and altcoin transactions serve specific user groups with higher risk tolerance. Merchants select transaction types based on customer profile and volatility exposure. It balances settlement speed, cost control, and risk management needs.
- For instance, NOWPayments highlighted in its 2024 Wrapped report that it introduced an "Auto-Processing Button" and expanded its fiat provider network to bridge crypto and traditional finance, enabling merchants to cater to a global audience.
By Customer Size
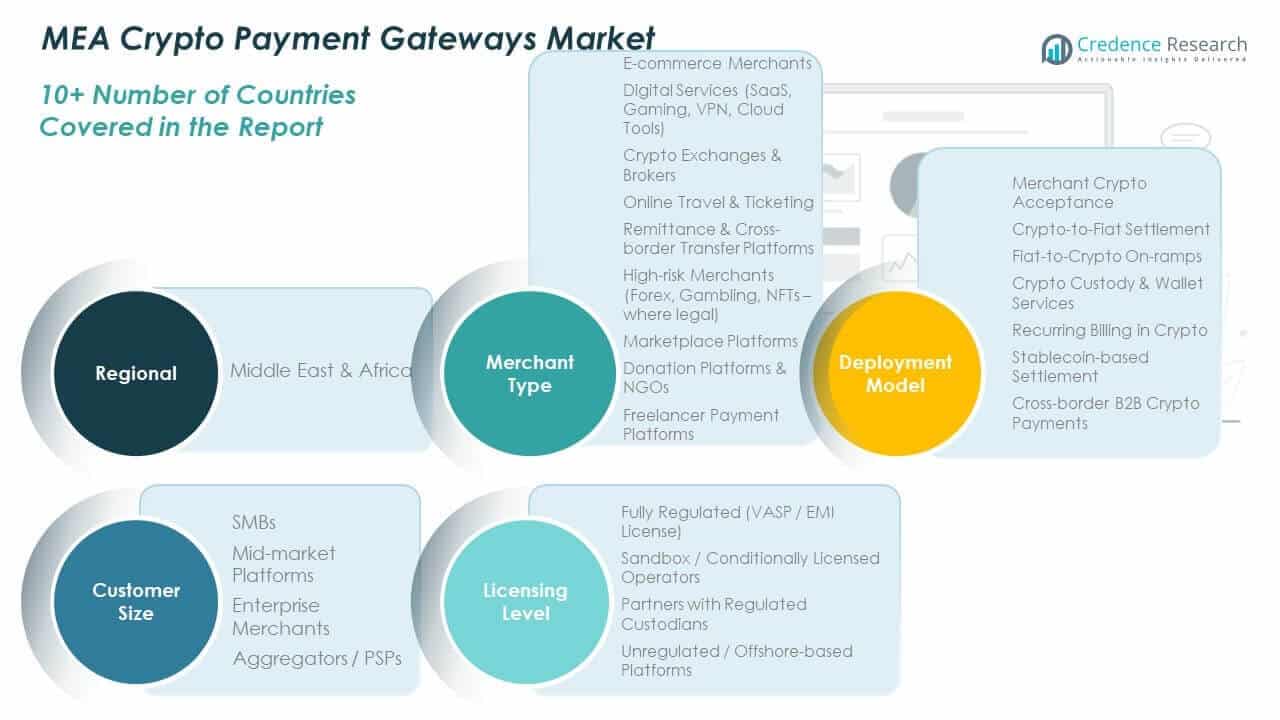
The MEA Crypto Payment Gateways Market adoption differs by customer size. Small and medium enterprises seek affordable and simple digital payment tools. Crypto gateways reduce entry barriers for SMEs entering online trade. Large enterprises focus on compliance, scalability, and system reliability. High transaction volumes require advanced risk controls. Integration capability influences enterprise gateway selection. It supports both emerging and mature business models.
By Licensing Level
The MEA Crypto Payment Gateways Market varies by licensing level. Fully licensed gateways attract banks and large enterprises seeking regulatory assurance. Partially regulated gateways serve markets with evolving frameworks. Unlicensed or offshore gateways appeal to merchants needing operational flexibility. Risk appetite shapes merchant preference across regions. Compliance strength influences long-term trust. It creates a layered and competitive ecosystem.
Segmentation:
By Merchant Type
- E-commerce merchants
- Digital service providers
- Travel and tourism platforms
- Gaming and entertainment platforms
- Subscription-based businesses
By Transaction Type
- Domestic crypto payments
- Cross-border crypto payments
- Stablecoin-based transactions
- Bitcoin and altcoin transactions
By Customer Size
- Small and medium enterprises
- Large enterprises
By Licensing Level
- Fully licensed gateways
- Partially regulated gateways
- Unlicensed or offshore gateways
By Country
- United Arab Emirates
- Saudi Arabia
- Nigeria
- South Africa
- Egypt
- Kenya
- Rest of Middle East & Africa
Regional Analysis:
Middle East
The MEA Crypto Payment Gateways Market shows strong concentration in the Middle East region. The Middle East accounts for nearly 50% market share due to advanced fintech infrastructure and higher enterprise readiness. The United Arab Emirates leads adoption with clear regulatory frameworks and active sandbox programs. Saudi Arabia follows with growing use across e-commerce and digital services. High digital wallet penetration supports crypto-based checkout acceptance. Strong cross-border trade activity sustains transaction demand. It benefits from capital availability and strong payment infrastructure.
Africa
The MEA Crypto Payment Gateways Market demonstrates rapid growth across Africa. Africa holds around 36% market share, supported by mobile-first payment behavior. Nigeria leads due to a large crypto user base and remittance dependence. South Africa follows with enterprise-led adoption and fintech maturity. Limited access to traditional banking increases crypto payment relevance. Small and medium enterprises use gateways to reach international customers. It grows faster than the Middle East despite infrastructure challenges.
North Africa And Rest Of MEA
The MEA Crypto Payment Gateways Market shows gradual adoption across North Africa and other MEA countries. This segment represents close to 14% market share. Egypt leads due to expanding e-commerce and digital payment investment. Morocco and Kenya show steady merchant onboarding supported by fintech growth. Tourism-linked payments encourage crypto acceptance in select markets. Regulatory clarity varies across countries and slows adoption. It offers long-term expansion potential with improved policy alignment.
Key Player Analysis:
- CoinPayments
- NOWPayments
- Plisio
- BitPay
- CoinGate
- Binance Pay
- Fasset
- Rain
- Yellow Card
- Luno
Competitive Analysis:
The MEA Crypto Payment Gateways Market features a moderately fragmented competitive structure. Global players compete with regional specialists across licensing strength and integration depth. Leading providers focus on secure settlement, stablecoin support, and merchant-friendly APIs. Regional firms differentiate through local compliance and banking access. Partnerships with fintech platforms strengthen distribution reach. Product reliability and onboarding speed shape merchant choice. It remains innovation-driven with focus on compliance readiness and scalability. Competitive intensity encourages rapid feature upgrades. Brand trust and regulatory alignment influence long-term positioning.
Recent Developments:
- In November 2025, CoinPayments marked its re-entry into the United States market, a natural progression in scaling its global infrastructure to meet growing demand. The company focuses on high-growth sectors including fashion, luxury retail, travel, and e-commerce, serving 1 million wallet users globally while maintaining ISO 27001 certification for compliance and data integrity.
- In October 2025, NOWPayments rolled out significant platform updates focused on improving user experience and transaction efficiency. The updates encompassed unified design consistency across all platform sections, faster custody operations with balances loading in just one minute instead of extended delays, enhanced payment integration documentation, and improved team communication tools.
- In October 2025, BitPay announced a strategic partnership with ACI Worldwide, an original innovator in global payments technology. This collaboration expands BitPay's digital asset solutions through ACI's Payments Orchestration Platform, enabling merchants and payment service providers to seamlessly accept and manage digital currencies including stablecoins as a strategic complement to traditional payment rails.
- In September 2025, Binance Pay expanded its African footprint through a strategic partnership with Zapper, one of South Africa's leading payment providers. This integration enabled over 31,000 additional South African merchants to accept cryptocurrency payments, significantly expanding the global merchant network to more than 63,000 locations including major chains like KFC, Wimpy, and Mugg & Bean, alongside fuel providers Total and Sasol.
Report Coverage:
The research report offers an in-depth analysis based on merchant type, transaction type, customer size and licensing level. It details leading market players, providing an overview of their business, product offerings, investments, revenue streams, and key applications. Additionally, the report includes insights into the competitive environment, SWOT analysis, current market trends, as well as the primary drivers and constraints. Furthermore, it discusses various factors that have driven market expansion in recent years. The report also explores market dynamics, regulatory scenarios, and technological advancements that are shaping the industry. It assesses the impact of external factors and global economic changes on market growth. Lastly, it provides strategic recommendations for new entrants and established companies to navigate the complexities of the market.
Future Outlook:
- Digital commerce expansion will sustain gateway demand across retail and service platforms, driven by rising online transactions and cross-border merchant activity.
- Stablecoin usage will rise due to predictable settlement values, helping merchants manage pricing risk and daily cash reconciliation more effectively.
- Cross-border payments will remain the core growth engine, supported by faster settlement, lower fees, and reduced dependence on correspondent banking.
- SME adoption will increase through simplified onboarding tools, lightweight compliance processes, and easy integration with existing sales channels.
- Enterprise demand will focus on compliance-ready platforms that support audit trails, regulatory reporting, and scalable transaction handling.
- Mobile wallet integration will expand daily transaction use as consumers prefer QR-based, app-driven payment experiences over cards.
- Security investments will gain priority among providers to address fraud risk, custody protection, and enterprise-grade data controls.
- Regional regulations will move toward clearer frameworks, improving legal certainty and encouraging institutional participation in crypto payments.
- Bank–fintech partnerships will reshape payment ecosystems by combining blockchain rails with trusted fiat settlement infrastructure.
- Platform differentiation will rely on API flexibility, system uptime, and the ability to customize checkout flows for diverse merchant needs.
Request a Free Sample
Fill in your details and we'll send you a free sample report.
- Sample data tables & charts
- Research methodology
Need a Custom Version of This Report?
Tailor the scope, geography, or segments to your exact requirements.
- Custom geography or segment scope
- Direct access to our analyst team
Frequently Asked Questions
What is the current market size for MEA Crypto Payment Gateways Market, and what is its projected size in 2032?
At what Compound Annual Growth Rate is the MEA Crypto Payment Gateways Market projected to grow between 2024 and 2032?
Which MEA Crypto Payment Gateways Market segment held the largest share in 2024?
What are the primary factors fueling the growth of the MEA Crypto Payment Gateways Market?
Who are the leading companies in the MEA Crypto Payment Gateways Market?
Which region commanded the largest share of the MEA Crypto Payment Gateways Market in 2024?
Table of Content
Chapter 1. Report Introduction
- 1.1 Report Description & Purpose
- 1.1.1 Report Title & Market Definition
- 1.1.2 Unique Selling Propositions (USP) & Key Differentiators
- 1.1.3 Value Proposition for Stakeholders
- 1.2 Research Objectives
- 1.2.1 Market Sizing Objectives (Volume & Revenue)
- 1.2.2 Segmentation Objectives
- 1.2.3 Competitive Intelligence Objectives
- 1.2.4 Forecast & Scenario Objectives
- 1.3 Report Scope
- 1.3.1 MEA Crypto Payment Gateways Scope – Types & Subtypes Covered
- 1.3.2 Geographic Scope – Regions & Countries Covered
- 1.3.3 Historical Period, Base Year & Forecast Period (2024; forecast to 2032)
- 1.3.4 Inclusions & Exclusions
- 1.4 HS Code & Classification Framework
- 1.5 Currency, Units & Pricing Basis
- 1.6 Target Stakeholders
- 1.7 Limitations & Assumptions
Chapter 2. Executive Summary
- 2.1 Global MEA Crypto Payment Gateways Market Snapshot
- 2.1.1 Market Size – Historical (2024) & Forecast (2024-2032) (2024: USD 3,684.92 million → 2032: USD 6,442.20 million)
- 2.1.2 Volume & Revenue – Global Totals
- 2.1.3 Key Market Highlights – Top Five Facts
- 2.2 MEA Crypto Payment Gateways Market Segmentation Snapshot
- 2.2.1 Market Split by Region – 2024 vs. 2032
- 2.3 Competitive Snapshot
- 2.3.1 Top 10 Players by Revenue Share – 2024
- 2.3.2 Top 10 Players by Volume Share – 2024
- 2.3.3 Recent Strategic Developments (18-Month Summary)
- 2.4 Key Investment Highlights & Strategic Conclusions
Chapter 3. MEA Crypto Payment Gateways Market Dynamics & Industry Analysis
- 3.1 Market Overview & Context
- 3.1.1 MEA Crypto Payment Gateways Market Position in the Broader Automotive Value Chain
- 3.1.2 OEM vs. Replacement Market Dynamics
- 3.1.3 Market Maturity & Development Stage by Region
- 3.2 MEA Crypto Payment Gateways Market Drivers
- 3.3 MEA Crypto Payment Gateways Market Restraints & Challenges
- 3.4 MEA Crypto Payment Gateways Market Opportunities
- 3.5 Porter's Five Forces Analysis
- 3.5.1 Threat of New Entrants
- 3.5.2 Bargaining Power of Suppliers
- 3.5.3 Bargaining Power of Buyers
- 3.5.4 Threat of Substitutes
- 3.5.5 Competitive Rivalry – Intensity Assessment
- 3.6 MEA Crypto Payment Gateways Value Chain Analysis
- 3.6.1 Upstream – Raw Material/Input Suppliers
- 3.6.1.1 Raw Material/Input 1
- 3.6.1.2 Raw Material/Input 2
- 3.6.1.3 Raw Material/Input 3
- 3.6.2 Midstream – Production/Manufacturing/Service Delivery
- 3.6.2.1 Production/Process Overview
- 3.6.2.2 Key Facility Locations & Capacity by Manufacturer
- 3.6.3 Downstream – Distribution & End Consumer
- 3.6.3.1 Primary Channel – B2B/OEM
- 3.6.3.2 Secondary Channels – Dealer, Retail, Online, Direct
- 3.6.4 Value Chain Profitability Analysis
- 3.6.1 Upstream – Raw Material/Input Suppliers
- 3.7 PESTEL Analysis
- 3.7.1 Political Factors
- 3.7.2 Economic Factors
- 3.7.3 Social Factors
- 3.7.4 Technological Factors
- 3.7.5 Environmental Factors
- 3.7.6 Legal Factors
- 3.8 MEA Crypto Payment Gateways Supply Chain Analysis
- 3.8.1 Raw Material/Input Supply Risk Assessment
- 3.8.2 Manufacturing Concentration Risk (Geographic Exposure)
- 3.8.3 Trade Disruption Impact Analysis
- 3.9 Regulatory & Policy Landscape
Note: The regulatory and policy landscape section covers regulations based on their applicability to the market, MEA Crypto Payment Gateways category, geography, and scope of the study. Only regulatory frameworks with a material impact on operations, compliance, trade, sustainability, or market access are analyzed in detail.
Chapter 4. Key Investment Pockets & Opportunity Analysis
- 4.1 MEA Crypto Payment Gateways Market Attractiveness Analysis
- 4.1.1 By Region – Investment Attractiveness Matrix (Volume × CAGR)
- 4.2 Absolute Revenue Growth Opportunity
- 4.2.1 By Region – Absolute USD Growth Through 2032
- 4.3 Incremental Volume Opportunity
- 4.3.1 By Region – Incremental Volume Through 2032
- 4.3.2 Segment – Incremental Volume
- 4.4 Emerging Submarket Opportunity Deep Dive (Subject to Applicability)
- 4.5 Emerging Market Opportunity Scorecards
- 4.5.1 United States
- 4.5.2 Europe
- 4.5.3 Asia
- 4.5.4 Middle East & Africa
Note: Emerging Market Opportunity Scorecards will be included based on relevance and strategic importance. Regions listed are indicative and may vary depending on data availability and market dynamics.
Chapter 5. MEA Crypto Payment Gateways Import-Export Analysis & Trade Flows
- 5.1 Global Trade Overview
- 5.1.1 Global Export Value by Country (2024)
- 5.1.2 Global Export Volume by Country (2024)
- 5.1.3 Global Import Value by Country (2024)
- 5.1.4 Global Import Volume by Country (2024)
- 5.1.5 Net Trade Balance by Country (2024)
- 5.2 Export Analysis – Segment
- 5.2.1 Type 1 (HS Code)
- 5.2.2 Type 2 (HS Code)
- 5.2.3 Type 3 (HS Code)
- 5.2.4 Type 4 (HS Code)
- 5.2.5 Type 5 (HS Code)
- 5.3 Import Analysis – Segment
- 5.3.1 Type 1 (HS Code)
- 5.3.2 Type 2 (HS Code)
- 5.3.3 Type 3 (HS Code)
- 5.3.4 Type 4 (HS Code)
- 5.3.5 Type 5 (HS Code)
- 5.4 Average Unit Trade Prices
- 5.4.1 Average Export Price – Segment & Country
- 5.4.2 Average Import Price – Segment & Source Country
- 5.4.3 Price Trends (2024)
- 5.5 Key Trade Route Analysis
- 5.5.1 Trade Route 1
- 5.5.2 Trade Route 2
- 5.5.3 Trade Route 3
- 5.5.4 Trade Route 4
- 5.5.5 Trade Route 5
- 5.6 Trade Policy Impact Assessment
- 5.6.1 US Anti-Dumping & Section 301 Tariffs
- 5.6.2 EU Customs Union Impact
- 5.6.3 Major Free Trade Agreements
- 5.6.4 USMCA Rules of Origin
Note: Trade policy analysis will be included only where relevant to the MEA Crypto Payment Gateways market.
Chapter 6. Competitive Landscape & Company Benchmarking
- 6.1 MEA Crypto Payment Gateways Market Concentration & Structure
- 6.1.1 Herfindahl-Hirschman Index (HHI) – vs. 2024
- 6.1.2 Tier 1, Tier 2 & Tier 3 Market Structure
- 6.1.3 Global, Regional & Local Player Dynamics
- 6.2 MEA Crypto Payment Gateways Market Share Analysis – 2024
- 6.2.1 Global Revenue Share by Company
- 6.2.2 Global Volume Share by Company
- 6.2.3 Regional Revenue Share
- 6.2.4 Market Share Evolution ( vs. 2024)
- 6.2.5 OEM Segment Share by Company
- 6.2.6 Replacement Segment Share by Company
- 6.3 Production/Delivery Capacity & Facility Analysis
- 6.3.1 Global Installed Capacity
- 6.3.2 Capacity Utilization Rates
- 6.3.3 Production/Output Volume
- 6.3.4 Facility Locations & Capacity Map
- 6.3.5 Planned Capacity Additions
- 6.4 MEA Crypto Payment Gateways Competitive Benchmarking Matrix
- 6.4.1 Revenue, Volume, CAGR & Profitability Comparison
- 6.4.2 Channel Revenue Mix
- 6.4.3 Geographic Revenue Exposure
- 6.4.4 R&D Intensity
- 6.4.5 Sustainability Maturity
- 6.5 Strategic Developments in MEA Crypto Payment Gateways (Last 24 Months)
- 6.5.1 Mergers, Acquisitions & Divestments
- 6.5.2 New MEA Crypto Payment Gateways Launches
- 6.5.3 Facility Expansions
- 6.5.4 Strategic Alliances, Joint Ventures & Partnerships
- 6.5.5 Distribution Expansion & Market Entry
- 6.5.6 Sustainability & ESG Initiatives
- 6.6 Competitive Strategy Mapping
- 6.6.1 Leader, Challenger, Follower & Niche Classification
- 6.6.2 Pricing Strategy Comparison
- 6.6.3 Channel Strategy Matrix
Note: Strategic developments are included based on their materiality and the availability of reliable information.
Chapter 7. Global MEA Crypto Payment Gateways Market – By Distribution Channel
- 7.1 Segment Overview
- 7.1.1 Volume & Revenue Split by Channel (2024 & 2032)
- 7.1.2 Channel Mix Evolution (2024-2032)
Chapter 8. Regional Market Analysis – Global Overview
- 8.1 Global Regional Overview
- 8.1.1 Regional Volume Share
- 8.1.2 Regional Revenue Share
- 8.1.3 Regional Volume by Region
- 8.1.4 Regional Revenue by Region
- 8.1.5 Regional Forecast Through 2032
- 8.2 Cross-Regional Segment Analysis
- 8.2.1 By Distribution Channel
- 8.2.2 By Brand/Price Tier
Chapter 9. North America MEA Crypto Payment Gateways Market
- 9.1 United States
- 9.2 Canada
- 9.3 Mexico
Chapter 10. Europe MEA Crypto Payment Gateways Market
- 10.1 Germany
- 10.2 France
- 10.3 Italy
- 10.4 United Kingdom
- 10.5 Spain
- 10.6 Poland
- 10.7 Russia
- 10.8 Netherlands
- 10.9 Belgium
- 10.10 Sweden
- 10.11 Denmark
- 10.12 Norway
- 10.13 Rest of Europe
Chapter 11. Asia Pacific MEA Crypto Payment Gateways Market
- 11.1 China
- 11.2 India
- 11.3 Japan
- 11.4 South Korea
- 11.5 Thailand
- 11.6 Indonesia
- 11.7 Vietnam
- 11.8 Malaysia
- 11.9 Australia
- 11.10 Rest of Asia Pacific
Chapter 12. Latin America MEA Crypto Payment Gateways Market
- 12.1 Brazil
- 12.2 Argentina
- 12.3 Colombia
- 12.4 Chile
- 12.5 Rest of Latin America
Chapter 13. Middle East MEA Crypto Payment Gateways Market
- 13.1 Saudi Arabia
- 13.2 United Arab Emirates
- 13.3 Turkey
- 13.4 Israel
- 13.5 Iran
- 13.6 Rest of the Middle East
Chapter 14. Africa MEA Crypto Payment Gateways Market
- 14.1 South Africa
- 14.2 Egypt
- 14.3 Nigeria
- 14.4 Morocco
- 14.5 Rest of Africa
Chapter 15. MEA Crypto Payment Gateways Company Profiles
- 15.1 [Company 01]
- 15.1.1 Company Overview
- 15.1.2 Key Management Personnel
- 15.1.3 Products & Services Portfolio
- 15.1.4 Financial Performance
- 15.1.5 Key Market Focus & Geographic Presence
- 15.1.6 Recent Developments & Strategic Initiatives
Note: The company profile list is preliminary and may change based on research findings, market developments, data availability, and client requirements.
Chapter 16. Appendices
- Appendix A – List of Abbreviations & Acronyms
- Appendix B – Industry Classification Code Reference – Full Series
- Appendix C – Production & Capacity Data Tables
- Appendix D – End-Use & Demand Base Tables
- Appendix E – Consumption & Replacement Rate Assumptions
- Appendix F – ASP Reference Tables
- Appendix G – Manufacturing & Facility Database
- Appendix H – Import-Export Data Tables
- Appendix I – Regulatory Summary Tables
- Appendix J – Primary Research Participant List (Anonymized)
- Appendix K – Primary Research Questionnaire Framework
- Appendix L – Data Sources & Bibliography
- Appendix M – Market Size Divergence & Source Comparison
Chapter 17. Research Methodology
- 17.1 Research Framework & Philosophy
- 17.2 Secondary Research – Sources, Hierarchy & Data Extraction
- 17.3 Data Modeling – Bottom-Up & Top-Down Market Sizing
- 17.4 Primary Research – Stakeholder Framework, LOI & Sample Sizes
- 17.5 Forecast Methodology – Regression, Scenario & Sensitivity Analysis
- 17.6 Quality Control – Four-Layer Validation Framework
- 17.7 Limitations & Standard Assumptions
- 17.8 Disclaimer
