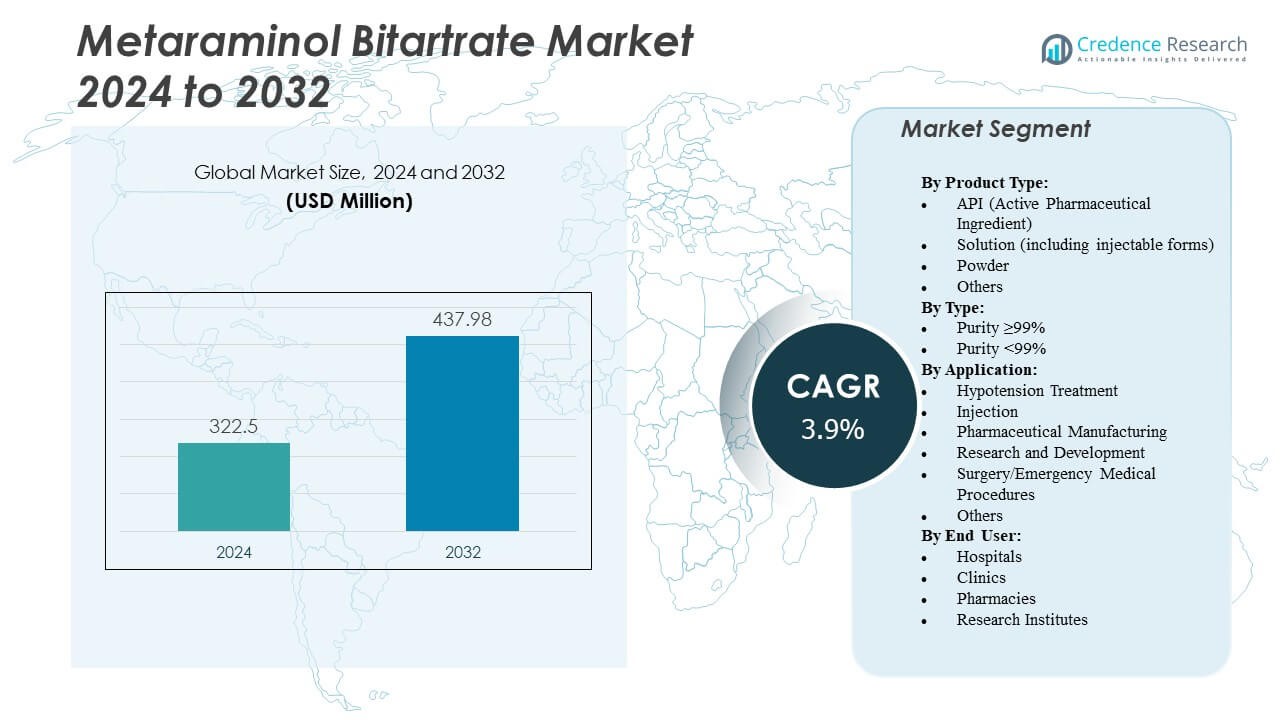
Chemical
Home » Metaraminol Bitartrate Market

Metaraminol Bitartrate Market

Metaraminol bitartrate market research by application (hypotension treatment, anesthesia), type (API, solution) End users (hospitals, clinics, pharmacies, medical research institutions, others)- Growth, Future Prospects & Competitive Analysis, 2016 – 2030
Report Book

Published Date: Sep 2023
Category: Chemicals
Report ID: 62106
Report Format: PDF
No of Pages: 227

Rating: Credence Reports

Market Insights

  • The market for metaraminol bitartrate is expected to reach a value of usd 18.86 million by 2030, with a compound annual growth rate of 5.07% between 2023 and 2030.
  • Currently, north america holds the highest market share, more than 40%, followed by other regions such as europe, asia pacific, latin america, the middle east, and africa.
  • According to market segmentation, the hospital segment is the dominating end-user market, as the demand for drugs to stabilize blood pressure during surgeries and medical procedures continues to rise.
  • The hypotension treatment is at the forefront of the application market due to the increasing demand for sympathomimetic agents like metaraminol bitartrate.

Metaraminol bitartrate market

Executive Summary

Market Definition

Our metaraminol bitartrate global market report studies its growth from every angle. The result is a better understanding of the market dynamics, price trends, supply and demand fluctuations, price trends, market estimation, and demand forecasts.

Metaraminol bitartrate is a sympathomimetic agent that acts at the alpha-1 adrenergic receptors and is used primarily in the treatment of hypotension. Metaraminol bitartrate is a vasoconstrictor with a molecular weight of 317.29 g/mol.

Metaraminol bitartrate increases both systolic and diastolic blood pressure and is indicated in the treatment and prevention of acute hypotensive state, which occurs with spinal anesthesia. Metaraminol bitartrate is also used as hypotension adjunctive treatment resulting due to medication reactions, hemorrhage, surgical complications, and brain damage shock due to tumor or trauma.

Market Overview

There is a growth in the metaraminol bitartrate market driven by an increase in demand for drugs, which are indicated in the treatment of hypotension, and to support and stabilize blood pressure during the use of anesthesia. By 2030, this market is expected to grow and generate a revenue of usd 18.86 million, with a cagr of 5.07%. Currently, north america holds the largest number of metaraminol bitartrate market shares, with over 40% of shares. The hospital segment succeeds other end-user segments.

The major drivers behind the growth of the metaraminol bitartrate market are the demand for drugs to treat hypotension during surgery and the growth of medical facilities and healthcare infrastructure around the globe.

Segmentation By Application

  • Hypotension treatment: hypotension treatment dominates the application market of metaraminol bitartrate. Metaraminol bitartrate is used to prevent acute hypotensive state that occurs with spinal anesthesia. It primarily stimulates the alpha-1 receptors that increase blood pressure and treats serious hypotension. It also stimulates the norepinephrine release and is used as an adjunctive treatment for hypotension resulting from shock associated with brain damage, hemorrhage, spinal anesthesia, etc.
  • Anesthesia: metaraminol bitartrate is a vasopressor that is used to maintain arterial pressure when spinal anesthesia is given. The drug is typically given before cesarean delivery or for cv support in women with septic shock. The continuous advancements in surgical and anesthesia techniques are the major driving force behind metaraminol bitartrate’s market growth.

Segmentation By Type

  • The metaraminol bitartrate market is categorized according to the drug type. The global metaraminol bitartrate market value and revenue are dominated by several manufacturers, exporters, and distributors dealing with the api and solution form of the drug.
  • The api market is majorly driven by the lower cost of raw materials and lower production costs.
  • Apis offer a better and more cost-effective solution to pharmaceutical companies that are planning to manufacture drugs on a larger scale.
  • The growing demand for metaraminol bitartrate is expected to increase, driving the growth of the metaraminol bitartrate api market.

Segmentation By End Users

  • The growing market of metaraminol bitartrate is largely affected by the growth in demand for drugs that support blood pressure and treat hypotension during anesthesia.
  • Currently, the hospital segment is the most prominent end-user market segment of metaraminol bitartrate.
  • Closely following hospitals are clinics, pharmacies, medical research institutions, and other end-user markets.
  • However, regulatory factors, global policies, inflation, side effects, and safety of the drug can have a significant impact on the growth of the metaraminol bitartrate market.

Segmentation By Region

  • North america surpasses every other region in the world by having the largest number of shares in the metaraminol bitartrate global market.
  • In 2022, north america had the major shares, and during the forecast period, the region is expected to witness even faster growth in the metaraminol bitartrate market.
  • North america fuels the growth of metaraminol bitartrate the most due to the growing healthcare infrastructure and advanced development in medical facilities throughout the region.
  • After north america, the major share in metaraminol bitartrate global market is secured by asia pacific, with a cagr of above 5.20%.
  • Asia pacific is expected to have significant growth in the market during the forecast period.
  • Latin america, europe, the middle east, and africa have a cagr of 5.0%, 3.70%, and 2.10%, respectively.

Metaraminol bitartrate market regional analysis

Many of the major pharmaceutical companies are based in the united states. This is why it is no surprise that north america has the largest share of the metaraminol bitartrate global market. This region is at the forefront of medical research. The focus on specialty drugs, over-the-counter medicines, and generic drugs is also increasing. By comparison with other regions, north america is expected to witness the fastest growth in the metaraminol bitartrate market during the forecast period, with asia pacific following close by.

Key Highlights of the report

This global metaraminol bitartrate market report is segmented by metaraminol bitartrate type, applications, end users, and region. The most important factor propelling the growth metaraminol bitartrate global market is the rise in demand for drugs treating hypotension and stabilizing blood pressure during spinal anesthesia. The growing need for adrenergic agonists like metaraminol bitartrate is boosting its global market size. These drugs are widely used to manage hypotension in surgical settings when anesthetics are used. Metaraminol bitartrate is also used to treat shock, which is associated with brain damage, and for the prevention of hypotension due to spinal anesthesia and hemorrhage.

It is unsurprising that north america holds the greatest share of the worldwide metaraminol bitartrate market because of the tremendous growth of the healthcare setup. The market is expected to grow the fastest in this region. Apart from that, asia pacific is also expected to witness fast growth in the forecast period. This is because the gaining population, rising consumer expectations, shifting demographics, and technological innovations are increasing the demand for rapid healthcare infrastructure growth.

What are the main drivers of the global wired interface market?

The main factors that propel the movement of metaraminol bitartrate forward are the growing demand for drugs that can treat the hypotensive state during surgical operations under the influence of anesthesia, the use of such agents for the stabilization of blood pressure during surgical and medical procedures, and the fast growth of an adequate healthcare infrastructure that needs a reliable and advanced supply of pharmaceuticals and other materials.

What are the major challenges faced by the global wired interface market?

The factors that limit the growth of the global metaraminol bitartrate market include regulatory factors, which highly affect the demand and supply of generic drugs, and adverse drug reactions and safety of the medicinal agent metaraminol bitartrate, which can have a significant effect on the economy and clinical costs of the drug.

What are the growth opportunities in the global wired interface market?

The major regions of north america and asia pacific are emerging markets for metaraminol bitartrate, as such countries are developing prosperous aspects for the metaraminol bitartrate global market, offering significant growth opportunities due to many factors like population size, government initiatives, and healthcare needs. Furthermore, the metaraminol bitartrate market also grows due to the expansion of research and development aspects. The latest advancements in anesthesia techniques and surgical procedures also boost the market growth, as metaraminol bitartrate is used in such medical interventions to treat hypotension and stabilize blood pressure.

Market drivers

The metaraminol bitartrate global market is influenced by some key market drivers, which are as follows;

Growing demand of drugs that can prevent or treat hypotension:

The drugs that are used for anesthesia induction can have a serious effect on systemic vascular resistance and hence arterial blood pressure. Sustained hypotension, during and after surgery, can lead to major complications such as hypoperfusion, organ failure, and even postoperative morbidity and mortality. This is why there is a significant growth in the global demand for metaraminol bitartrate and other potent adrenergic agonists that are used in the treatment and prevention of hypotension.

Use of metaraminol bitartrate in surgeries and anesthesia procedures:

Anesthesia drugs can cause blood pressure to drop during surgical and medical procedures. Thus pharmacological intervention is important to manage blood pressure levels in order to prevent organ damage and other complications. The use of metaraminol bitartrate is significantly rising as it acts as a vasoconstrictor and helps treat hypotension and stabilize blood pressure.

Growth of healthcare infrastructure and medical facilities:

The multiple and advanced healthcare infrastructure and medical facilities across the world demand new and more effective drugs to transform pharmacological intervention in the healthcare system. Metaraminol bitartrate is one of the emerging drugs that is witnessing an increase in demand for the treatment of hypotension when anesthesia procedures are used.

Market restraints

The global metaraminol bitartrate is restricted by the following challenges that interfere with its growth;

Regulatory factors:

All countries that control and allow the entry of drugs into the market have one primary objective, which is ensuring drug safety. Thus securing drug approval and obtaining marketing approval can be time-consuming and extremely costly. For example, the fda approval process for new drugs in the usa has several stages that include an application for human testing approval, safety tests, efficacy tests, long-term reactions, application for the approval of new drugs, and post-market testing.

Side effects and safety profile of metaraminol bitartrate:

Serious side effects of metaraminol bitartrate can include heart throbbing, tachycardia, bradycardia, heart ventricle rhythm problems, trouble breathing, and hypertension. The adverse drug reactions can have a dramatic effect on the clinical and economic aspects of the metaraminol bitartrate global market.

Opportunities

The following factors offer significant growth opportunities to the metaraminol bitartrate global market;

Research and development:

Intraoperative hypotension still remains a major factor that is associated with deaths related to anesthesia. This is why there is a huge amount of investment devoted to research and development in this area. The hypotension episodes due to anesthesia during surgery must be treated immediately with iv vasoconstrictors, and metaraminol bitartrate helps with just that. This drug treats and prevents hypotension during surgery and helps stabilize blood pressure levels. The effect of iv metaraminol bitartrate injection starts after 1 to 2 minutes, and it has a high protein binding – approximately 45%.

Emerging markets:

Emerging market economies like china, india, brazil, and south africa offer significant growth opportunities for the metaraminol bitartrate global market as the population size, demand for new and developed drugs, healthcare needs, and government initiatives rise in these areas. Investments in these newly developed healthcare infrastructures are expected to result in higher market growth.

Continued advancements in surgical and anesthesia techniques:

Active clinical research is carried out in various services and techniques of anesthesia. The clinical research also involves testing new and potentially therapeutic drugs, care pathways, and prospective interventional approaches. The continuously advancing field of surgical and medical procedures and anesthesia techniques increase the demand for metaraminol bitartrate, which is used to stabilize and control blood pressure levels during the procedure.

Key players

This metaraminol bitartrate market report includes a section exclusively devoted to the key players in this industry. The research done by our analysts digs deeper into their growth strategies, market ranking, and market shares. The major players that are studied in this report are;

  • Spectrum chemical manufacturing corp.
  • Sinoway
  • Toronto research chemicals
  • Biosynth ag
  • Laboratori alchemia
  • Chengdy shuxi pharmaceutical co., ltd.
  • Abx gmbh
  • Wuhan fortuna chemical co., ltd.
  • Sphinx scientific laboratory (tianjin) co., ltd
  • Others.

Spectrum chemical manufacturing was founded in 1971 and remains one of the most comprehensive and largest sources of apis in the world. Along with apis, spectrum chemical manufacturing also manufactures and distributes dea controlled substances (schedules i-v) and multi-compendial chemicals. It is a fine chemical manufacturing company which is headquartered in new jersey, us.

Spectrum chemical mfg. Corp. Is a key player and holds a large share in the global metaraminol bitartrate market. It is a division of spectrum laboratory products, inc. Other key players continue to stay ahead of their game by offering more safety, innovation, and development in the global metaraminol bitartrate market.

Summary of key findings

  • Metaraminol bitartrate acts at the alpha-1 adrenergic receptors and is used primarily in the treatment of hypotension and to stabilize blood pressure levels during the use of anesthesia techniques.
  • The metaraminol bitartrate market is segmented by application, type, end users, and region.
  • North america holds more than 40% of market shares, the highest followed by other regions such as europe, asia pacific, latin america, middle east, and africa.
  • The hospital segment succeeds other end-user segments such as clinics, pharmacies, and medical research institutions.
  • The metaraminol bitartrate market is highly competitive and includes key players like spectrum chemical manufacturing corp., sinoway, toronto research chemicals, biosynth ag, laboratori alchemia, chengdy shuxi pharmaceutical co., ltd., abx gmbh, wuhan fortuna chemical co., ltd., sphinx scientific laboratory (tianjin) co., ltd, and others.

Future outlook

  • North america is to witness the fastest growth in the metaraminol bitartrate market, with asia pacific close behind.
  • The major factors that govern the growth and expansion of the global metaraminol bitartrate market are the growing demand for hypotension treatment drugs, the use of metaraminol bitartrate in surgeries, and the growth of healthcare infrastructure around the world.
  • The key players must focus on emerging market opportunities, research and development, and continuous advancements in the medical interventions industry in order to stay ahead of their competition.

Segmentation

  • By Application
    • Hypotension treatment
    • Anesthesia
  • By Type
    • Api
    • Solution
  • By End user
    • Hospital
    • Clinics
    • Pharmacy
    • Medical research institutions
    • Others
  • By Region
    • North america
      • Us
      • Canada
      • Mexico
    • Europe
      • France
      • Germany
      • Italy
      • Spain
      • Russia
      • Benelux
      • Sweden
      • Denmark
      • Poland
      • Austria
      • Rest of europe
    • Asia pacific
      • China
      • Japan
      • South korea
      • India
      • Thailand
      • Indonesia
      • Vietnam
      • Malaysia
      • Philippines
      • Taiwan
      • Rest of asia pacific
    • Latin america
      • Brazil
      • Argentina
      • Colombia
      • Chile
      • Peru
      • Rest of latin america
    • Middle east
      • Israel
      • Turkey
      • Iran
      • Rest of the middle east and africa
    • Africa
      • South africa
      • Egypt
      • Nigeria
      • Algeria
      • Morocco
      • Rest of africa

Adjacent markets

In the global metaraminol bitartrate market, there are other adjacent markets that certainly have high revenue growth potential. These key adjacent markets include;

Report Report Report
Vasopressors and pressor agents Anesthesia medications Hypotension treatment
Critical care pharmaceuticals Cardiovascular medications Antihypertensive medications
Preventive health services

Chapter No. 1 :  Introduction   27

1.1.         Report Description   27

1.1.1.     Purpose of the Report  27

1.1.2.     USP & Key Offerings  27

1.2.         Key Benefits for Stakeholders  27

1.3.         Target Audience   28

1.4.         Report Scope   29


Chapter No. 2 :  Executive Summary  31

2.1.         Metaraminol Bitartrate Market Snapshot  31

2.2.         Global Metaraminol Bitartrate Market, 2017 – 2022 (Kilo Tons) (USD Million)  32


Chapter No. 3 :  Impact Analysis of COVID 19 & Russia-Ukraine War on Metaraminol Bitartrate Market  34

3.1.         Impact Assessment of COVID-19 Pandemic, By Region   34

3.1.1.     Supply chain disruptions  34

3.1.2.     Demand fluctuations  34

3.1.3.     Shift in product mix  34

3.1.4.     Reduced industrial activity  34

3.1.5.     Temporary disruptions and delays  34

3.1.6.     Shift in focus towards essential services  34

3.2.         Russia-Ukraine War Impacts  35

3.2.1.     Uncertainty and economic instability  35

3.2.2.     Supply chain disruptions  35

3.2.3.     Regional market shifts  35

3.2.4.     Shift in government priorities  35


Chapter No. 4 :  Metaraminol Bitartrate Market – Industry Analysis  36

4.1.         Introduction   36

4.2.         Market Drivers  37

4.2.1.     Driving Factor 1 Analysis  37

4.2.2.     Driving Factor 2 Analysis  38

4.3.         Market Restraints  39

4.3.1.     Restraining Factor Analysis  39

4.4.         Market Opportunities  40

4.4.1.     Market Opportunity Analysis  40

4.5.         Porter’s Five Forces Analysis  41

4.6.         Value Chain Analysis  42

4.7.         Buying Criteria  43


Chapter No. 5 :  Import Export Analysis  44

5.1.         Import Analysis by Region   44

5.1.1.     Global Metaraminol Bitartrate Market Import Volume/Revenue, By Region, 2017 – 2022  44

5.2.         Export Analysis by Region   45

5.2.1.     Global Metaraminol Bitartrate Market Export Volume/Revenue, By Region, 2017 – 2022  45


Chapter No. 6 :  Demand Supply Analysis  46

6.1.         Demand Analysis by Region   46

6.1.1.     Global Metaraminol Bitartrate Market Demand Volume/Revenue, By Region, 2017 – 2022  46

6.2.         Supply Analysis by Region   47

6.2.1.     Global Metaraminol Bitartrate Market Supply Volume/Revenue, By Region, 2017 – 2022  47


Chapter No. 7 :  Production Analysis  48

7.1.         Production Analysis by Region   48

7.1.1.     Global Metaraminol Bitartrate Market Production, By Region, 2017 – 2022  48

7.1.2.     Global Metaraminol Bitartrate Market Production Volume, By Region, 2017 – 2022 (Kilo Tons)  48


Chapter No. 8 :  Price Analysis  49

8.1.         Price Analysis by Region   49

8.1.1.     Global Metaraminol Bitartrate Market Price, By Region, 2017 – 2022  49

8.1.2.     Global Type Market Price, By Region, 2017 – 2022  49

8.2.         Price Analysis by Type   50

8.2.1.     Global Metaraminol Bitartrate Market Price, By Type, 2017 – 2022  50

8.2.2.     Global Type Market Price, By Type, 2017 – 2022  50


Chapter No. 9 :  Raw Materials Analysis  51

9.1.         Key Raw Materials and Suppliers  51

9.2.         Key Raw Materials Price Trend   51


Chapter No. 10 :     Manufacturing Cost Analysis  52

10.1.      Manufacturing Cost Analysis  52

10.1.1.   Manufacturing Cost Analysis  52

10.2.      Manufacturing Process  52

10.2.1.   Manufacturing Process  52


Chapter No. 11 :  Analysis Competitive Landscape   53

11.1.      Company Market Share Analysis – 2022  53

11.1.1.   Global Metaraminol Bitartrate Market: Company Market Share, by Volume, 2022  53

11.1.2.   Global Metaraminol Bitartrate Market: Company Market Share, by Revenue2022  54

11.1.3.   Global Metaraminol Bitartrate Market: Top 6 Company Market Share, by Revenue2022  54

11.1.4.   Global Metaraminol Bitartrate Market: Top 3 Company Market Share, by Revenue2022  55

11.1.      Global Metaraminol Bitartrate Market Company Volume Market Share, 2022  56

11.2.      Global Metaraminol Bitartrate Market Company Revenue Market Share, 2022  57

11.3.      Company Assessment Metrics, 2022  58

11.3.1.   Stars  58

11.3.2.   Emerging Leaders  58

11.3.3.   Pervasive Players  58

11.3.4.   Participants  58

11.4.      Strategic Developments  59

11.4.1.   Acquisitions & Mergers  59

11.4.2.   New Product Launch   59

11.4.3.   Regional Expansion   59

11.5.      Key Players Product Matrix  60


Chapter No. 12 :    PESTEL & Adjacent Market Analysis  61

12.1.      PESTEL  61

12.1.1.   Political Factors  61

12.1.2.   Economic Factors  61

12.1.3.   Social Factors  61

12.1.4.   Technological Factors  61

12.1.5.   Environmental Factors  61

12.1.6.   Legal Factors  61

12.2.      Adjacent Market Analysis  61


Chapter No. 13 :   Metaraminol Bitartrate Market – By Type Segment Analysis  62

13.1.      Metaraminol Bitartrate Market Overview, by Type Segment  62

13.1.1.   Metaraminol Bitartrate Market Volume Share, By Type, 2022 & 2030  63

13.1.2.   Metaraminol Bitartrate Market Revenue Share, By Type, 2022 & 2030  63

13.1.3.   Metaraminol Bitartrate Market Attractiveness Analysis, By Type   64

13.1.4.   Incremental Revenue Growth Opportunity, by Type, 2023 – 2030  64

13.1.5.   Metaraminol Bitartrate Market Revenue, By Type, 2017, 2022, 2026 & 2030  65

13.2.      API 66

13.2.1.   Global API Metaraminol Bitartrate Market Volume & Revenue, By Region, 2017 – 2022 (Kilo Tons) (USD Million)  67

13.2.2.   Global API Metaraminol Bitartrate Market Volume & Revenue, By Region, 2017 – 2022 (Kilo Tons) (USD Million)  67

13.3.      Solution   68

13.3.1.   Global Solution Metaraminol Bitartrate Market Volume & Revenue, By Region, 2017 – 2022 (Kilo Tons) (USD Million)  69

13.3.2.   Global Solution Metaraminol Bitartrate Market Volume & Revenue, By Region, 2017 – 2022 (Kilo Tons) (USD Million)  69


Chapter No. 14 :   Metaraminol Bitartrate Market – By Application Segment Analysis  70

14.1.      Metaraminol Bitartrate Market Overview, by Application Segment  70

14.1.1.   Metaraminol Bitartrate Market Volume Share, By Application, 2022 & 2030  71

14.1.2.   Metaraminol Bitartrate Market Revenue Share, By Application, 2022 & 2030  71

14.1.3.   Metaraminol Bitartrate Market Attractiveness Analysis, By Application   72

14.1.4.   Incremental Revenue Growth Opportunity, by Application, 2023 – 2030  72

14.1.5.   Metaraminol Bitartrate Market Revenue, By Application, 2017, 2022, 2026 & 2030  73

14.2.      Hypotension Treatment  74

14.2.1.   Global Hypotension Treatment Metaraminol Bitartrate Market Volume & Revenue, By Region, 2017 – 2022 (Kilo Tons) (USD Million)  75

14.2.2.   Global Hypotension Treatment Metaraminol Bitartrate Market Volume & Revenue, By Region, 2017 – 2022 (Kilo Tons) (USD Million)  75

14.3.      Anesthesia  76

14.3.1.   Global Anesthesia Metaraminol Bitartrate Market Volume & Revenue, By Region, 2017 – 2022 (Kilo Tons) (USD Million)  77

14.3.2.   Global Anesthesia Metaraminol Bitartrate Market Volume & Revenue, By Region, 2017 – 2022 (Kilo Tons) (USD Million)  77


Chapter No. 15 :    Metaraminol Bitartrate Market – By End-user Segment Analysis  78

15.1.      Metaraminol Bitartrate Market Overview, by End-user Segment  78

15.1.1.   Metaraminol Bitartrate Market Volume Share, By End-user, 2022 & 2030  79

15.1.2.   Metaraminol Bitartrate Market Revenue Share, By End-user, 2022 & 2030  79

15.1.3.   Metaraminol Bitartrate Market Attractiveness Analysis, By End-user  80

15.1.4.   Incremental Revenue Growth Opportunity, by End-user, 2023 – 2030  80

15.1.5.   Metaraminol Bitartrate Market Revenue, By End-user, 2017, 2022, 2026 & 2030  81

15.2.      Hospital 82

15.2.1.   Global Hospital  Metaraminol Bitartrate Market Volume & Revenue, By Region, 2017 – 2022 (Kilo Tons) (USD Million)  83

15.2.2.   Global Hospital  Metaraminol Bitartrate Market Volume & Revenue, By Region, 2023 – 2030 (Kilo Tons) (USD Million)  83

15.3.      Clinics  84

15.3.1.   Global Clinics Metaraminol Bitartrate Market Volume & Revenue, By Region, 2017 – 2022 (Kilo Tons) (USD Million)  85

15.3.2.   Global Clinics Metaraminol Bitartrate Market Volume & Revenue, By Region, 2023 – 2030 (Kilo Tons) (USD Million)  85

15.4.      Pharmacy  86

15.4.1.   Global Pharmacy Metaraminol Bitartrate Market Volume & Revenue, By Region, 2017 – 2022 (Kilo Tons) (USD Million)  87

15.4.2.   Global Pharmacy Metaraminol Bitartrate Market Volume & Revenue, By Region, 2023 – 2030 (Kilo Tons) (USD Million)  87

15.5.      Medical research institutions  88

15.5.1.   Global Medical research institutions Metaraminol Bitartrate Market Volume & Revenue, By Region, 2017 – 2022 (Kilo Tons) (USD Million)  89

15.5.2.   Global Medical research institutions Metaraminol Bitartrate Market Volume & Revenue, By Region, 2023 – 2030 (Kilo Tons) (USD Million)  89

15.6.      Others  90

15.6.1.   Global Others Metaraminol Bitartrate Market Volume & Revenue, By Region, 2017 – 2022 (Kilo Tons) (USD Million)  91

15.6.2.   Global Others Metaraminol Bitartrate Market Volume & Revenue, By Region, 2023 – 2030 (Kilo Tons) (USD Million)  91


Chapter No. 16 :     Metaraminol Bitartrate Market – Regional Analysis  92

16.1.      Metaraminol Bitartrate Market Overview, by Regional Segments  92

16.2.      Region   93

16.2.1.   Global Metaraminol Bitartrate Market Volume Share, By Region, 2022 & 2030  93

16.2.2.   Global Metaraminol Bitartrate Market Revenue Share, By Region, 2022 & 2030  93

16.2.3.   Metaraminol Bitartrate Market Attractiveness Analysis, By Region   94

16.2.4.   Incremental Revenue Growth Opportunity, by Region, 2023 – 2030  94

16.2.5.   Metaraminol Bitartrate Market Revenue, By Region, 2017, 2022, 2026 & 2030  95

16.2.6.   Global Metaraminol Bitartrate Market Volume & Revenue, By Region, 2017 – 2022 (Kilo Tons) (USD Million)  96

16.2.7.   Global Metaraminol Bitartrate Market Volume & Revenue, By Region, 2023 – 2030 (Kilo Tons) (USD Million)  96

16.3.      Type   97

16.3.1.   Global Metaraminol Bitartrate Market Volume & Revenue, By Type, 2017 – 2022 (Kilo Tons) (USD Million)  97

16.3.2.   Global Metaraminol Bitartrate Market Volume & Revenue, By Type, 2023 – 2030 (Kilo Tons) (USD Million)  97

16.4.      Application   98

16.4.1.   Global Metaraminol Bitartrate Market Volume & Revenue, By Application, 2017 – 2022 (Kilo Tons) (USD Million)  98

16.4.2.   Global Metaraminol Bitartrate Market Volume & Revenue, By Application, 2023 – 2030 (Kilo Tons) (USD Million)  98

16.5.      End-user  99

16.5.1.   Global Metaraminol Bitartrate Market Volume & Revenue, By End-user, 2017 – 2022 (Kilo Tons) (USD Million)  99

16.5.2.   Global Metaraminol Bitartrate Market Volume & Revenue, By End-user, 2023 – 2030 (Kilo Tons) (USD Million)  99


Chapter No. 17 :     Metaraminol Bitartrate Market – North America  100

17.1.      North America  100

17.1.      Key Highlights  100

17.1.1.   North America Metaraminol Bitartrate Market Volume, By Country, 2017 – 2022 (Kilo Tons)  101

17.1.2.   North America Metaraminol Bitartrate Market Revenue, By Country, 2017 – 2022 (USD Million)  102

17.1.2.1.   North America Metaraminol Bitartrate Market Volume, By Type, 2017 – 2022 (Kilo Tons)  103

17.1.3.   North America Metaraminol Bitartrate Market Revenue, By Type, 2017 – 2022 (USD Million)  104

17.1.4.   North America Metaraminol Bitartrate Market Volume, By Application, 2017 – 2022 (Kilo Tons)  105

17.1.5.   North America Metaraminol Bitartrate Market Revenue, By Application, 2017 – 2022 (USD Million)  106

17.1.6.   North America Metaraminol Bitartrate Market Volume, By End-user, 2017 – 2022 (Kilo Tons)  107

17.1.7.   North America Metaraminol Bitartrate Market Revenue, By End-user, 2017 – 2022 (USD Million)  108

17.1.8.   U.S. 109

17.1.9.   Canada  109

17.1.10. Mexico   109


Chapter No. 18 :    Metaraminol Bitartrate Market – Europe   110

18.1.      Europe   110

18.2.      Key Highlights  110

18.2.1.   Europe Metaraminol Bitartrate Market Volume, By Country, 2017 – 2022 (Kilo Tons)  111

18.2.2.   Europe Metaraminol Bitartrate Market Revenue, By Country, 2017 – 2022 (USD Million)  112

18.2.3.   Europe Metaraminol Bitartrate Market Volume, By Type, 2017 – 2022 (Kilo Tons)  113

18.2.4.   Europe Metaraminol Bitartrate Market Revenue, By Type, 2017 – 2022 (USD Million)  114

18.2.5.   Europe Metaraminol Bitartrate Market Volume, By Application, 2017 – 2022 (Kilo Tons)  115

18.2.6.   Europe Metaraminol Bitartrate Market Revenue, By Application, 2017 – 2022 (USD Million)  116

18.2.7.   Europe Metaraminol Bitartrate Market Volume, By End-user, 2017 – 2022 (Kilo Tons)  117

18.2.8.   Europe Metaraminol Bitartrate Market Revenue, By End-user, 2017 – 2022 (USD Million)  118

18.2.9.   UK   119

18.2.10. France   119

18.2.11. Germany  119

18.2.12. Italy  119

18.2.13. Spain   119

18.2.14. Russia  119

18.2.15. BENELUX   119

18.2.16. Sweden   119

18.2.17. Denmark  119

18.2.18. Poland   119

18.2.19. Austria  119

18.2.20. Rest of Europe   119


Chapter No. 19 :  Metaraminol Bitartrate Market – Asia Pacific  120

19.1.      Asia Pacific  120

19.2.      Key Highlights  120

19.2.1.   Asia Pacific Metaraminol Bitartrate Market Volume, By Country, 2017 – 2022 (Kilo Tons)  121

19.2.2.   Asia Pacific Metaraminol Bitartrate Market Revenue, By Country, 2017 – 2022 (USD Million)  122

19.2.3.   Asia Pacific Metaraminol Bitartrate Market Volume, By Type, 2017 – 2022 (Kilo Tons)  123

19.2.4.   Asia Pacific Metaraminol Bitartrate Market Revenue, By Type, 2017 – 2022 (USD Million)  124

19.2.5.   Asia Pacific Metaraminol Bitartrate Market Volume, By Application, 2017 – 2022 (Kilo Tons)  125

19.2.6.   Asia Pacific Metaraminol Bitartrate Market Revenue, By Application, 2017 – 2022 (USD Million)  126

19.2.7.   Asia Pacific Metaraminol Bitartrate Market Volume, By End-user, 2017 – 2022 (Kilo Tons)  127

19.2.8.   Asia Pacific Metaraminol Bitartrate Market Revenue, By End-user, 2017 – 2022 (USD Million)  128

19.2.9.   China  129

19.2.10. Japan   129

19.2.11. South Korea  129

19.2.12. India  129

19.2.13. Thailand   129

19.2.14. Indonesia  129

19.2.15. Vietnam    129

19.2.16. Malaysia  129

19.2.17. Philippines  129

19.2.18. Taiwan   129

19.2.19. Rest of Asia Pacific  129


Chapter No. 20 :  Metaraminol Bitartrate Market – Latin America  130

20.1.      Latin America  130

20.2.      Key Highlights  130

20.2.1.   Latin America Metaraminol Bitartrate Market Volume, By Country, 2017 – 2022 (Kilo Tons)  131

20.2.2.   Latin America Metaraminol Bitartrate Market Revenue, By Country, 2017 – 2022 (USD Million)  132

20.2.3.   Latin America Metaraminol Bitartrate Market Volume, By Type, 2017 – 2022 (Kilo Tons)  133

20.2.4.   Latin America Metaraminol Bitartrate Market Revenue, By Type, 2017 – 2022 (USD Million)  134

20.2.5.   Latin America Metaraminol Bitartrate Market Volume, By Application, 2017 – 2022 (Kilo Tons)  135

20.2.6.   Latin America Metaraminol Bitartrate Market Revenue, By Application, 2017 – 2022 (USD Million)  136

20.2.7.   Latin America Metaraminol Bitartrate Market Volume, By End-user, 2017 – 2022 (Kilo Tons)  137

20.2.8.   Latin America Metaraminol Bitartrate Market Revenue, By End-user, 2017 – 2022 (USD Million)  138

20.2.9.   Brazil 139

20.2.10. Argentina  139

20.2.11. Colombia  139

20.2.12. Chile   139

20.2.13. Peru   139

20.2.14. Rest of Latin America  139


Chapter No. 21 :   Metaraminol Bitartrate Market – Middle East  140

21.1.      The Middle-East  140

21.2.      Key Highlights  140

21.2.1.   Middle East Metaraminol Bitartrate Market Volume, By Country, 2017 – 2022 (Kilo Tons)  141

21.2.2.   Middle East Metaraminol Bitartrate Market Revenue, By Country, 2017 – 2022 (USD Million)  142

21.2.3.   Middle East Metaraminol Bitartrate Market Volume, By Type, 2017 – 2022 (Kilo Tons)  143

21.2.4.   Middle East Metaraminol Bitartrate Market Revenue, By Type, 2017 – 2022 (USD Million)  144

21.2.5.   Middle East Metaraminol Bitartrate Market Volume, By Application, 2017 – 2022 (Kilo Tons)  145

21.2.6.   Middle East Metaraminol Bitartrate Market Revenue, By Application, 2017 – 2022 (USD Million)  146

21.2.7.   Middle East Metaraminol Bitartrate Market Volume, By End-user, 2017 – 2022 (Kilo Tons)  147

21.2.8.   Middle East Metaraminol Bitartrate Market Revenue, By End-user, 2017 – 2022 (USD Million)  148

21.2.9.   GCC Countries  149

21.2.10. Israel 149

21.2.11. Turkey  149

21.2.12. Iran   149

21.2.13. Rest of Middle East & Africa  149


Chapter No. 22 :    Metaraminol Bitartrate Market – Africa  150

22.1.      Africa  150

22.2.      Key Highlights  150

22.2.1.   Africa Metaraminol Bitartrate Market Volume, By Country, 2017 – 2022 (Kilo Tons)  151

22.2.2.   Africa Metaraminol Bitartrate Market Revenue, By Country, 2017 – 2022 (USD Million)  152

22.2.3.   Africa Metaraminol Bitartrate Market Volume, By Type, 2017 – 2022 (Kilo Tons)  153

22.2.4.   Africa Metaraminol Bitartrate Market Revenue, By Type, 2017 – 2022 (USD Million)  154

22.2.5.   Africa Metaraminol Bitartrate Market Volume, By Application, 2017 – 2022 (Kilo Tons)  155

22.2.6.   Africa Metaraminol Bitartrate Market Revenue, By Application, 2017 – 2022 (USD Million)  156

22.2.7.   Africa Metaraminol Bitartrate Market Volume, By End-user, 2017 – 2022 (Kilo Tons)  157

22.2.8.   Africa Metaraminol Bitartrate Market Revenue, By End-user, 2017 – 2022 (USD Million)  158

22.2.9.   South Africa  159

22.2.10. Egypt  159

22.2.11. Nigeria  159

22.2.12. Algeria  159

22.2.13. Morocco   159

22.2.14. Rest of Africa  159


Chapter No. 23 :  Company Profiles  160

23.1.      Spectrum Chemical 160

23.1.1.   Company Overview    160

23.1.2.   Product Portfolio   160

23.1.3.   Swot Analysis  160

23.1.4.   Business Strategy  161

23.1.5.   Financial Overview    161

23.2.      Sinoway  162

23.3.      Merck  162

23.4.      GD Searle LLC   162

23.5.      Fresenius Kabi 162

23.6.      Toronto Research Chemicals  162

23.7.      BIOSYNTH AG   162

23.8.      Laboratori Alchemia  162

23.9.      ABX   GmbH   162

23.10.    Chengdu Shuxi Pharmaceutical Co., Ltd   162

23.11.    Wuhan Fortuna Chemical Co., Ltd. 162

23.12.    Sphinx Scientific Laboratory (Tianjin) Co., Ltd   162

Chapter No. 24 :               Research Methodology  163

24.1.      Research Methodology  163

24.2.      Phase I – Secondary Research   164

24.3.      Phase II – Data Modeling  164

24.3.1.   Company Share Analysis Model 165

24.3.2.   Revenue Based Modeling  165

24.4.      Phase III – Primary Research   166

24.5.      Research Limitations  167

24.5.1.   Assumptions  167


List of Figures

FIG NO. 1.           Global Metaraminol Bitartrate Market Volume & Revenue, 2017 – 2022 (Kilo Tons) (USD Million)  32

FIG NO. 2.           Porter’s Five Forces Analysis for Global Metaraminol Bitartrate Market  41

FIG NO. 3.           Value Chain Analysis for Global Metaraminol Bitartrate Market  42

FIG NO. 4.           Global Metaraminol Bitartrate Market Import Volume/Revenue, By Region, 2017 – 2022  44

FIG NO. 5.           Global Metaraminol Bitartrate Market Export Volume/Revenue, By Region, 2017 – 2022  45

FIG NO. 6.           Global Metaraminol Bitartrate Market Demand Volume/Revenue, By Region, 2017 – 2022  46

FIG NO. 7.           Global Metaraminol Bitartrate Market Supply Volume/Revenue, By Region, 2017 – 2022  47

FIG NO. 8.           Global Metaraminol Bitartrate Market Production, By Region, 2017 – 2022  48

FIG NO. 9.           Global Metaraminol Bitartrate Market Price, By Region, 2017 – 2022  49

FIG NO. 10.         Global Metaraminol Bitartrate Market Price, By Type, 2017 – 2022  50

FIG NO. 11.         Raw Materials Price Trend Analysis, 2017 – 2022  51

FIG NO. 12.         Manufacturing Cost Analysis  52

FIG NO. 13.         Manufacturing Process  52

FIG NO. 14.         Company Share Analysis, 2022  53

FIG NO. 15.         Company Share Analysis, 2022  54

FIG NO. 16.         Company Share Analysis, 2022  54

FIG NO. 17.         Company Share Analysis, 2022  55

FIG NO. 18.         Metaraminol Bitartrate Market – Company Volume  Market Share, 2022  56

FIG NO. 19.         Metaraminol Bitartrate Market – Company Revenue Market Share, 2022  57

FIG NO. 20.         Metaraminol Bitartrate Market Volume Share, By Type, 2022 & 2030  63

FIG NO. 21.         Metaraminol Bitartrate Market Revenue Share, By Type, 2022 & 2030  63

FIG NO. 22.         Market Attractiveness Analysis, By Type   64

FIG NO. 23.         Incremental Revenue Growth Opportunity by Type   64

FIG NO. 24.         Metaraminol Bitartrate Market Revenue, By Type, 2017, 2022, 2026 & 2030  65

FIG NO. 25.         Global Metaraminol Bitartrate Market for API, Volume & Revenue (Kilo Tons) (USD Million) 2017 – 2030  66

FIG NO. 26.         Global Metaraminol Bitartrate Market for Solution, Volume & Revenue (Kilo Tons) (USD Million) 2017 – 2030  68

FIG NO. 27.         Metaraminol Bitartrate Market Volume Share, By Application, 2022 & 2030  71

FIG NO. 28.         Metaraminol Bitartrate Market Revenue Share, By Application, 2022 & 2030  71

FIG NO. 29.         Market Attractiveness Analysis, By Application   72

FIG NO. 30.         Incremental Revenue Growth Opportunity by Application   72

FIG NO. 31.         Metaraminol Bitartrate Market Revenue, By Application, 2017, 2022, 2026 & 2030  73

FIG NO. 32.         Global Metaraminol Bitartrate Market for Hypotension Treatment, Volume & Revenue (Kilo Tons) (USD Million) 2017 – 2030  74

FIG NO. 33.         Global Metaraminol Bitartrate Market for Anesthesia, Volume & Revenue (Kilo Tons) (USD Million) 2017 – 2030  76

FIG NO. 34.         Metaraminol Bitartrate Market Volume Share, By End-user, 2022 & 2030  79

FIG NO. 35.         Metaraminol Bitartrate Market Revenue Share, By End-user, 2022 & 2030  79

FIG NO. 36.         Market Attractiveness Analysis, By End-user  80

FIG NO. 37.         Incremental Revenue Growth Opportunity by End-user  80

FIG NO. 38.         Metaraminol Bitartrate Market Revenue, By End-user, 2017, 2022, 2026 & 2030  81

FIG NO. 39.         Global Metaraminol Bitartrate Market for Hospital , Volume & Revenue (Kilo Tons) (USD Million) 2017 – 2030  82

FIG NO. 40.         Global Metaraminol Bitartrate Market for Clinics, Volume & Revenue (Kilo Tons) (USD Million) 2017 – 2030  84

FIG NO. 41.         Global Metaraminol Bitartrate Market for Pharmacy, Volume & Revenue (Kilo Tons) (USD Million) 2017 – 2030  86

FIG NO. 42.         Global Metaraminol Bitartrate Market for Medical research institutions, Volume & Revenue (Kilo Tons) (USD Million) 2017 – 2030  88

FIG NO. 43.         Global Metaraminol Bitartrate Market for Others, Volume & Revenue (Kilo Tons) (USD Million) 2017 – 2030  90

FIG NO. 44. Global Metaraminol Bitartrate Market Volume Share, By Region, 2022 & 2030  93

FIG NO. 45.         Global Metaraminol Bitartrate Market Revenue Share, By Region, 2022 & 2030  93

FIG NO. 46.         Market Attractiveness Analysis, By Region   94

FIG NO. 47.         Incremental Revenue Growth Opportunity by Region   94

FIG NO. 48.         Metaraminol Bitartrate Market Revenue, By Region, 2017, 2022, 2026 & 2030  95

FIG NO. 49.         North America Metaraminol Bitartrate Market Volume & Revenue, 2017 – 2022 (Kilo Tons) (USD Million)  100

FIG NO. 50.         Europe Metaraminol Bitartrate Market Volume & Revenue, 2017 – 2022 (Kilo Tons) (USD Million)  110

FIG NO. 51.         Asia Pacific Metaraminol Bitartrate Market Volume & Revenue, 2017 – 2022 (Kilo Tons) (USD Million)  120

FIG NO. 52.         Latin America Metaraminol Bitartrate Market Volume & Revenue, 2017 – 2022 (Kilo Tons) (USD Million)  130

FIG NO. 53.         The Middle-East Metaraminol Bitartrate Market Volume & Revenue, 2017 – 2022 (Kilo Tons) (USD Million)  140

FIG NO. 54.         Africa Metaraminol Bitartrate Market Volume & Revenue, 2017 – 2022 (Kilo Tons) (USD Million)  150

FIG NO. 55.         Research Methodology – Detailed View    163

FIG NO. 56.         Research Methodology  164


List of Tables

TABLE NO. 1. :    Global Metaraminol Bitartrate Market: Snapshot  30

TABLE NO. 2. :    Drivers for the Metaraminol Bitartrate Market: Impact Analysis  36

TABLE NO. 3. :    Restraints for the Metaraminol Bitartrate Market: Impact Analysis  38

TABLE NO. 4. :    Global Metaraminol Bitartrate Market Volume & Revenue, By Region, 2017 – 2022 (Kilo Tons)  47

TABLE NO. 5. :    Global Metaraminol Bitartrate Market Volume & Revenue, By Region, 2017 – 2022  48

TABLE NO. 6. :    Global Metaraminol Bitartrate Market Volume & Revenue, By Type, 2017 – 2022  49

TABLE NO. 7. :    Key Raw Materials & Suppliers  50

TABLE NO. 8. :    Global API Metaraminol Bitartrate Market Volume & Revenue, By Region, 2017 – 2022 (Kilo Tons) (USD Million)  66

TABLE NO. 9. :    Global API Metaraminol Bitartrate Market Volume & Revenue, By Region, 2023– 2030 (Kilo Tons) (USD Million)  66

TABLE NO. 10. : Global Solution Metaraminol Bitartrate Market Volume & Revenue, By Region, 2017 – 2022 (Kilo Tons) (USD Million)  68

TABLE NO. 11. : Global Solution Metaraminol Bitartrate Market Volume & Revenue, By Region, 2023– 2030 (Kilo Tons) (USD Million)  68

TABLE NO. 12. : Global Hypotension Treatment Metaraminol Bitartrate Market Volume & Revenue, By Region, 2017 – 2022 (Kilo Tons) (USD Million)  74

TABLE NO. 13. : Global Hypotension Treatment Metaraminol Bitartrate Market Volume & Revenue, By Region, 2023– 2030 (Kilo Tons) (USD Million)  74

TABLE NO. 14. : Global Anesthesia Metaraminol Bitartrate Market Volume & Revenue, By Region, 2017 – 2022 (Kilo Tons) (USD Million)  76

TABLE NO. 15. : Global Anesthesia Metaraminol Bitartrate Market Volume & Revenue, By Region, 2023– 2030 (Kilo Tons) (USD Million)  76

TABLE NO. 16. : Global Hospital  Metaraminol Bitartrate Market Volume & Revenue, By Region, 2017 – 2022 (Kilo Tons) (USD Million)  82

TABLE NO. 17. : Global Hospital  Metaraminol Bitartrate Market Volume & Revenue, By Region, 2023– 2030 (Kilo Tons) (USD Million)  82

TABLE NO. 18. : Global Clinics Metaraminol Bitartrate Market Volume & Revenue, By Region, 2017 – 2022 (Kilo Tons) (USD Million)  84

TABLE NO. 19. : Global Clinics Metaraminol Bitartrate Market Volume & Revenue, By Region, 2023– 2030 (Kilo Tons) (USD Million)  84

TABLE NO. 20. : Global Pharmacy Metaraminol Bitartrate Market Volume & Revenue, By Region, 2017 – 2022 (Kilo Tons) (USD Million)  86

TABLE NO. 21. : Global Pharmacy Metaraminol Bitartrate Market Volume & Revenue, By Region, 2023– 2030 (Kilo Tons) (USD Million)  86

TABLE NO. 22. : Global Medical research institutions Metaraminol Bitartrate Market Volume & Revenue, By Region, 2017 – 2022 (Kilo Tons) (USD Million)  88

TABLE NO. 23. : Global Medical research institutions Metaraminol Bitartrate Market Volume & Revenue, By Region, 2023– 2030 (Kilo Tons) (USD Million)  88

TABLE NO. 24. : Global Others Metaraminol Bitartrate Market Volume & Revenue, By Region, 2017 – 2022 (Kilo Tons) (USD Million)  90

TABLE NO. 25. : Global Others Metaraminol Bitartrate Market Volume & Revenue, By Region, 2023– 2030 (Kilo Tons) (USD Million)  90

TABLE NO. 26. : Global Metaraminol Bitartrate Market Volume & Revenue, By Region, 2017 – 2022 (Kilo Tons) (USD Million)  95

TABLE NO. 27. : Global Metaraminol Bitartrate Market Volume & Revenue, By Region, 2023– 2030 (Kilo Tons) (USD Million)  95

TABLE NO. 28. : Global Metaraminol Bitartrate Market Volume & Revenue, By Type, 2017 – 2022 (Kilo Tons) (USD Million)  96

TABLE NO. 29. : Global Metaraminol Bitartrate Market Volume & Revenue, By Type, 2023– 2030 (Kilo Tons) (USD Million)  96

TABLE NO. 30. : Global Metaraminol Bitartrate Market Volume & Revenue, By Application, 2017 – 2022 (Kilo Tons) (USD Million)  97

TABLE NO. 31. : Global Metaraminol Bitartrate Market Volume & Revenue, By Application, 2023– 2030 (Kilo Tons) (USD Million)  97

TABLE NO. 32. : Global Metaraminol Bitartrate Market Volume & Revenue, By End-user, 2017 – 2022 (Kilo Tons) (USD Million)  98

TABLE NO. 33. : Global Metaraminol Bitartrate Market Volume & Revenue, By End-user, 2023– 2030 (Kilo Tons) (USD Million)  98

TABLE NO. 34. : North America Metaraminol Bitartrate Market Volume, By Country, 2017 – 2022 (Kilo Tons)  100

TABLE NO. 35. : North America Metaraminol Bitartrate Market Volume, By Country, 2023– 2030 (Kilo Tons)  100

TABLE NO. 36. : North America Metaraminol Bitartrate Market Revenue, By Country, 2017 – 2022 (USD Million)  101

TABLE NO. 37. : North America Metaraminol Bitartrate Market Revenue, By Country, 2023– 2030 (USD Million)  101

TABLE NO. 38. : North America Metaraminol Bitartrate Market Volume, By Type, 2017 – 2022 (Kilo Tons)  102

TABLE NO. 39. : North America Metaraminol Bitartrate Market Volume, By Type, 2023– 2030 (Kilo Tons)  102

TABLE NO. 40. : North America Metaraminol Bitartrate Market Revenue, By Type, 2017 – 2022 (USD Million)  103

TABLE NO. 41. : North America Metaraminol Bitartrate Market Revenue, By Type, 2023– 2030 (USD Million)  103

TABLE NO. 42. : North America Metaraminol Bitartrate Market Volume, By Application, 2017 – 2022 (Kilo Tons)  104

TABLE NO. 43. : North America Metaraminol Bitartrate Market Volume, By Application, 2023– 2030 (Kilo Tons)  104

TABLE NO. 44. : North America Metaraminol Bitartrate Market Revenue, By Application, 2017 – 2022 (USD Million)  105

TABLE NO. 45. : North America Metaraminol Bitartrate Market Revenue, By Application, 2023– 2030 (USD Million)  105

TABLE NO. 46. : North America Metaraminol Bitartrate Market Volume, By End-user, 2017 – 2022 (Kilo Tons)  106

TABLE NO. 47. : North America Metaraminol Bitartrate Market Volume, By End-user, 2023– 2030 (Kilo Tons)  106

TABLE NO. 48. : North America Metaraminol Bitartrate Market Revenue, By End-user, 2017 – 2022 (USD Million)  107

TABLE NO. 49. : North America Metaraminol Bitartrate Market Revenue, By End-user, 2023– 2030 (USD Million)  107

TABLE NO. 50. : Europe Metaraminol Bitartrate Market Volume, By Country, 2017 – 2022 (Kilo Tons)  110

TABLE NO. 51. : Europe Metaraminol Bitartrate Market Volume, By Country, 2023– 2030 (Kilo Tons)  110

TABLE NO. 52. : Europe Metaraminol Bitartrate Market Revenue, By Country, 2017 – 2022 (USD Million)  111

TABLE NO. 53. : Europe Metaraminol Bitartrate Market Revenue, By Country, 2023– 2030 (USD Million)  111

TABLE NO. 54. : Europe Metaraminol Bitartrate Market Volume, By Type, 2017 – 2022 (Kilo Tons)  112

TABLE NO. 55. : Europe Metaraminol Bitartrate Market Volume, By Type, 2023– 2030 (Kilo Tons)  112

TABLE NO. 56. : Europe Metaraminol Bitartrate Market Revenue, By Type, 2017 – 2022 (USD Million)  113

TABLE NO. 57. : Europe Metaraminol Bitartrate Market Revenue, By Type, 2023– 2030 (USD Million)  113

TABLE NO. 58. : Europe Metaraminol Bitartrate Market Volume, By Application, 2017 – 2022 (Kilo Tons)  114

TABLE NO. 59. : Europe Metaraminol Bitartrate Market Volume, By Application, 2023– 2030 (Kilo Tons)  114

TABLE NO. 60. : Europe Metaraminol Bitartrate Market Revenue, By Application, 2017 – 2022 (USD Million)  115

TABLE NO. 61. : Europe Metaraminol Bitartrate Market Revenue, By Application, 2023– 2030 (USD Million)  115

TABLE NO. 62. : Europe Metaraminol Bitartrate Market Volume, By End-user, 2017 – 2022 (Kilo Tons)  116

TABLE NO. 63. : Europe Metaraminol Bitartrate Market Volume, By End-user, 2023– 2030 (Kilo Tons)  116

TABLE NO. 64. : Europe Metaraminol Bitartrate Market Revenue, By End-user, 2017 – 2022 (USD Million)  117

TABLE NO. 65. : Europe Metaraminol Bitartrate Market Revenue, By End-user, 2023– 2030 (USD Million)  117

TABLE NO. 66. : Asia Pacific Metaraminol Bitartrate Market Volume, By Country, 2017 – 2022 (Kilo Tons)  120

TABLE NO. 67. : Asia Pacific Metaraminol Bitartrate Market Volume, By Country, 2023– 2030 (Kilo Tons)  120

TABLE NO. 68. : Asia Pacific Metaraminol Bitartrate Market Revenue, By Country, 2017 – 2022 (USD Million)  121

TABLE NO. 69. : Asia Pacific Metaraminol Bitartrate Market Revenue, By Country, 2023– 2030 (USD Million)  121

TABLE NO. 70. : Asia Pacific Metaraminol Bitartrate Market Volume, By Type, 2017 – 2022 (Kilo Tons)  122

TABLE NO. 71. : Asia Pacific Metaraminol Bitartrate Market Volume, By Type, 2023– 2030 (Kilo Tons)  122

TABLE NO. 72. : Asia Pacific Metaraminol Bitartrate Market Revenue, By Type, 2017 – 2022 (USD Million)  123

TABLE NO. 73. : Asia Pacific Metaraminol Bitartrate Market Revenue, By Type, 2023– 2030 (USD Million)  123

TABLE NO. 74. : Asia Pacific Metaraminol Bitartrate Market Volume, By Application, 2017 – 2022 (Kilo Tons)  124

TABLE NO. 75. : Asia Pacific Metaraminol Bitartrate Market Volume, By Application, 2023– 2030 (Kilo Tons)  124

TABLE NO. 76. : Asia Pacific Metaraminol Bitartrate Market Revenue, By Application, 2017 – 2022 (USD Million)  125

TABLE NO. 77. : Asia Pacific Metaraminol Bitartrate Market Revenue, By Application, 2023– 2030 (USD Million)  125

TABLE NO. 78. : Asia Pacific Metaraminol Bitartrate Market Volume, By End-user, 2017 – 2022 (Kilo Tons)  126

TABLE NO. 79. : Asia Pacific Metaraminol Bitartrate Market Volume, By End-user, 2023– 2030 (Kilo Tons)  126

TABLE NO. 80. : Asia Pacific Metaraminol Bitartrate Market Revenue, By End-user, 2017 – 2022 (USD Million)  127

TABLE NO. 81. : Asia Pacific Metaraminol Bitartrate Market Revenue, By End-user, 2023– 2030 (USD Million)  127

TABLE NO. 82. : Latin America Metaraminol Bitartrate Market Volume, By Country, 2017 – 2022 (Kilo Tons)  130

TABLE NO. 83. : Latin America Metaraminol Bitartrate Market Volume, By Country, 2023– 2030 (Kilo Tons)  130

TABLE NO. 84. : Latin America Metaraminol Bitartrate Market Revenue, By Country, 2017 – 2022 (USD Million)  131

TABLE NO. 85. : Latin America Metaraminol Bitartrate Market Revenue, By Country, 2023– 2030 (USD Million)  131

TABLE NO. 86. : Latin America Metaraminol Bitartrate Market Volume, By Type, 2017 – 2022 (Kilo Tons)  132

TABLE NO. 87. : Latin America Metaraminol Bitartrate Market Volume, By Type, 2023– 2030 (Kilo Tons)  132

TABLE NO. 88. : Latin America Metaraminol Bitartrate Market Revenue, By Type, 2017 – 2022 (USD Million)  133

TABLE NO. 89. : Latin America Metaraminol Bitartrate Market Revenue, By Type, 2023– 2030 (USD Million)  133

TABLE NO. 90. : Latin America Metaraminol Bitartrate Market Volume, By Application, 2017 – 2022 (Kilo Tons)  134

TABLE NO. 91. : Latin America Metaraminol Bitartrate Market Volume, By Application, 2023– 2030 (Kilo Tons)  134

TABLE NO. 92. : Latin America Metaraminol Bitartrate Market Revenue, By Application, 2017 – 2022 (USD Million)  135

TABLE NO. 93. : Latin America Metaraminol Bitartrate Market Revenue, By Application, 2023– 2030 (USD Million)  135

TABLE NO. 94. : Latin America Metaraminol Bitartrate Market Volume, By End-user, 2017 – 2022 (Kilo Tons)  136

TABLE NO. 95. : Latin America Metaraminol Bitartrate Market Volume, By End-user, 2023– 2030 (Kilo Tons)  136

TABLE NO. 96. : Latin America Metaraminol Bitartrate Market Revenue, By End-user, 2017 – 2022 (USD Million)  137

TABLE NO. 97. : Latin America Metaraminol Bitartrate Market Revenue, By End-user, 2023– 2030 (USD Million)  137

TABLE NO. 98. : Middle East Metaraminol Bitartrate Market Volume, By Country, 2017 – 2022 (Kilo Tons)  140

TABLE NO. 99. : Middle East Metaraminol Bitartrate Market Volume, By Country, 2023– 2030 (Kilo Tons)  140

TABLE NO. 100. : Middle East Metaraminol Bitartrate Market Revenue, By Country, 2017 – 2022 (USD Million)  141

TABLE NO. 101. : Middle East Metaraminol Bitartrate Market Revenue, By Country, 2023– 2030 (USD Million)  141

TABLE NO. 102. : Middle East Metaraminol Bitartrate Market Volume, By Type, 2017 – 2022 (Kilo Tons)  142

TABLE NO. 103. :  Middle East Metaraminol Bitartrate Market Volume, By Type, 2023– 2030 (Kilo Tons)  142

TABLE NO. 104. : Middle East Metaraminol Bitartrate Market Revenue, By Type, 2017 – 2022 (USD Million)  143

TABLE NO. 105. : Middle East Metaraminol Bitartrate Market Revenue, By Type, 2023– 2030 (USD Million)  143

TABLE NO. 106. : Middle East Metaraminol Bitartrate Market Volume, By Application, 2017 – 2022 (Kilo Tons)  144

TABLE NO. 107. : Middle East Metaraminol Bitartrate Market Volume, By Application, 2023– 2030 (Kilo Tons)  144

TABLE NO. 108. : Middle East Metaraminol Bitartrate Market Revenue, By Application, 2017 – 2022 (USD Million)  145

TABLE NO. 109. : Middle East Metaraminol Bitartrate Market Revenue, By Application, 2023– 2030 (USD Million)  145

TABLE NO. 110. : Middle East Metaraminol Bitartrate Market Volume, By End-user, 2017 – 2022 (Kilo Tons)  146

TABLE NO. 111. : Middle East Metaraminol Bitartrate Market Volume, By End-user, 2023– 2030 (Kilo Tons)  146

TABLE NO. 112. : Middle East Metaraminol Bitartrate Market Revenue, By End-user, 2017 – 2022 (USD Million)  147

TABLE NO. 113. :  Middle East Metaraminol Bitartrate Market Revenue, By End-user, 2023– 2030 (USD Million)  147

TABLE NO. 114. : Africa Metaraminol Bitartrate Market Volume, By Country, 2017 – 2022 (Kilo Tons)  150

TABLE NO. 115. : Africa Metaraminol Bitartrate Market Volume, By Country, 2023– 2030 (Kilo Tons)  150

TABLE NO. 116. : Africa Metaraminol Bitartrate Market Revenue, By Country, 2017 – 2022 (USD Million)  151

TABLE NO. 117. : Africa Metaraminol Bitartrate Market Revenue, By Country, 2023– 2030 (USD Million)  151

TABLE NO. 118. : Africa Metaraminol Bitartrate Market Volume, By Type, 2017 – 2022 (Kilo Tons)  152

TABLE NO. 119. : Africa Metaraminol Bitartrate Market Volume, By Type, 2023– 2030 (Kilo Tons)  152

TABLE NO. 120. : Africa Metaraminol Bitartrate Market Revenue, By Type, 2017 – 2022 (USD Million)  153

TABLE NO. 121. :  Africa Metaraminol Bitartrate Market Revenue, By Type, 2023– 2030 (USD Million)  153

TABLE NO. 122. :  Africa Metaraminol Bitartrate Market Volume, By Application, 2017 – 2022 (Kilo Tons)  154

TABLE NO. 123. :  Africa Metaraminol Bitartrate Market Volume, By Application, 2023– 2030 (Kilo Tons)  154

TABLE NO. 124. :  Africa Metaraminol Bitartrate Market Revenue, By Application, 2017 – 2022 (USD Million)  155

TABLE NO. 125. :  Africa Metaraminol Bitartrate Market Revenue, By Application, 2023– 2030 (USD Million)  155

TABLE NO. 126. :  Africa Metaraminol Bitartrate Market Volume, By End-user, 2017 – 2022 (Kilo Tons)  156

TABLE NO. 127. :  Africa Metaraminol Bitartrate Market Volume, By End-user, 2023– 2030 (Kilo Tons)  156

TABLE NO. 128. :  Africa Metaraminol Bitartrate Market Revenue, By End-user, 2017 – 2022 (USD Million)  157

TABLE NO. 129. :  Africa Metaraminol Bitartrate Market Revenue, By End-user, 2023– 2030 (USD Million)  157

Frequently asked questions

What is the current size of the global metaraminol bitartrate market?

The global metaraminol bitartrate is currently valued at USD 13.34 million in 2022.

What is the expected growth rate of the metaraminol bitartrate market between 2023 and 2030?

The global metaraminol bitartrate market is expected to reach USD 18.86 million in 2030. Growing at a CAGR of 5.07% between 2023 and 2030.

Which market segment has the most shares in terms of application?

Hypotension treatment is the leading segment by application in the metaraminol bitartrate market.

Which end users have the highest demand for metaraminol bitartrate in the world?

The hospital segment governs the highest demand in the global metaraminol bitartrate market.

Which metaraminol bitartrate type market segment is expected to have the highest CAGR during the forecast period?

The API type is expected to witness the fastest metaraminol bitartrate market growth during the forecast period.

Which region in the world is leading the growth of metaraminol bitartrate?

North America is currently fueling the growth of the metaraminol bitartrate market, holding over 40% of shares.

Who are the key players in the global metaraminol bitartrate market?

The top players in the metaraminol bitartrate market are spectrum chemical manufacturing corp., sinoway, toronto research chemicals, biosynth ag, laboratori alchemia, chengdy shuxi pharmaceutical co., ltd., abx gmbh, wuhan fortuna chemical co., ltd., sphinx scientific laboratory (tianjin) co., ltd, and others.

What are the major market drivers of the metaraminol bitartrate global industry?

The major metaraminol bitartrate market drivers include growth in global demand for drugs that can prevent and treat hypotension during anesthesia techniques, use of metaraminol bitartrate in surgeries and medical procedures, and growth of healthcare infrastructure and advancements in medical facilities on a global level.

What are the major market restaurants of the metaraminol bitartrate global industry?

The major market restraints include regulatory factors, adverse drug reactions, and the safety of metaraminol bitartrate.

What are the major opportunities for the growth of the metaraminol bitartrate market?

The major opportunities that can fuel the growth of the metaraminol bitartrate market are research and development in the field of surgical procedures and anesthetic techniques, emerging markets, and continuous demand for drugs to stabilize blood pressure levels during surgery and medical interventions.

Chemical

Petrochemical Processing Equipment Market

Published Date: Sept 2023
Category: Chemicals
Report ID: 61354
Report Format: PDF
No of Pages: 234

Chemical

Ethanol To Jet Fuel (ETJ) Processing Technology Market

Published Date: Sept 2023
Category: Chemicals
Report ID: 61344
Report Format: PDF
No of Pages: 214

Chemical

Chemical Processing Catalysts Market

Published Date: Sep. 2023
Category: Chemicals
Report ID: 61338
Report Format: PDF
No of Pages: 248

Chemical

Encapsulated Lactic Acid Market

Published Date: Sep 2023
Category: Chemicals
Report ID: 61118
Report Format: PDF
No of Pages: 218

Chemical

TCD Alcohol DM Market

Published Date: Sep 2023
Category: Chemicals
Report ID: 62105
Report Format: PDF
No of Pages: 227

Chemical

Sodium Hexametaphosphate (SHMP) Market

Published Date: Sep 2023
Category: Chemicals
Report ID: 62104
Report Format: PDF
No of Pages: 245

Chemical

Aluminum Isopropoxide Market

Published Date: Sep 2023
Category: Chemicals
Report ID:60595
Report Format: PDF
No of Pages: 233

Chemical

Limonin Market

Published Date: Sep 2023
Category: Chemicals
Report ID: 62095
Report Format: PDF
No of Pages: 228

Chemical

Lactic Acid Market

Published Date: August 2023
Category: Chemicals
Report ID: 57759
Report Format: PDF
No of Pages: 234

Chemical

Polybutene Market

Published Date: Aug 2023
Category: Chemicals
Report ID: 58038
Report Format: PDF
No of Pages: 235

Chemical

Polychlorotrifluoroethylene (PCTFE) Market

Published Date: Aug 2023
Category: Chemicals
Report ID:62084
Report Format: PDF
No of Pages: 230

Chemical

Polyisocyanurate Insulation Market

Published Date: August 2023
Category: Chemicals
Report ID: 62082
Report Format: PDF
No of Pages: 243

Download Sample Report


Have a question?

User Profile

Don’t settle for less – trust Mitul to help you find the best solution.

Report delivery within 24 to 48 hours

– Other Info –

What people say?-

User Review

I am very impressed with the information in this report. The author clearly did their research when they came up with this product and it has already given me a lot of ideas.

Jana Schmidt
CEDAR CX Technologies

– Connect with us –

Phone

+91 6232 49 3207


support

24/7 Research Support


sales@credenceresearch.com

– Research Methodology –

Going beyond the basics: advanced techniques in research methodology

– Trusted By –

Pepshi, LG, Nestle
Motorola, Honeywell, Johnson and johnson
LG Chem, SIEMENS, Pfizer
Unilever, Samsonite, QIAGEN
WhatsApp Now