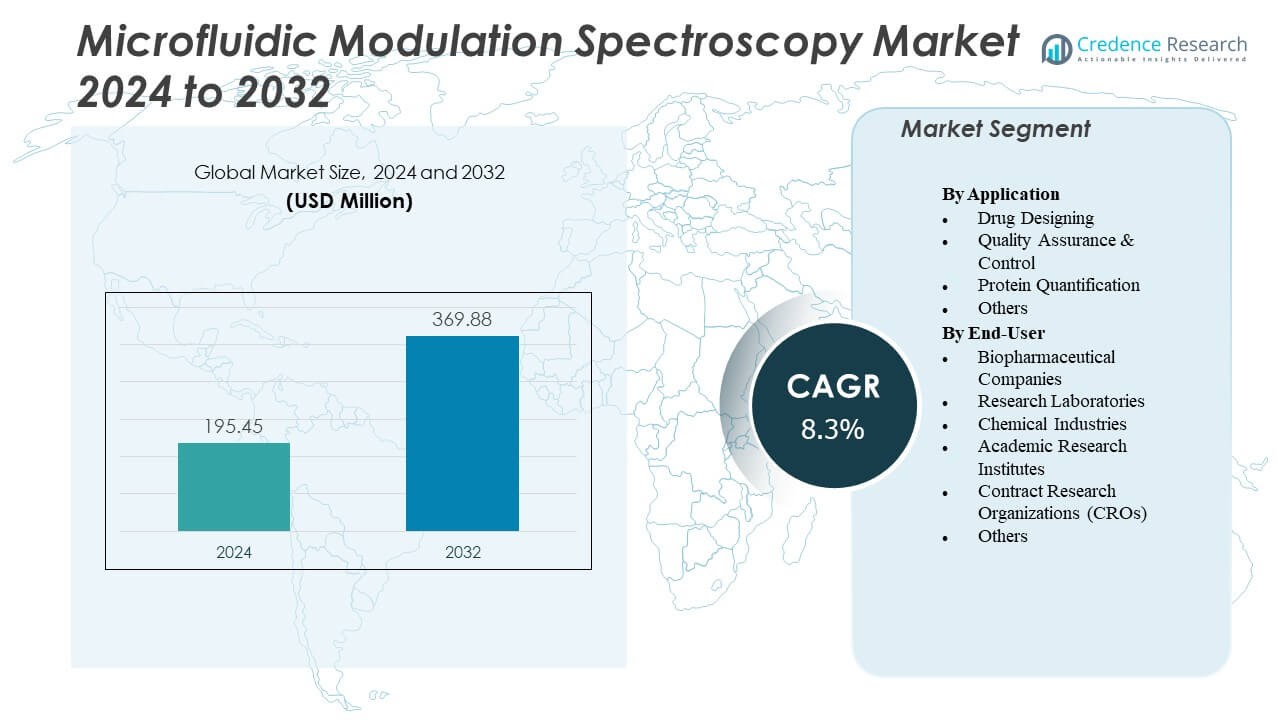
Home » Healthcare » Microfluidic Modulation Spectroscopy Market

Global Microfluidic Modulation Spectroscopy By Application (Drug Designing, Quality Assurance & Control, Protein quantification, Others) By End User (Research Laboratories, Chemical Industries, Academic Research Institutes, Contract Research Organizations, Biopharmaceutical Companies, Others)-Growth, Future Prospects & Competitive Analysis, 2016 – 2030

Price: $4999

Published: | Report ID: 16265 | Report Format : PDF

Key Highlights of the Report

The global microfluidic modulation spectroscopy market is segmented by end user, applications, and region. Drug designing segment is the most popular, while quality assurance & control is the primary type segment. Research Laboratories is the applications segment, with Europe leading the market growth.

The global microfluidic modulation spectroscopy market has been driven by several factors, such as the offers enhanced sensitivity and selectivity compared to traditional spectroscopic techniques & potential for advancements in various fields, particularly in the biomedical and pharmaceutical industries. However, the market also faces significant challenges, including the high sensitivity and favourable signal-to-noise ratio is crucial for accurate analysis in microfluidic modulation spectroscopy & cost of microfluidic modulation spectroscopy systems can be a barrier to widespread adoption.

Nonetheless, the global microfluidic modulation spectroscopy market offers significant growth opportunities, such as the microfluidic modulation spectroscopy allows for precise and sensitive analysis of samples, enabling advancements in fields such as biotechnology, pharmaceuticals, environmental monitoring, and materials science.

Microfluidic modulation spectroscopy Market

What Are the Main Drivers Of The Global Microfluidic modulation spectroscopy Market?

The global Microfluidic modulation spectroscopy market is driven by several factors, including enhanced sensitivity and selectivity compared to traditional spectroscopic techniques & potential for advancements in various fields, particularly in the biomedical and pharmaceutical industries.

Design Element 2

Access crucial information at unmatched prices!

Request your free sample report today & start making informed decisions powered by Credence Research!

Download Free Sample
CTA Design Element 3

What Are the Major Challenges Faced by The Global Microfluidic modulation spectroscopy Market?

The global Microfluidic modulation spectroscopy market also faces several challenges, such as high sensitivity and a favourable signal-to-noise ratio is crucial for accurate analysis in microfluidic modulation spectroscopy & cost of microfluidic modulation spectroscopy systems can be a barrier to widespread adoption.

What Are the Growth Opportunities in The Global Microfluidic modulation spectroscopy market?

The global Microfluidic modulation spectroscopy market offers significant growth opportunities, such as microfluidic modulation spectroscopy allows for precise and sensitive analysis of samples, enabling advancements in fields such as biotechnology, pharmaceuticals, environmental monitoring, and materials science.

Executive Summary

Overview of the Global Microfluidic modulation spectroscopy market

The global Microfluidic modulation spectroscopy market has been steadily growing in recent years due to enhanced sensitivity and selectivity compared to traditional spectroscopic techniques & potential for advancements in various fields, particularly in the biomedical and pharmaceutical industries. The market is characterized by a wide range of equipment, designs, and sizes, catering to diverse consumer preferences.

Market Definition

Microfluidic modulation spectroscopy refers to a market encompassing the use of microfluidic systems and spectroscopic techniques to investigate the interaction between light and fluids at a microscale level. This technology involves the integration of microfluidics, which enable precise manipulation and control of fluids, with spectroscopic analysis, which provides detailed information about the chemical and physical properties of substances. It offers advantages such as high sensitivity, rapid analysis, and small sample requirements. The microfluidic modulation spectroscopy market finds applications in various fields, including biomedical research, pharmaceuticals, environmental monitoring, and chemical analysis, where accurate and efficient analysis of samples is essential.

Market Insights

  • The global demand for microfluidic modulation spectroscopy was valued at USD XX Billion in 2022 and is expected to reach USD XX Billion in 2030, growing at a CAGR of 8.50% between 2023 and 2030.
  • Drug Designing are the leading segment and held more than three-firth of the share in terms of value in 2022, while the quality assurance & control segment is likely to exhibit the fastest CAGR during the forecast period.
  • Research Laboratories is expected to post the highest CAGR during the forecast period & leading the market share with more than 35% share in 2022.
  • Europe is fueling the growth of the Microfluidic modulation spectroscopy industry with nearly two-third share in 2022, while Europe and North America collectively accounted for just nearly under 55% share in 2022. North America held more than 30% share in 2022.
  • Major driver that drives the market is enhanced sensitivity and selectivity compared to traditional spectroscopic techniques & potential for advancements in various fields, particularly in the biomedical and pharmaceutical industries.
  • At the same time, developing and manufacturing microfluidic modulation spectroscopy systems can be costly, especially for customized or specialized applications are the main restraints.
  • The global shift towards a microfluidic modulation spectroscopy allows for precise and sensitive analysis of samples, enabling advancements in fields such as biotechnology, pharmaceuticals, environmental monitoring, and materials science as the major opportunities in the market.

Microfluidic modulation spectroscopy Market Pointers

Market Overview

The global Microfluidic modulation spectroscopy market has witnessed steady growth in recent years and is expected to grow at a CAGR of 8.50% between 2023 and 2030. The market was valued at USD XX billion in 2022 and is expected to reach USD XX billion in 2030.

Segmentation by End User

  • Research Laboratories type is the leading segment and held more than 35% share in value in 2022.
  • Chemical Industries will likely exhibit the fastest CAGR during the forecast period.

Segmentation by Applications

  • Drug Designing segment governs the demand for the microfluidic modulation spectroscopy industry in the world, holding a massive share, and is also expected to grow at a rapid CAGR.
  • Quality Assurance & Control segment contributes to the rest of the demand for microfluidic modulation spectroscopy market.

Segmentation by Region

  • Europe was fueling the growth of the Microfluidic modulation spectroscopy industry with a nearly two-third share in 2022.
  • Asia-pacific and North America collectively account for nearly under 55% share in 2022, with North America held more than 30% share in 2022.
  • The rest of the world, including Latin America, The Middle East, and Africa, contributes the remainder to the demand for microfluidic modulation spectroscopy.

Enhanced sensitivity and selectivity compared to traditional spectroscopic techniques & potential for advancements in various fields, particularly in the biomedical and pharmaceutical industries drive the market. However, the market is restrained by developing and manufacturing microfluidic modulation spectroscopy systems can be costly, especially for customized or specialized applications.

Germany has a robust research infrastructure with world-class universities, research institutes, and technology hubs. This fosters innovation and facilitates cutting-edge research in fields such as microfluidics and spectroscopy, driving the development of new technologies and applications. It has a culture of collaboration between academia and industry. Close ties between research institutions and companies enable the efficient translation of scientific discoveries into practical applications. This collaborative approach accelerates the development and commercialization of microfluidic modulation spectroscopy technologies.

Canada is home to renowned universities and research institutions that excel in fields related to microfluidics and spectroscopy. These institutions conduct cutting-edge research and foster innovation, providing a solid foundation for the development of microfluidic modulation spectroscopy technologies. The Canadian government prioritizes research and development through various funding programs and initiatives. This support encourages collaboration between academia and industry, facilitates technology transfer, and stimulates the growth of the microfluidic modulation spectroscopy sector.

Market Drivers

Several factors drive the global microfluidic modulation spectroscopy market. The following are the key drivers of the global Microfluidic modulation spectroscopy market:

Increasing Demand for Point-of-Care Diagnostics

Growing demand for point-of-care diagnostics is one of the drivers of microfluidic modulation spectroscopy industry. Microfluidic modulation spectroscopy offers the potential for rapid and accurate analysis of biological samples, making it well-suited for point-of-care applications where quick and on-site diagnostic results are crucial.
For instance, a Canadian company called ChipCare Corporation has developed a microfluidic device called mPulse that combines microfluidics with spectroscopy for point-of-care HIV diagnostics. The device uses microfluidic channels to handle small volumes of blood and spectroscopic analysis to detect HIV-specific biomarkers. The results are obtained within minutes, enabling timely diagnosis and treatment initiation. The development of such innovative devices highlights the potential of microfluidic modulation spectroscopy in addressing the need for rapid and portable diagnostic tools.

Growing Importance of Precision Medicine

The growing emphasis on precision medicine is another driver for the microfluidic modulation spectroscopy market. Precision medicine aims to provide personalized treatment based on an individual’s unique characteristics, including genetic and molecular information. Microfluidic modulation spectroscopy enables detailed analysis of biological samples at a molecular level, facilitating the identification of specific biomarkers and molecular signatures associated with diseases and individual patient responses.

Market Restraints

The global Microfluidic modulation spectroscopy market faces some challenges that may hinder its growth. These include the following:

High Cost of Production and Infrastructure Development

One restraint of the microfluidic modulation spectroscopy market is the complexity and cost associated with integrating microfluidics and spectroscopic techniques into a single device or platform. The development and commercialization of such integrated systems pose technical and financial challenges, which can limit the widespread adoption of microfluidic modulation spectroscopy technologies.

For instance, development of a microfluidic modulation spectroscopy device for multi-parameter analysis in clinical diagnostics. Integrating microfluidics for sample handling, precise fluid control, and spectroscopic analysis for multiple analytes requires expertise in different disciplines, such as microfabrication, optics, and fluid dynamics. This complexity adds to the overall development time and cost of the device

Opportunities

The global microfluidic modulation spectroscopy market offers significant growth opportunities. These include the following:

Potential application in environmental monitoring

One significant opportunity in the microfluidic modulation spectroscopy market lies in its potential application in the field of environmental monitoring, specifically for water quality analysis. Microfluidic modulation spectroscopy can offer rapid and accurate analysis of various water parameters, providing valuable insights for environmental monitoring and ensuring the safety of water resources.

For instance, researchers at Stanford University developed a microfluidic modulation spectroscopy-based system called “DropMap” for on-site water quality monitoring. The system uses a microfluidic chip to generate droplets containing water samples and then performs spectroscopic analysis on each droplet to detect contaminants such as heavy metals, organic pollutants, and pathogens. The system can quickly analyse multiple samples simultaneously, providing real-time information about water quality.

Competitive Landscape

Key Players

The global Microfluidic modulation spectroscopy market is highly competitive, with the presence of several key players. Some of the major players in the market and their market share are as follows:

  • RedShift BioAnalytics, Inc
  • Lumedica Inc
  • Spectradyne LLC
  • Insplorion AB
  • Fluidion SAS
  • Biolin Scientific AB and others

These companies focus on product innovation, expanding their applications, mergers, and acquisitions to stay ahead in the market.

The major players in the global Microfluidic modulation spectroscopy market constantly strive to stay ahead by introducing new products and innovations.

Shape Your Report to Specific Countries or Regions & Enjoy 30% Off!

Summary of Key Findings

  • Enhanced sensitivity and selectivity compared to traditional spectroscopic techniques & potential for advancements in various fields, particularly in the biomedical and pharmaceutical industries driving market growth
  • Market segmented by applications, end user and region.
  • Drug Designing is the most popular application segment, with quality assurance & control application as the primary type segment.
  • Research Laboratories is the most common End Users segment.
  • Europe is leading market growth; the market is highly competitive with key players including RedShift BioAnalytics, Inc. . RedShift BioAnalytics, Inc., Spectradyne LLC, Insplorion AB, Fluidion SAS, Biolin Scientific AB and others.

Future Outlook

  • Positive outlook for the global microfluidic modulation spectroscopy market with significant growth potential in the Europe region
  • Enhanced sensitivity and selectivity compared to traditional spectroscopic techniques & potential for advancements in various fields, particularly in the biomedical and pharmaceutical industries drive growth
  • Challenges like high sensitivity and a favourable signal-to-noise ratio is crucial for accurate analysis in microfluidic modulation spectroscopy & cost of microfluidic modulation spectroscopy systems can be a barrier to widespread adoption.

Segmentation

  • By Application
    • Drug Designing
    • Quality Assurance & Control
    • Protein quantification
    • Others
  • By End User
    • Research Laboratories
    • Chemical Industries
    • Academic Research Institutes
    • Contract Research Organizations
    • Biopharmaceutical Companies
    • Others
  • By Region
  • North America
    • US
    • Canada
    • Mexico
  • Europe
    • Germany
    • France
    • The U.K.
    • Italy
    • Spain
    • Rest of Europe
  • Asia Pacific
    • China
    • Japan
    • India
    • South Korea
    • South-east Asia
    • Rest of Asia Pacific
  • Latin America
    • Brazil
    • Argentina
    • Rest of Latin America
  • Middle East & Africa
    • GCC Countries
    • South Africa
    • Rest of the Middle East and Africa

1. Preface
1.1. Report Description
1.1.1. Purpose of the Report
1.1.2. Target Audience
1.1.3. USP and Key Offerings
1.2. Research Scope
1.3. Research Methodology
1.3.1. Phase I – Secondary Research
1.3.2. Phase II – Data Modelling
1.3.2.1. Company Share Analysis Model
1.3.2.2. Revenue Based Modelling
1.3.3. Phase III – Primary Research
1.3.4. Research Limitations
1.3.5. Assumptions
1.4. Market Introduction
1.5. Market Research Scope

2. Executive Summary
2.1. Market Snapshot: Global Microfluidic modulation spectroscopy Market
2.2. Global Microfluidic modulation spectroscopy Market, By End User
2.3. Global Microfluidic modulation spectroscopy Market, By Application
2.4. Global Microfluidic modulation spectroscopy Market, By Region

3. Market Dynamics & Factors Analysis
3.1. Introduction
3.1.1. Global Microfluidic modulation spectroscopy Market Value, 2017-2030, (US$ Bn)
3.1.2. Y-o-Y Growth Trend Analysis
3.2. Market Dynamics
3.2.1. Market Drivers
3.2.2. Market Restraints
3.2.3. Market Opportunities
3.2.4. Major Industry Challenges
3.3. Growth and Development Patterns
3.4. Investment Feasibility Analysis
3.5. Market Opportunity Analysis
3.5.1. End User
3.5.2. Application
3.5.3. Geography

4. Premium Insights
4.1. STAR (Situation, Task, Action, Results) Analysis
4.2. Porter’s Five Forces Analysis
4.2.1. Threat of New Entrants
4.2.2. Bargaining Power of Buyers/Consumers
4.2.3. Bargaining Power of Suppliers
4.2.4. Threat of Substitute Types
4.2.5. Intensity of Competitive Rivalry
4.3. Key Market Trends
4.3.1. Demand Side Trends
4.3.2. Supply Side Trends
4.4. Value Chain Analysis
4.5. Technology Analysis
4.6. Analysis and Recommendations
4.7. Marketing Strategy Analysis
4.7.1. Direct Marketing
4.7.2. Indirect Marketing
4.7.3. Marketing Channel Development Trend

5. Market Positioning of Key Players, 2022
5.1. Company market share of key players, 2022
5.2. Competitive Benchmarking
5.3. Market Positioning of Key Vendors
5.4. Geographical Presence Analysis
5.5. Major Strategies Adopted by Key Players
5.5.1. Key Strategies Analysis
5.5.2. Mergers and Acquisitions
5.5.3. Partnerships
5.5.4. Product Launch
5.5.5. Geographical Expansion
5.5.6. Others

6. Economic Impact Analysis
6.1. Recession Impact
6.1.1. North America
6.1.2. Europe
6.1.3. Asia Pacific
6.1.4. Latin America
6.1.5. Middle East and Africa
6.2. Ukraine-Russia War Impact
6.2.1. North America
6.2.2. Europe
6.2.3. Asia Pacific
6.2.4. Latin America
6.2.5. Middle East and Africa
6.3. COVID-19 Impact Analysis
6.3.1. North America
6.3.2. Europe
6.3.3. Asia Pacific
6.3.4. Latin America
6.3.5. Middle East and Africa

7. Global Microfluidic modulation spectroscopy Market, By End User
7.1. Global Microfluidic modulation spectroscopy Market Overview, by End User
7.1.1. Global Microfluidic modulation spectroscopy Market Revenue Share, By End User, 2022 Vs 2030 (in %)
7.2. Research Laboratories
7.2.1. Global Microfluidic modulation spectroscopy Market, By Region, 2017-2030 (US$ Bn)
7.3. Chemical Industries
7.3.1. Global Microfluidic modulation spectroscopy Market, By Region, 2017-2030 (US$ Bn)
7.4. Academic Research Institutes
7.4.1. Global Microfluidic modulation spectroscopy Market, By Region, 2017-2030 (US$ Bn)
7.5. Contract Research Organizations
7.5.1. Global Microfluidic modulation spectroscopy Market, By Region, 2017-2030 (US$ Bn)
7.6. Biopharmaceutical Companies
7.6.1. Global Microfluidic modulation spectroscopy Market, By Region, 2017-2030 (US$ Bn)
7.7. Others
7.7.1. Global Microfluidic modulation spectroscopy Market, By Region, 2017-2030 (US$ Bn)

8. Global Microfluidic modulation spectroscopy Market, By Application
8.1. Global Microfluidic modulation spectroscopy Market Overview, by Application
8.1.1. Global Microfluidic modulation spectroscopy Market, By Application, 2022 vs 2030 (in %)
8.2. Drug Designing
8.2.1. Global Microfluidic modulation spectroscopy Market, By Region, 2017-2030 (US$ Bn)
8.3. Quality Assurance & Control
8.3.1. Global Microfluidic modulation spectroscopy Market, By Region, 2017-2030 (US$ Bn)
8.4. Protein quantification
8.4.1. Global Microfluidic modulation spectroscopy Market, By Region, 2017-2030 (US$ Bn)
8.5. Other
8.5.1. Global Microfluidic modulation spectroscopy Market, By Region, 2017-2030 (US$ Bn)

9. Global Microfluidic modulation spectroscopy Market, By Region
9.1. Global Microfluidic modulation spectroscopy Market Overview, by Region
9.1.1. Global Microfluidic modulation spectroscopy Market, By Region, 2022 vs 2030 (in%)
9.2. End User
9.2.1. Global Microfluidic modulation spectroscopy Market, By End User, 2017-2030 (US$ Bn)
9.3. Application
9.3.1. Global Microfluidic modulation spectroscopy Market, By Application, 2017-2030 (US$ Bn)

10. North America Microfluidic modulation spectroscopy Market Analysis
10.1. North America Microfluidic modulation spectroscopy Market, by End User, 2017-2030(US$ Bn)
10.1.1. Overview
10.1.2. SRC Analysis
10.2. North America Microfluidic modulation spectroscopy Market, by Application, 2017-2030(US$ Bn)
10.2.1. Overview
10.2.2. SRC Analysis
10.3. North America Microfluidic modulation spectroscopy Market, by Country, 2017-2030 (US$ Bn)
10.3.1. North America Microfluidic modulation spectroscopy Market, by Country, 2022 Vs 2030 (in%)
10.3.2. U.S.
10.3.2.1. U.S. Microfluidic modulation spectroscopy Market Estimates and Forecast, 2017-2030 (US$ Bn)
10.3.2.2. U.S. Microfluidic modulation spectroscopy, By End User, 2017-2030 (US$ Bn)
10.3.2.3. U.S. Microfluidic modulation spectroscopy, By Application, 2017-2030 (US$ Bn)
10.3.3. Canada
10.3.3.1. Canada Microfluidic modulation spectroscopy Market Estimates and Forecast, 2017-2030 (US$ Bn)
10.3.3.2. Canada Microfluidic modulation spectroscopy, By End User, 2017-2030 (US$ Bn)
10.3.3.3. Canada Microfluidic modulation spectroscopy, By Application, 2017-2030 (US$ Bn)
10.3.4. Mexico
10.3.4.1. Mexico Microfluidic modulation spectroscopy Market Estimates and Forecast, 2017-2030 (US$ Bn)
10.3.4.2. Mexico Microfluidic modulation spectroscopy, By End User, 2017-2030 (US$ Bn)
10.3.4.3. Mexico Microfluidic modulation spectroscopy, By Application, 2017-2030 (US$ Bn)

11. Europe Microfluidic modulation spectroscopy Market Analysis
11.1. Europe Microfluidic modulation spectroscopy Market, by End User, 2017-2030(US$ Bn)
11.1.1. Overview
11.1.2. SRC Analysis
11.2. Europe Microfluidic modulation spectroscopy Market, by Application, 2017-2030(US$ Bn)
11.2.1. Overview
11.2.2. SRC Analysis
11.3. Europe Microfluidic modulation spectroscopy Market, by Country, 2017-2030 (US$ Bn)
11.3.1. Europe Microfluidic modulation spectroscopy Market, by Country, 2022 Vs 2030 (in%)
11.3.2. Germany
11.3.2.1. Germany Microfluidic modulation spectroscopy Market Estimates and Forecast, 2017-2030 (US$ Bn)
11.3.2.2. Germany Microfluidic modulation spectroscopy, By End User, 2017-2030 (US$ Bn)
11.3.2.3. Germany Microfluidic modulation spectroscopy, By Application, 2017-2030 (US$ Bn)
11.3.3. France
11.3.3.1. France Microfluidic modulation spectroscopy Market Estimates and Forecast, 2017-2030 (US$ Bn)
11.3.3.2. France Microfluidic modulation spectroscopy, By End User, 2017-2030 (US$ Bn)
11.3.3.3. France Microfluidic modulation spectroscopy, By Application, 2017-2030 (US$ Bn)
11.3.4. UK
11.3.4.1. UK Microfluidic modulation spectroscopy Market Estimates and Forecast, 2017-2030 (US$ Bn)
11.3.4.2. UK Microfluidic modulation spectroscopy, By End User, 2017-2030 (US$ Bn)
11.3.4.3. UK Microfluidic modulation spectroscopy, By Application, 2017-2030 (US$ Bn)
11.3.5. Italy
11.3.5.1. Italy Microfluidic modulation spectroscopy Market Estimates and Forecast, 2017-2030 (US$ Bn)
11.3.5.2. Italy Microfluidic modulation spectroscopy, By End User, 2017-2030 (US$ Bn)
11.3.5.3. Italy Microfluidic modulation spectroscopy, By Application, 2017-2030 (US$ Bn)
11.3.6. Spain
11.3.6.1. Spain Microfluidic modulation spectroscopy Market Estimates and Forecast, 2017-2030 (US$ Bn)
11.3.6.2. Spain Microfluidic modulation spectroscopy, By End User, 2017-2030 (US$ Bn)
11.3.6.3. Spain Microfluidic modulation spectroscopy, By Application, 2017-2030 (US$ Bn)
11.3.7. Rest of Europe
11.3.7.1. Rest of Europe Microfluidic modulation spectroscopy Market Estimates and Forecast, 2017-2030 (US$ Bn)
11.3.7.2. Rest of Europe Microfluidic modulation spectroscopy, By End User, 2017-2030 (US$ Bn)
11.3.7.3. Rest of Europe Microfluidic modulation spectroscopy, By Application, 2017-2030 (US$ Bn)

12. Asia Pacific Microfluidic modulation spectroscopy Market Analysis
12.1. Asia Pacific Microfluidic modulation spectroscopy Market, by End User, 2017-2030(US$ Bn)
12.1.1. Overview
12.1.2. SRC Analysis
12.2. Asia Pacific Microfluidic modulation spectroscopy Market, by Application, 2017-2030(US$ Bn)
12.2.1. Overview
12.2.2. SRC Analysis
12.3. Asia Pacific Microfluidic modulation spectroscopy Market, by Country, 2017-2030 (US$ Bn)
12.3.1. Asia Pacific Microfluidic modulation spectroscopy Market, by Country, 2022 Vs 2030 (in%)
12.3.2. China
12.3.2.1. China Microfluidic modulation spectroscopy Market Estimates and Forecast, 2017-2030 (US$ Bn)
12.3.2.2. China Microfluidic modulation spectroscopy, By End User, 2017-2030 (US$ Bn)
12.3.2.3. China Microfluidic modulation spectroscopy, By Application, 2017-2030 (US$ Bn)
12.3.3. Japan
12.3.3.1. Japan Microfluidic modulation spectroscopy Market Estimates and Forecast, 2017-2030 (US$ Bn)
12.3.3.2. Japan Microfluidic modulation spectroscopy, By End User, 2017-2030 (US$ Bn)
12.3.3.3. Japan Microfluidic modulation spectroscopy, By Application, 2017-2030 (US$ Bn)
12.3.4. India
12.3.4.1. India Microfluidic modulation spectroscopy Market Estimates and Forecast, 2017-2030 (US$ Bn)
12.3.4.2. India Microfluidic modulation spectroscopy, By End User, 2017-2030 (US$ Bn)
12.3.4.3. India Microfluidic modulation spectroscopy, By Application, 2017-2030 (US$ Bn)
12.3.5. South Korea
12.3.5.1. South Korea Microfluidic modulation spectroscopy Market Estimates and Forecast, 2017-2030 (US$ Bn)
12.3.5.2. South Korea Microfluidic modulation spectroscopy, By End User, 2017-2030 (US$ Bn)
12.3.5.3. South Korea Microfluidic modulation spectroscopy, By Application, 2017-2030 (US$ Bn)
12.3.6. South-East Asia
12.3.6.1. South-East Asia Microfluidic modulation spectroscopy Market Estimates and Forecast, 2017-2030 (US$ Bn)
12.3.6.2. South-East Asia Microfluidic modulation spectroscopy, By End User, 2017-2030 (US$ Bn)
12.3.6.3. South-East Asia Microfluidic modulation spectroscopy, By Application, 2017-2030 (US$ Bn)
12.3.7. Rest of Asia Pacific
12.3.7.1. Rest of Asia Pacific Microfluidic modulation spectroscopy Market Estimates and Forecast, 2017-2030 (US$ Bn)
12.3.7.2. Rest of Asia Pacific Microfluidic modulation spectroscopy, By End User, 2017-2030 (US$ Bn)
12.3.7.3. Rest of Asia Pacific Microfluidic modulation spectroscopy, By Application, 2017-2030 (US$ Bn)

13. Latin America Microfluidic modulation spectroscopy Market Analysis
13.1. Latin America Microfluidic modulation spectroscopy Market, by End User, 2017-2030(US$ Bn)
13.1.1. Overview
13.1.2. SRC Analysis
13.2. Latin America Microfluidic modulation spectroscopy Market, by Application, 2017-2030(US$ Bn)
13.2.1. Overview
13.2.2. SRC Analysis
13.3. Latin America Microfluidic modulation spectroscopy Market, by Country, 2017-2030 (US$ Bn)
13.3.1. Latin America Microfluidic modulation spectroscopy Market, by Country, 2022 Vs 2030 (in%)
13.3.2. Brazil
13.3.2.1. Brazil Microfluidic modulation spectroscopy Market Estimates and Forecast, 2017-2030 (US$ Bn)
13.3.2.2. Brazil Microfluidic modulation spectroscopy, By End User, 2017-2030 (US$ Bn)
13.3.2.3. Brazil Microfluidic modulation spectroscopy, By Application, 2017-2030 (US$ Bn)
13.3.3. Argentina
13.3.3.1. Argentina Microfluidic modulation spectroscopy Market Estimates and Forecast, 2017-2030 (US$ Bn)
13.3.3.2. Argentina Microfluidic modulation spectroscopy, By End User, 2017-2030 (US$ Bn)
13.3.3.3. Argentina Microfluidic modulation spectroscopy, By Application, 2017-2030 (US$ Bn)
13.3.4. Rest of Latin America
13.3.4.1. Rest of Latin America Microfluidic modulation spectroscopy Market Estimates and Forecast, 2017-2030 (US$ Bn)
13.3.4.2. Rest of Latin America Microfluidic modulation spectroscopy, By End User, 2017-2030 (US$ Bn)
13.3.4.3. Rest of Latin America Microfluidic modulation spectroscopy, By Application, 2017-2030 (US$ Bn)

14. Middle East and Africa Microfluidic modulation spectroscopy Market Analysis
14.1. Middle East and Africa Microfluidic modulation spectroscopy Market, by End User, 2017-2030(US$ Bn)
14.1.1. Overview
14.1.2. SRC Analysis
14.2. Middle East and Africa Microfluidic modulation spectroscopy Market, by Application, 2017-2030(US$ Bn)
14.2.1. Overview
14.2.2. SRC Analysis
14.3. Middle East and Africa Microfluidic modulation spectroscopy Market, by Country, 2017-2030 (US$ Bn)
14.3.1. Middle East and Africa Microfluidic modulation spectroscopy Market, by Country, 2022 Vs 2030 (in%)
14.3.2. GCC Countries
14.3.2.1. GCC Countries Microfluidic modulation spectroscopy Market Estimates and Forecast, 2017-2030 (US$ Bn)
14.3.2.2. GCC Countries Microfluidic modulation spectroscopy, By End User, 2017-2030 (US$ Bn)
14.3.2.3. GCC Countries Microfluidic modulation spectroscopy, By Application, 2017-2030 (US$ Bn)
14.3.3. South Africa
14.3.3.1. South Africa Microfluidic modulation spectroscopy Market Estimates and Forecast, 2017-2030 (US$ Bn)
14.3.3.2. South Africa Microfluidic modulation spectroscopy, By End User, 2017-2030 (US$ Bn)
14.3.3.3. South Africa Microfluidic modulation spectroscopy, By Application, 2017-2030 (US$ Bn)
14.3.4. Rest of Middle East and Africa
14.3.4.1. Rest of Middle East and Africa Microfluidic modulation spectroscopy Market Estimates and Forecast, 2017-2030 (US$ Bn)
14.3.4.2. Rest of Middle East and Africa Microfluidic modulation spectroscopy, By End User, 2017-2030 (US$ Bn)
14.3.4.3. Rest of Middle East and Africa Microfluidic modulation spectroscopy, By Application, 2017-2030 (US$ Bn)

15. Company Profiles
15.1. RedShift BioAnalytics, Inc
15.1.1. Company Overview
15.1.2. Product /Services Portfolio
15.1.3. Geographical Presence
15.1.4. Financial Summary
15.1.4.1. Market Revenue and Net Profit (2019-2022)
15.1.4.2. Business Segment Revenue Analysis
15.1.4.3. Geographical Revenue Analysis
15.2. Lumedica Inc
15.3. Spectradyne LLC
15.4. Insplorion AB
15.5. Fluidion SAS
15.6. Biolin Scientific AB and others


List of Figures
FIG. 1 Global Microfluidic modulation spectroscopy Market: Research Methodology
FIG. 2 Market Size Estimation – Top Down & Bottom up Approach
FIG. 3 Global Microfluidic modulation spectroscopy Market Segmentation
FIG. 4 Global Microfluidic modulation spectroscopy Market, by End User, 2022 (US$ Bn)
FIG. 5 Global Microfluidic modulation spectroscopy Market, by Application, 2022 (US$ Bn)
FIG. 6 Global Microfluidic modulation spectroscopy Market, by Geography, 2022 (US$ Bn)
FIG. 7 Attractive Investment Proposition, by End User, 2022
FIG. 8 Attractive Investment Proposition, by Application, 2022
FIG. 9 Attractive Investment Proposition, by Geography, 2022
FIG. 10 Global Market Share Analysis of Key Microfluidic modulation spectroscopy Market Manufacturers, 2022
FIG. 11 Global Market Positioning of Key Microfluidic modulation spectroscopy Market Manufacturers, 2022
FIG. 12 Global Microfluidic modulation spectroscopy Market Value Contribution, By End User, 2022 & 2030 (Value %)
FIG. 13 Global Microfluidic modulation spectroscopy Market, by Research Laboratories, Value, 2017-2030 (US$ Bn)
FIG. 14 Global Microfluidic modulation spectroscopy Market, by Chemical Industries, Value, 2017-2030 (US$ Bn)
FIG. 15 Global Microfluidic modulation spectroscopy Market, by Academic Research Institutes, Value, 2017-2030 (US$ Bn)
FIG. 16 Global Microfluidic modulation spectroscopy Market, by Contract Research Organizations, Value, 2017-2030 (US$ Bn)
FIG. 17 Global Microfluidic modulation spectroscopy Market, by Biopharmaceutical Companies, Value, 2017-2030 (US$ Bn)
FIG. 18 Global Microfluidic modulation spectroscopy Market, by Others, Value, 2017-2030 (US$ Bn)
FIG. 19 Global Microfluidic modulation spectroscopy Market Value Contribution, By Application, 2022 & 2030 (Value %)
FIG. 20 Global Microfluidic modulation spectroscopy Market, by Drug Designing, Value, 2017-2030 (US$ Bn)
FIG. 21 Global Microfluidic modulation spectroscopy Market, by Quality Assurance & Control, 2017-2030 (US$ Bn)
FIG. 22 Global Microfluidic modulation spectroscopy Market, by Protein quantification, Value, 2017-2030 (US$ Bn)
FIG. 23 Global Microfluidic modulation spectroscopy Market, by Other, 2017-2030 (US$ Bn)
FIG. 24 North America Microfluidic modulation spectroscopy Market, 2017-2030 (US$ Bn)
FIG. 25 U.S. Microfluidic modulation spectroscopy Market, 2017-2030 (US$ Bn)
FIG. 26 Canada Microfluidic modulation spectroscopy Market, 2017-2030 (US$ Bn)
FIG. 27 Europe Microfluidic modulation spectroscopy Market, 2017-2030 (US$ Bn)
FIG. 28 Germany Microfluidic modulation spectroscopy Market, 2017-2030 (US$ Bn)
FIG. 29 France Microfluidic modulation spectroscopy Market, 2017-2030 (US$ Bn)
FIG. 30 U.K. Microfluidic modulation spectroscopy Market, 2017-2030 (US$ Bn)
FIG. 31 Italy Microfluidic modulation spectroscopy Market, 2017-2030 (US$ Bn)
FIG. 32 Spain Microfluidic modulation spectroscopy Market, 2017-2030 (US$ Bn)
FIG. 33 Rest of Europe Microfluidic modulation spectroscopy Market, 2017-2030 (US$ Bn)
FIG. 34 Asia Pacific Microfluidic modulation spectroscopy Market, 2017-2030 (US$ Bn)
FIG. 35 China Microfluidic modulation spectroscopy Market, 2017-2030 (US$ Bn)
FIG. 36 Japan Microfluidic modulation spectroscopy Market, 2017-2030 (US$ Bn)
FIG. 37 India Microfluidic modulation spectroscopy Market, 2017-2030 (US$ Bn)
FIG. 38 South Korea Microfluidic modulation spectroscopy Market, 2017-2030 (US$ Bn)
FIG. 39 South-East Asia Microfluidic modulation spectroscopy Market, 2017-2030 (US$ Bn)
FIG. 40 Rest of Asia Pacific Microfluidic modulation spectroscopy Market, 2017-2030 (US$ Bn)
FIG. 41 Latin America Microfluidic modulation spectroscopy Market, 2017-2030 (US$ Bn)
FIG. 42 Brazil Microfluidic modulation spectroscopy Market, 2017-2030 (US$ Bn)
FIG. 43 Mexico Microfluidic modulation spectroscopy Market, 2017-2030 (US$ Bn)
FIG. 44 Rest of Latin America Microfluidic modulation spectroscopy Market, 2017-2030 (US$ Bn)
FIG. 45 Middle East & Africa Microfluidic modulation spectroscopy Market, 2017-2030 (US$ Bn)
FIG. 46 GCC Countries Microfluidic modulation spectroscopy Market, 2017-2030 (US$ Bn)
FIG. 47 South Africa Microfluidic modulation spectroscopy Market, 2017-2030 (US$ Bn)
FIG. 48 Rest of Middle East and Africa Microfluidic modulation spectroscopy Market, 2017-2030 (US$ Bn)

List of Tables
TABLE 1 Market Snapshot: Global Microfluidic modulation spectroscopy Market
TABLE 2 Global Microfluidic modulation spectroscopy Market: Market Drivers Impact Analysis
TABLE 3 Global Microfluidic modulation spectroscopy Market: Market Restraints Impact Analysis
TABLE 4 Global Microfluidic modulation spectroscopy Market, by Competitive Benchmarking, 2022
TABLE 5 Global Microfluidic modulation spectroscopy Market, by Geographical Presence Analysis, 2022
TABLE 6 Global Microfluidic modulation spectroscopy Market, by Key Strategies Analysis, 2022
TABLE 7 Global Microfluidic modulation spectroscopy Market, by Research Laboratories, By Region, 2017-2022 (US$ Bn)
TABLE 8 Global Microfluidic modulation spectroscopy Market, by Research Laboratories, By Region, 2023-2030 (US$ Bn)
TABLE 9 Global Microfluidic modulation spectroscopy Market, by Chemical Industries, By Region, 2017-2022 (US$ Bn)
TABLE 10 Global Microfluidic modulation spectroscopy Market, by Chemical Industries, By Region, 2023-2030 (US$ Bn)
TABLE 11 Global Microfluidic modulation spectroscopy Market, by Academic Research Institutes, By Region, 2017-2022 (US$ Bn)
TABLE 12 Global Microfluidic modulation spectroscopy Market, by Academic Research Institutes, By Region, 2023-2030 (US$ Bn)
TABLE 13 Global Microfluidic modulation spectroscopy Market, by Contract Research Organizations, By Region, 2017-2022 (US$ Bn)
TABLE 14 Global Microfluidic modulation spectroscopy Market, by Contract Research Organizations, By Region, 2023-2030 (US$ Bn)
TABLE 15 Global Microfluidic modulation spectroscopy Market, by Biopharmaceutical Companies, By Region, 2017-2022 (US$ Bn)
TABLE 16 Global Microfluidic modulation spectroscopy Market, by Biopharmaceutical Companies, By Region, 2023-2030 (US$ Bn)
TABLE 17 Global Microfluidic modulation spectroscopy Market, by Others, By Region, 2017-2022 (US$ Bn)
TABLE 18 Global Microfluidic modulation spectroscopy Market, by Others, By Region, 2023-2030 (US$ Bn)
TABLE 19
TABLE 20 Global Microfluidic modulation spectroscopy Market, by Drug Designing, By Region, 2017-2022 (US$ Bn)
TABLE 21 Global Microfluidic modulation spectroscopy Market, by Drug Designing, By Region, 2023-2030 (US$ Bn)
TABLE 22 Global Microfluidic modulation spectroscopy Market, by Quality Assurance & Control, By Region, 2017-2022 (US$ Bn)
TABLE 23 Global Microfluidic modulation spectroscopy Market, by Quality Assurance & Control, By Region, 2023-2030 (US$ Bn)
TABLE 24 Global Microfluidic modulation spectroscopy Market, by Protein quantification, By Region, 2017-2022 (US$ Bn)
TABLE 25 Global Microfluidic modulation spectroscopy Market, by Protein quantification, By Region, 2023-2030 (US$ Bn)
TABLE 26 Global Microfluidic modulation spectroscopy Market, by Other, By Region, 2017-2022 (US$ Bn)
TABLE 27 Global Microfluidic modulation spectroscopy Market, by Other, By Region, 2023-2030 (US$ Bn)
TABLE 28 Global Microfluidic modulation spectroscopy Market, by End User, 2017-2022 (US$ Bn)
TABLE 29 Global Microfluidic modulation spectroscopy Market, by End User, 2023-2030 (US$ Bn)
TABLE 30 Global Microfluidic modulation spectroscopy Market, by Application, 2017-2022 (US$ Bn)
TABLE 31 Global Microfluidic modulation spectroscopy Market, by Application, 2023-2030 (US$ Bn)
TABLE 32 Global Microfluidic modulation spectroscopy Market, by Region, 2017-2022 (US$ Bn)
TABLE 33 Global Microfluidic modulation spectroscopy Market, by Region, 2023-2030 (US$ Bn)
TABLE 34 North America Microfluidic modulation spectroscopy Market, by End User, 2017-2022 (US$ Bn)
TABLE 35 North America Microfluidic modulation spectroscopy Market, by End User, 2023-2030 (US$ Bn)
TABLE 36 North America Microfluidic modulation spectroscopy Market, by Application, 2017-2022 (US$ Bn)
TABLE 37 North America Microfluidic modulation spectroscopy Market, by Application, 2023-2030 (US$ Bn)
TABLE 38 North America Microfluidic modulation spectroscopy Market, by Country, 2017-2022 (US$ Bn)
TABLE 39 North America Microfluidic modulation spectroscopy Market, by Country, 2023-2030 (US$ Bn)
TABLE 40 United States Microfluidic modulation spectroscopy Market, by End User, 2017-2022 (US$ Bn)
TABLE 41 United States Microfluidic modulation spectroscopy Market, by End User, 2023-2030 (US$ Bn)
TABLE 42 United States Microfluidic modulation spectroscopy Market, by Application, 2017-2022 (US$ Bn)
TABLE 43 United States Microfluidic modulation spectroscopy Market, by Application, 2023-2030 (US$ Bn)
TABLE 44 Canada Microfluidic modulation spectroscopy Market, by End User, 2017-2022 (US$ Bn)
TABLE 45 Canada Microfluidic modulation spectroscopy Market, by End User, 2023-2030 (US$ Bn)
TABLE 46 Canada Microfluidic modulation spectroscopy Market, by Application, 2017-2022 (US$ Bn)
TABLE 47 Canada Microfluidic modulation spectroscopy Market, by Application, 2023-2030 (US$ Bn)
TABLE 48 Mexico Microfluidic modulation spectroscopy Market, by End User, 2017-2022 (US$ Bn)
TABLE 49 Mexico Microfluidic modulation spectroscopy Market, by End User, 2023-2030 (US$ Bn)
TABLE 50 Mexico Microfluidic modulation spectroscopy Market, by Application, 2017-2022 (US$ Bn)
TABLE 51 Mexico Microfluidic modulation spectroscopy Market, by Application, 2023-2030 (US$ Bn)
TABLE 52 Europe Microfluidic modulation spectroscopy Market, by End User, 2017-2022 (US$ Bn)
TABLE 53 Europe Microfluidic modulation spectroscopy Market, by End User, 2023-2030 (US$ Bn)
TABLE 54 Europe Microfluidic modulation spectroscopy Market, by Application, 2017-2022 (US$ Bn)
TABLE 55 Europe Microfluidic modulation spectroscopy Market, by Application, 2023-2030 (US$ Bn)
TABLE 56 Europe Microfluidic modulation spectroscopy Market, by Country, 2017-2022 (US$ Bn)
TABLE 57 Europe Microfluidic modulation spectroscopy Market, by Country, 2023-2030 (US$ Bn)
TABLE 58 Germany Microfluidic modulation spectroscopy Market, by End User, 2017-2022 (US$ Bn)
TABLE 59 Germany Microfluidic modulation spectroscopy Market, by End User, 2023-2030 (US$ Bn)
TABLE 60 Germany Microfluidic modulation spectroscopy Market, by Application, 2017-2022 (US$ Bn)
TABLE 61 Germany Microfluidic modulation spectroscopy Market, by Application, 2023-2030 (US$ Bn)
TABLE 62 France Microfluidic modulation spectroscopy Market, by End User, 2017-2022 (US$ Bn)
TABLE 63 France Microfluidic modulation spectroscopy Market, by End User, 2023-2030 (US$ Bn)
TABLE 64 France Microfluidic modulation spectroscopy Market, by Application, 2017-2022 (US$ Bn)
TABLE 65 France Microfluidic modulation spectroscopy Market, by Application, 2023-2030 (US$ Bn)
TABLE 66 United Kingdom Microfluidic modulation spectroscopy Market, by End User, 2017-2022 (US$ Bn)
TABLE 67 United Kingdom Microfluidic modulation spectroscopy Market, by End User, 2023-2030 (US$ Bn)
TABLE 68 United Kingdom Microfluidic modulation spectroscopy Market, by Application, 2017-2022 (US$ Bn)
TABLE 69 United Kingdom Microfluidic modulation spectroscopy Market, by Application, 2023-2030 (US$ Bn)
TABLE 70 Italy Microfluidic modulation spectroscopy Market, by End User, 2017-2022 (US$ Bn)
TABLE 71 Italy Microfluidic modulation spectroscopy Market, by End User, 2023-2030 (US$ Bn)
TABLE 72 Italy Microfluidic modulation spectroscopy Market, by Application, 2017-2022 (US$ Bn)
TABLE 73 Italy Microfluidic modulation spectroscopy Market, by Application, 2023-2030 (US$ Bn)
TABLE 74 Spain Microfluidic modulation spectroscopy Market, by End User, 2017-2022 (US$ Bn)
TABLE 75 Spain Microfluidic modulation spectroscopy Market, by End User, 2023-2030 (US$ Bn)
TABLE 76 Spain Microfluidic modulation spectroscopy Market, by Application, 2017-2022 (US$ Bn)
TABLE 77 Spain Microfluidic modulation spectroscopy Market, by Application, 2023-2030 (US$ Bn)
TABLE 78 Rest of Europe Microfluidic modulation spectroscopy Market, by End User, 2017-2022 (US$ Bn)
TABLE 79 Rest of Europe Microfluidic modulation spectroscopy Market, by End User, 2023-2030 (US$ Bn)
TABLE 80 Rest of Europe Microfluidic modulation spectroscopy Market, by Application, 2017-2022 (US$ Bn)
TABLE 81 Rest of Europe Microfluidic modulation spectroscopy Market, by Application, 2023-2030 (US$ Bn)
TABLE 82 Asia Pacific Microfluidic modulation spectroscopy Market, by End User, 2017-2022 (US$ Bn)
TABLE 83 Asia Pacific Microfluidic modulation spectroscopy Market, by End User, 2023-2030 (US$ Bn)
TABLE 84 Asia Pacific Microfluidic modulation spectroscopy Market, by Application, 2017-2022 (US$ Bn)
TABLE 85 Asia Pacific Microfluidic modulation spectroscopy Market, by Application, 2023-2030 (US$ Bn)
TABLE 86 Asia Pacific Microfluidic modulation spectroscopy Market, by Country, 2017-2022 (US$ Bn)
TABLE 87 Asia Pacific Microfluidic modulation spectroscopy Market, by Country, 2023-2030 (US$ Bn)
TABLE 88 China Microfluidic modulation spectroscopy Market, by End User, 2017-2022 (US$ Bn)
TABLE 89 China Microfluidic modulation spectroscopy Market, by End User, 2023-2030 (US$ Bn)
TABLE 90 China Microfluidic modulation spectroscopy Market, by Application, 2017-2022 (US$ Bn)
TABLE 91 China Microfluidic modulation spectroscopy Market, by Application, 2023-2030 (US$ Bn)
TABLE 92 Japan Microfluidic modulation spectroscopy Market, by End User, 2017-2022 (US$ Bn)
TABLE 93 Japan Microfluidic modulation spectroscopy Market, by End User, 2023-2030 (US$ Bn)
TABLE 94 Japan Microfluidic modulation spectroscopy Market, by Application, 2017-2022 (US$ Bn)
TABLE 95 Japan Microfluidic modulation spectroscopy Market, by Application, 2023-2030 (US$ Bn)
TABLE 96 India Microfluidic modulation spectroscopy Market, by End User, 2017-2022 (US$ Bn)
TABLE 97 India Microfluidic modulation spectroscopy Market, by End User, 2023-2030 (US$ Bn)
TABLE 98 India Microfluidic modulation spectroscopy Market, by Application, 2017-2022 (US$ Bn)
TABLE 99 India Microfluidic modulation spectroscopy Market, by Application, 2023-2030 (US$ Bn)
TABLE 100 South Korea Microfluidic modulation spectroscopy Market, by End User, 2017-2022 (US$ Bn)
TABLE 101 South Korea Microfluidic modulation spectroscopy Market, by End User, 2023-2030 (US$ Bn)
TABLE 102 South Korea Microfluidic modulation spectroscopy Market, by Application, 2017-2022 (US$ Bn)
TABLE 103 South Korea Microfluidic modulation spectroscopy Market, by Application, 2023-2030 (US$ Bn)
TABLE 104 South-East Asia Microfluidic modulation spectroscopy Market, by End User, 2017-2022 (US$ Bn)
TABLE 105 South-East Asia Microfluidic modulation spectroscopy Market, by End User, 2023-2030 (US$ Bn)
TABLE 106 South-East Asia Microfluidic modulation spectroscopy Market, by Application, 2017-2022 (US$ Bn)
TABLE 107 South-East Asia Microfluidic modulation spectroscopy Market, by Application, 2023-2030 (US$ Bn)
TABLE 108 Rest of Asia Pacific Microfluidic modulation spectroscopy Market, by End User, 2017-2022 (US$ Bn)
TABLE 109 Rest of Asia Pacific Microfluidic modulation spectroscopy Market, by End User, 2023-2030 (US$ Bn)
TABLE 110 Rest of Asia Pacific Microfluidic modulation spectroscopy Market, by Application, 2017-2022 (US$ Bn)
TABLE 111 Rest of Asia Pacific Microfluidic modulation spectroscopy Market, by Application, 2023-2030 (US$ Bn)
TABLE 112 Latin America Microfluidic modulation spectroscopy Market, by End User, 2017-2022 (US$ Bn)
TABLE 113 Latin America Microfluidic modulation spectroscopy Market, by End User, 2023-2030 (US$ Bn)
TABLE 114 Latin America Microfluidic modulation spectroscopy Market, by Application, 2017-2022 (US$ Bn)
TABLE 115 Latin America Microfluidic modulation spectroscopy Market, by Application, 2023-2030 (US$ Bn)
TABLE 116 Latin America Microfluidic modulation spectroscopy Market, by Country, 2017-2022 (US$ Bn)
TABLE 117 Latin America Microfluidic modulation spectroscopy Market, by Country, 2023-2030 (US$ Bn)
TABLE 118 Brazil Microfluidic modulation spectroscopy Market, by End User, 2017-2022 (US$ Bn)
TABLE 119 Brazil Microfluidic modulation spectroscopy Market, by End User, 2023-2030 (US$ Bn)
TABLE 120 Brazil Microfluidic modulation spectroscopy Market, by Application, 2017-2022 (US$ Bn)
TABLE 121 Brazil Microfluidic modulation spectroscopy Market, by Application, 2023-2030 (US$ Bn)
TABLE 122 Argentina Microfluidic modulation spectroscopy Market, by End User, 2017-2022 (US$ Bn)
TABLE 123 Argentina Microfluidic modulation spectroscopy Market, by End User, 2023-2030 (US$ Bn)
TABLE 124 Argentina Microfluidic modulation spectroscopy Market, by Application, 2017-2022 (US$ Bn)
TABLE 125 Argentina Microfluidic modulation spectroscopy Market, by Application, 2023-2030 (US$ Bn)
TABLE 126 Rest of Latin America Microfluidic modulation spectroscopy Market, by End User, 2017-2022 (US$ Bn)
TABLE 127 Rest of Latin America Microfluidic modulation spectroscopy Market, by End User, 2023-2030 (US$ Bn)
TABLE 128 Rest of Latin America Microfluidic modulation spectroscopy Market, by Application, 2017-2022 (US$ Bn)
TABLE 129 Rest of Latin America Microfluidic modulation spectroscopy Market, by Application, 2023-2030 (US$ Bn)
TABLE 130 Middle East and Africa Microfluidic modulation spectroscopy Market, by End User, 2017-2022 (US$ Bn)
TABLE 131 Middle East and Africa Microfluidic modulation spectroscopy Market, by End User, 2023-2030 (US$ Bn)
TABLE 132 Middle East and Africa Microfluidic modulation spectroscopy Market, by Application, 2017-2022 (US$ Bn)
TABLE 133 Middle East and Africa Microfluidic modulation spectroscopy Market, by Application, 2023-2030 (US$ Bn)
TABLE 134 Middle East and Africa Microfluidic modulation spectroscopy Market, by Country, 2017-2022 (US$ Bn)
TABLE 135 Middle East and Africa Microfluidic modulation spectroscopy Market, by Country, 2023-2030 (US$ Bn)
TABLE 136 GCC Countries Microfluidic modulation spectroscopy Market, by End User, 2017-2022 (US$ Bn)
TABLE 137 GCC Countries Microfluidic modulation spectroscopy Market, by End User, 2023-2030 (US$ Bn)
TABLE 138 GCC Countries Microfluidic modulation spectroscopy Market, by Application, 2017-2022 (US$ Bn)
TABLE 139 GCC Countries Microfluidic modulation spectroscopy Market, by Application, 2023-2030 (US$ Bn)
TABLE 140 South Africa Microfluidic modulation spectroscopy Market, by End User, 2017-2022 (US$ Bn)
TABLE 141 South Africa Microfluidic modulation spectroscopy Market, by End User, 2023-2030 (US$ Bn)
TABLE 142 South Africa Microfluidic modulation spectroscopy Market, by Application, 2017-2022 (US$ Bn)
TABLE 143 South Africa Microfluidic modulation spectroscopy Market, by Application, 2023-2030 (US$ Bn)
TABLE 144 Rest of Middle East and Africa Microfluidic modulation spectroscopy Market, by End User, 2017-2022 (US$ Bn)
TABLE 145 Rest of Middle East and Africa Microfluidic modulation spectroscopy Market, by End User, 2023-2030 (US$ Bn)
TABLE 146 Rest of Middle East and Africa Microfluidic modulation spectroscopy Market, by Application, 2017-2022 (US$ Bn)
TABLE 147 Rest of Middle East and Africa Microfluidic modulation spectroscopy Market, by Application, 2023-2030 (US$ Bn)

Frequently Asked Questions:

What is the current size of the global microfluidic modulation spectroscopy market?

The global Microfluidic modulation spectroscopy market was valued at USD XX Billion in 2022.

What is the expected growth rate of the Microfluidic modulation spectroscopy market between 2023 and 2030?

The Microfluidic modulation spectroscopy market is expected to grow at a CAGR of 8.50% between 2023 and 2030, reaching USD XX Billion in 2030.

Which application segment is leading the market share in terms of product type?

Drug designing is the leading segment by application, holding around more than three-firth of the share in value in 2022.

Which end user governs the demand for Microfluidic modulation spectroscopy in the world?

Research Laboratories governs the demand for Microfluidic modulation spectroscopy worldwide, holding a massive share of nearly 35% in 2022.

Which segment is expected to post the highest CAGR during the forecast period?

Quality Assurance & Control is expected to post the highest CAGR during the forecast period.

Which region is fueling the growth of the Microfluidic modulation spectroscopy industry?

Europe is fueling the growth of the Microfluidic modulation spectroscopy industry, with nearly two-third share in 2022.

Who are the major players in the global Microfluidic modulation spectroscopy market?

The top players include RedShift BioAnalytics, Inc. . RedShift BioAnalytics, Inc., Spectradyne LLC, Insplorion AB, Fluidion SAS, Biolin Scientific AB and others.

What is the major market driver of the microfluidic modulation spectroscopy industry?

Enhanced sensitivity and selectivity compared to traditional spectroscopic techniques & potential for advancements in various fields, particularly in the biomedical and pharmaceutical industries are the major market drivers.

What are the major market restraints of the microfluidic modulation spectroscopy industry?

Developing and manufacturing microfluidic modulation spectroscopy systems can be costly, especially for customized or specialized applications are still restraints of the microfluidic modulation spectroscopy industry.

What are the major market opportunities of the microfluidic modulation spectroscopy industry?

Microfluidic modulation spectroscopy allows for precise and sensitive analysis of samples, enabling advancements in fields such as biotechnology, pharmaceuticals, environmental monitoring, and materials science are opportunities for the microfluidic modulation spectroscopy industry.

United States Human Papillomavirus Vaccines Market

Published:
Report ID: 36384

White Canes Market

Published:
Report ID: 36378

Cancer Profiling Market

Published:
Report ID: 36289

Flowable Hemostats Market

Published:
Report ID: 36279

Fibrin Sealants Market

Published:
Report ID: 36276

Prostate Cancer Market

Published:
Report ID: 36273

ECG Telemetry Devices Market

Published:
Report ID: 36237

Blotting Systems Market

Published:
Report ID: 36233

India Dental Consumables Market

Published:
Report ID: 36214

Biotechnology and Pharmaceutical Services Outsourcing Market

Published:
Report ID: 36191

India Bariatric Surgery Devices Market

Published:
Report ID: 36164

Veterinary Imaging Systems Market

Published:
Report ID: 36104

Purchase Options

$2999
Delivery Format: Excel.
$4999
Designed for the individual purchaser.
$6999
Users located at a single corporate site or regional office.
$7999
Allowed for unlimited sharing globally within one company.
Smallform of Sample request

Have a question?

User Profile

Don’t settle for less – trust Mitul to help you find the best solution.

Report delivery within 24 to 48 hours

– Other Info –

What people say?-

User Review

I am very impressed with the information in this report. The author clearly did their research when they came up with this product and it has already given me a lot of ideas.

Jana Schmidt
CEDAR CX Technologies

– Connect with us –

Phone

+91 6232 49 3207


support

24/7 Research Support


sales@credenceresearch.com

– Research Methodology –

Going beyond the basics: advanced techniques in research methodology

– Trusted By –

Pepshi, LG, Nestle
Motorola, Honeywell, Johnson and johnson
LG Chem, SIEMENS, Pfizer
Unilever, Samsonite, QIAGEN