CHAPTER NO. 1 : INTRODUCTION 19
1.1.1. Report Description 19
Purpose of the Report 19
USP & Key Offerings 19
1.1.2. Key Benefits for Stakeholders 19
1.1.3. Target Audience 20
1.1.4. Report Scope 20
CHAPTER NO. 2 : EXECUTIVE SUMMARY 21
2.1. Industrial Fasteners Market Snapshot 21
2.1.1. Middle East & Africa Industrial Fasteners Market, 2018 – 2032 (USD Million) 22
CHAPTER NO. 3 : GEOPOLITICAL CRISIS IMPACT ANALYSIS 23
3.1. Russia-Ukraine and Israel-Palestine War Impacts 23
CHAPTER NO. 4 : INDUSTRIAL FASTENERS MARKET – INDUSTRY ANALYSIS 24
4.1. Introduction 24
4.2. Market Drivers 25
4.2.1. Rising demand in the automotive and aerospace sectors 25
4.2.2. Growth in infrastructure and construction projects globally 26
4.3. Market Restraints 27
4.3.1. Fluctuations in raw material prices affecting manufacturing costs 27
4.4. Market Opportunities 28
4.4.1. Increasing adoption of lightweight and high-performance fasteners in industrial applications 28
4.5. Porter’s Five Forces Analysis 29
4.6. Buying Criteria 30
CHAPTER NO. 5 : IMPORT EXPORT ANALYSIS 31
5.1. Import Analysis by Middle East & Africa 31
5.1.1. Middle East & Africa Industrial Fasteners Market Import Volume/Revenue, By Middle East & Africa, 2018 – 2023 31
5.2. Export Analysis by Middle East & Africa 32
5.2.1. Middle East & Africa Industrial Fasteners Market Export Volume/Revenue, By Middle East & Africa, 2018 – 2023 32
CHAPTER NO. 6 : DEMAND SUPPLY ANALYSIS 33
6.1. Demand Analysis by Middle East & Africa 33
6.1.1. Middle East & Africa Industrial Fasteners Market Demand Volume/Revenue, By Middle East & Africa, 2018 – 2023 33
6.2. Supply Analysis by Middle East & Africa 34
6.2.1. Middle East & Africa Industrial Fasteners Market Supply Volume/Revenue, By Middle East & Africa, 2018 – 2023 34
CHAPTER NO. 7 : PRODUCTION ANALYSIS 35
7.1. Production Analysis by Middle East & Africa 35
7.1.1. Middle East & Africa Industrial Fasteners Market Production Volume/Revenue, By Middle East & Africa, 2018 – 2023 35
CHAPTER NO. 8 : PRICE ANALYSIS 36
8.1. Price Analysis by Type 36
8.1.1. Middle East & Africa Industrial Fasteners Market Price, By Type, 2018 – 2023 36
8.1.2. Middle East & Africa Type Market Price, By Type, 2018 – 2023 36
CHAPTER NO. 9 : RAW MATERIALS ANALYSIS 37
9.1. Key Raw Materials and Suppliers 37
9.2. Key Raw Materials Price Trend 37
CHAPTER NO. 10 : MANUFACTURING COST ANALYSIS 38
10.1. Manufacturing Cost Analysis 38
10.2. Manufacturing Process 38
CHAPTER NO. 11 : ANALYSIS COMPETITIVE LANDSCAPE 39
11.1. Company Market Share Analysis – 2023 39
11.2. Value Chain Analysis 39
11.2.1. Middle East & Africa Industrial Fasteners Market: Company Market Share, by Volume, 2023 40
11.2.2. Middle East & Africa Industrial Fasteners Market: Company Market Share, by Revenue, 2023 41
11.2.3. Middle East & Africa Industrial Fasteners Market: Top 6 Company Market Share, by Revenue, 2023 41
11.2.4. Middle East & Africa Industrial Fasteners Market: Top 3 Company Market Share, by Revenue, 2023 42
11.3. Middle East & Africa Industrial Fasteners Market Company Volume Market Share, 2023 43
11.4. Middle East & Africa Industrial Fasteners Market Company Revenue Market Share, 2023 44
11.5. Company Assessment Metrics, 2023 44
11.5.1. Stars 44
11.5.2. Emerging Leaders 44
11.5.3. Pervasive Players 44
11.5.4. Participants 44
11.6. Start-ups /SMEs Assessment Metrics, 2023 44
11.6.1. Progressive Companies 44
11.6.2. Responsive Companies 45
11.6.3. Dynamic Companies 45
11.6.4. Starting Blocks 45
11.7. Strategic Developments 46
11.7.1. Acquisitions & Mergers 46
New Product Launch 46
Middle East & Africa Expansion 46
11.8. Key Players Product Matrix 47
CHAPTER NO. 12 : PESTEL & ADJACENT MARKET ANALYSIS 48
12.1. PESTEL 48
12.1.1. Political Factors 48
12.1.2. Economic Factors 48
12.1.3. Social Factors 48
12.1.4. Technological Factors 48
12.1.5. Environmental Factors 48
12.1.6. Legal Factors 48
12.2. Adjacent Market Analysis 48
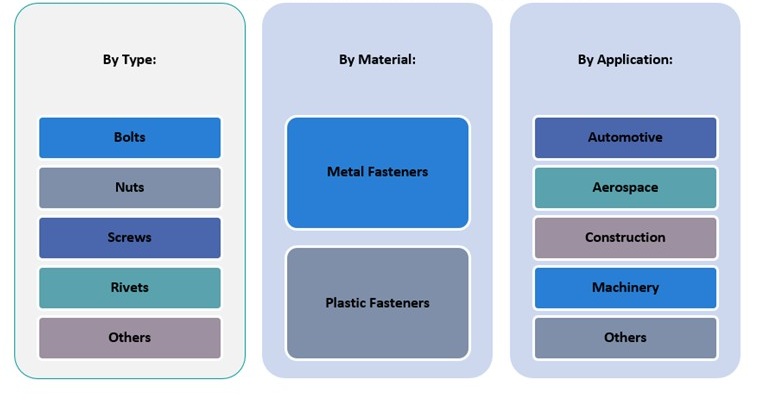
CHAPTER NO. 13 : INDUSTRIAL FASTENERS MARKET – BY TYPE SEGMENT ANALYSIS 49
13.1. Industrial Fasteners Market Overview, by Type Segment 49
13.1.1. Industrial Fasteners Market Revenue Share, By Type, 2023 & 2032 50
13.1.2. Industrial Fasteners Market Attractiveness Analysis, By Type 51
13.1.3. Incremental Revenue Growth Opportunity, by Type, 2024 – 2032 51
13.1.4. Industrial Fasteners Market Revenue, By Type, 2018, 2023, 2027 & 2032 52
13.2. Bolts 53
13.3. Nuts 54
13.4. Screws 55
13.5. Rivets 56
13.6. Others 57
CHAPTER NO. 14 : INDUSTRIAL FASTENERS MARKET – BY APPLICATION SEGMENT ANALYSIS 58
14.1. Industrial Fasteners Market Overview, by Application Segment 58
14.1.1. Industrial Fasteners Market Revenue Share, By Application, 2023 & 2032 59
14.1.2. Industrial Fasteners Market Attractiveness Analysis, By Application 60
14.1.3. Incremental Revenue Growth Opportunity, by Application, 2024 – 2032 60
14.1.4. Industrial Fasteners Market Revenue, By Application, 2018, 2023, 2027 & 2032 61
14.2. Automotive 62
14.3. Aerospace 63
14.4. Construction 64
14.5. Machinery 65
14.6. Others 66
CHAPTER NO. 15 : INDUSTRIAL FASTENERS MARKET – BY MATERIAL SEGMENT ANALYSIS 67
15.1. Industrial Fasteners Market Overview, by Material Segment 67
15.1.1. Industrial Fasteners Market Revenue Share, By Material, 2023 & 2032 68
15.1.2. Industrial Fasteners Market Attractiveness Analysis, By Material 69
15.1.3. Incremental Revenue Growth Opportunity, by Material, 2024 – 2032 69
15.1.4. Industrial Fasteners Market Revenue, By Material, 2018, 2023, 2027 & 2032 70
15.2. Metal Fasteners 71
15.3. Plastic Fasteners 72
CHAPTER NO. 16 : INDUSTRIAL FASTENERS MARKET – MIDDLE EAST & AFRICA ANALYSIS 73
16.1. Type 73
16.1.1. Middle East & Africa Industrial Fasteners Market Revenue, By Type, 2018 – 2023 (USD Million) 73
16.2. Middle East & Africa Industrial Fasteners Market Revenue, By Type, 2024 – 2032 (USD Million) 73
16.3. Application 74
16.3.1. Middle East & Africa Industrial Fasteners Market Revenue, By Application, 2018 – 2023 (USD Million) 74
16.3.2. Middle East & Africa Industrial Fasteners Market Revenue, By Application, 2024 – 2032 (USD Million) 74
16.4. Material 75
16.4.1. Middle East & Africa Industrial Fasteners Market Revenue, By Material, 2018 – 2023 (USD Million) 75
16.4.2. Middle East & Africa Industrial Fasteners Market Revenue, By Material, 2024 – 2032 (USD Million) 75
16.5. Saudi Arabia 75
16.6. United Arab Emirates (UAE) 75
16.7. South Africa 75
16.8. Egypt 75
16.9. Rest of Middle East & Africa 75
CHAPTER NO. 17 : COMPANY PROFILES 76
17.1. EJOT Middle East FZE 76
17.1.1. Company Overview 76
17.1.2. Product Portfolio 76
17.1.3. Swot Analysis 76
17.1.4. Business Strategy 77
17.1.5. Financial Overview 77
17.2. Fischer Fixings Middle East 78
17.3. Al Jazeera Bolts Industries LLC 78
17.4. Dubai Bolt and Screw Company LLC 78
17.5. Bolt Master Middle East 78
17.6. Fast Trade Est. 78
17.7. Al Maha Fasteners 78
17.8. Al-Rajhi Industrial Group 78
17.9. Petrofast Middle East LLC 78
17.10. Saudi Fasteners Company 78
List of Figures
FIG NO. 1. Middle East & Africa Industrial Fasteners Market Revenue, 2018 – 2032 (USD Million) 22
FIG NO. 2. Porter’s Five Forces Analysis for Middle East & Africa Industrial Fasteners Market 29
FIG NO. 3. Middle East & Africa Industrial Fasteners Market Import Volume/Revenue, By Middle East & Africa, 2018 – 2023 31
FIG NO. 4. Middle East & Africa Industrial Fasteners Market Export Volume/Revenue, By Middle East & Africa, 2018 – 2023 32
FIG NO. 5. Middle East & Africa Industrial Fasteners Market Demand Volume/Revenue, By Middle East & Africa, 2018 – 2023 33
FIG NO. 6. Middle East & Africa Industrial Fasteners Market Supply Volume/Revenue, By Middle East & Africa, 2018 – 2023 34
FIG NO. 7. Middle East & Africa Industrial Fasteners Market Production Volume/Revenue, By Middle East & Africa, 2018 – 2023 35
FIG NO. 8. Middle East & Africa Industrial Fasteners Market Price, By Type, 2018 – 2023 36
FIG NO. 9. Raw Materials Price Trend Analysis, 2018 – 2023 37
FIG NO. 10. Manufacturing Cost Analysis 38
FIG NO. 11. Manufacturing Process 38
FIG NO. 12. Value Chain Analysis for Middle East & Africa Industrial Fasteners Market 39
FIG NO. 13. Company Share Analysis, 2023 40
FIG NO. 14. Company Share Analysis, 2023 41
FIG NO. 15. Company Share Analysis, 2023 41
FIG NO. 16. Company Share Analysis, 2023 42
FIG NO. 17. Industrial Fasteners Market – Company Volume Market Share, 2023 43
FIG NO. 18. Industrial Fasteners Market – Company Revenue Market Share, 2023 44
FIG NO. 19. Industrial Fasteners Market Revenue Share, By Type, 2023 & 2032 50
FIG NO. 20. Market Attractiveness Analysis, By Type 51
FIG NO. 21. Incremental Revenue Growth Opportunity by Type, 2024 – 2032 51
FIG NO. 22. Industrial Fasteners Market Revenue, By Type, 2018, 2023, 2027 & 2032 52
FIG NO. 23. Middle East & Africa Industrial Fasteners Market for Bolts, Revenue (USD Million) 2018 – 2032 53
FIG NO. 24. Middle East & Africa Industrial Fasteners Market for Nuts, Revenue (USD Million) 2018 – 2032 54
FIG NO. 25. Middle East & Africa Industrial Fasteners Market for Screws, Revenue (USD Million) 2018 – 2032 55
FIG NO. 26. Middle East & Africa Industrial Fasteners Market for Rivets, Revenue (USD Million) 2018 – 2032 56
FIG NO. 27. Middle East & Africa Industrial Fasteners Market for Others, Revenue (USD Million) 2018 – 2032 57
FIG NO. 28. Industrial Fasteners Market Revenue Share, By Application, 2023 & 2032 59
FIG NO. 29. Market Attractiveness Analysis, By Application 60
FIG NO. 30. Incremental Revenue Growth Opportunity by Application, 2024 – 2032 60
FIG NO. 31. Industrial Fasteners Market Revenue, By Application, 2018, 2023, 2027 & 2032 61
FIG NO. 32. Middle East & Africa Industrial Fasteners Market for Automotive, Revenue (USD Million) 2018 – 2032 62
FIG NO. 33. Middle East & Africa Industrial Fasteners Market for Aerospace, Revenue (USD Million) 2018 – 2032 63
FIG NO. 34. Middle East & Africa Industrial Fasteners Market for Construction, Revenue (USD Million) 2018 – 2032 64
FIG NO. 35. Middle East & Africa Industrial Fasteners Market for Machinery, Revenue (USD Million) 2018 – 2032 65
FIG NO. 36. Middle East & Africa Industrial Fasteners Market for Others, Revenue (USD Million) 2018 – 2032 66
FIG NO. 37. Industrial Fasteners Market Revenue Share, By Material, 2023 & 2032 68
FIG NO. 38. Market Attractiveness Analysis, By Material 69
FIG NO. 39. Incremental Revenue Growth Opportunity by Material, 2024 – 2032 69
FIG NO. 40. Industrial Fasteners Market Revenue, By Material, 2018, 2023, 2027 & 2032 70
FIG NO. 41. Middle East & Africa Industrial Fasteners Market for Metal Fasteners, Revenue (USD Million) 2018 – 2032 71
FIG NO. 42. Middle East & Africa Industrial Fasteners Market for Plastic Fasteners, Revenue (USD Million) 2018 – 2032 72
List of Tables
TABLE NO. 1. : Middle East & Africa Industrial Fasteners Market: Snapshot 21
TABLE NO. 2. : Drivers for the Industrial Fasteners Market: Impact Analysis 25
TABLE NO. 3. : Restraints for the Industrial Fasteners Market: Impact Analysis 27
TABLE NO. 4. : Middle East & Africa Industrial Fasteners Market Revenue, By Type, 2018 – 2023 36
TABLE NO. 5. : Key Raw Materials & Suppliers 37
TABLE NO. 6. : Middle East & Africa Industrial Fasteners Market Revenue, By Type, 2018 – 2023 (USD Million) 73
TABLE NO. 7. : Middle East & Africa Industrial Fasteners Market Revenue, By Type, 2024 – 2032 (USD Million) 73
TABLE NO. 8. : Middle East & Africa Industrial Fasteners Market Revenue, By Application, 2018 – 2023 (USD Million) 74
TABLE NO. 9. : Middle East & Africa Industrial Fasteners Market Revenue, By Application, 2024 – 2032 (USD Million) 74
TABLE NO. 10. : Middle East & Africa Industrial Fasteners Market Revenue, By Material, 2018 – 2023 (USD Million) 75
TABLE NO. 11. : Middle East & Africa Industrial Fasteners Market Revenue, By Material, 2024 – 2032 (USD Million) 75