
Market Overview
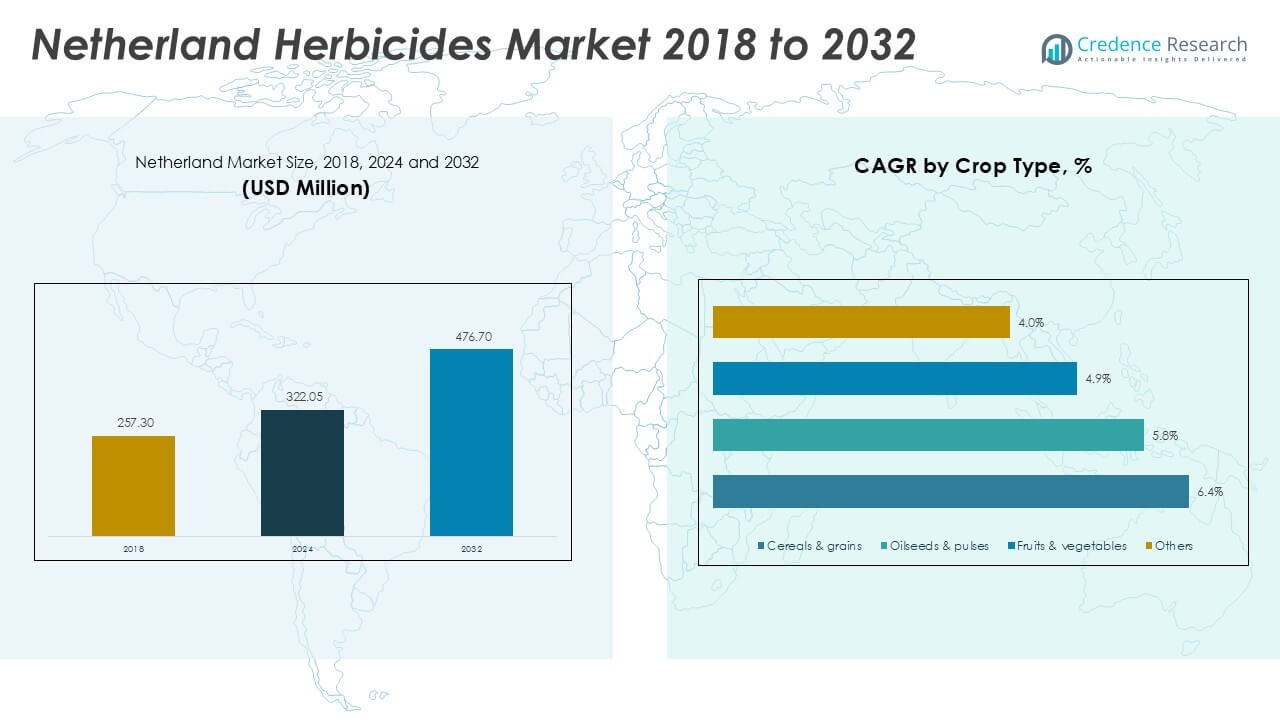
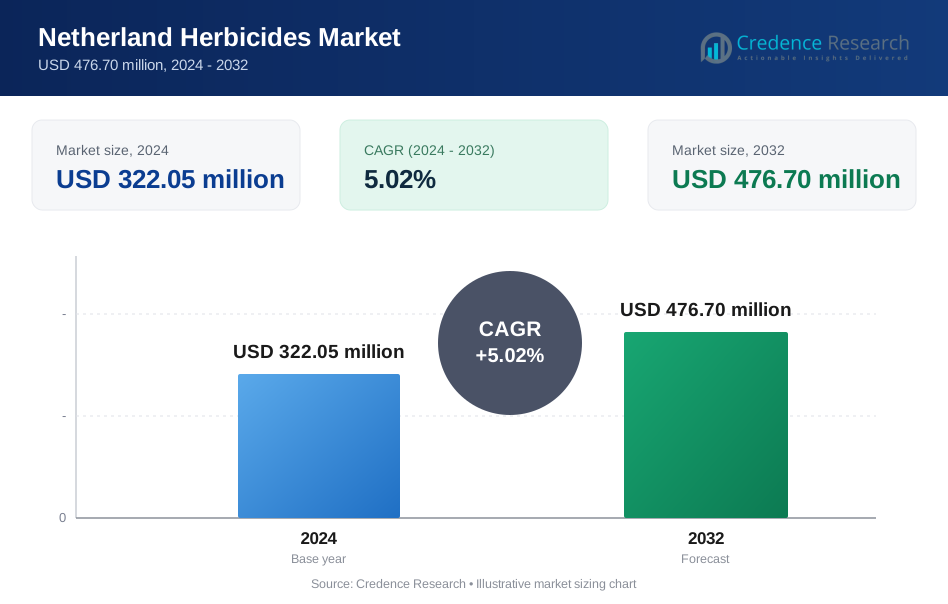
Netherland Herbicides market size was valued at USD 257.30 million in 2018, reaching USD 322.05 million in 2024, and is anticipated to hit USD 476.70 million by 2032, at a CAGR of 5.02% during the forecast period.
| REPORT ATTRIBUTE | DETAILS |
|---|---|
| Historical Period | 2020-2023 |
| Base Year | 2024 |
| Forecast Period | 2025-2032 |
| Netherland Herbicides Market Size 2024 | USD 322.05 Million |
| Netherland Herbicides Market, CAGR | 5.02% |
| Netherland Herbicides Market Size 2032 | USD 476.70 Million |
BASF SE, Bayer AG, Syngenta Group, and Corteva Agriscience are the top players in the Netherlands herbicides market, collectively holding a significant share through extensive product portfolios and strong distribution networks. BASF and Bayer lead with advanced glyphosate and selective herbicide solutions tailored for cereals and horticultural crops, while Syngenta and Corteva focus on resistance management and pre-emergence products. Regional analysis shows Eastern Netherlands dominating with 32% market share in 2024, driven by extensive cereal and grain cultivation. Western Netherlands follows with 28%, supported by high-value horticulture and greenhouse farming, while Northern and Southern regions each contribute around 20%.
Market Insights
- The Netherlands herbicides market was valued at USD 322.05 million in 2024 and is expected to reach USD 476.70 million by 2032, growing at a CAGR of 5.02% during the forecast period.
- Rising adoption of precision farming and government-backed crop protection programs are major drivers, boosting demand for glyphosate and selective herbicides across cereals, grains, and horticultural crops.
- Key trends include a shift toward bio-based herbicides and integration of digital spraying technologies, enabling efficient and sustainable weed management solutions for farmers.
- The market is moderately consolidated, with BASF SE, Bayer AG, Syngenta Group, and Corteva Agriscience leading through innovation, partnerships, and compliance with EU regulations.
- Eastern Netherlands dominates with 32% market share, followed by Western Netherlands with 28%, while cereals and grains hold the largest crop-type share at 45%, driving consistent herbicide consumption across large-scale farms.
Market Segmentation Analysis:
By Type
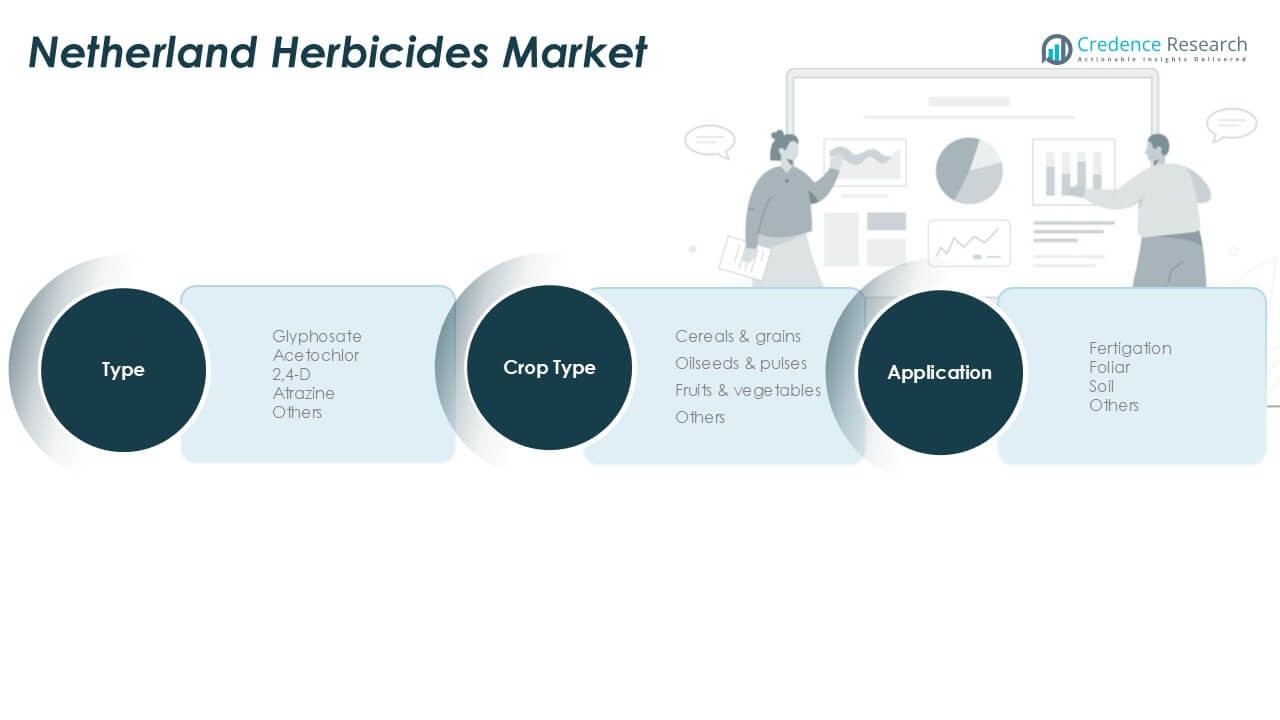
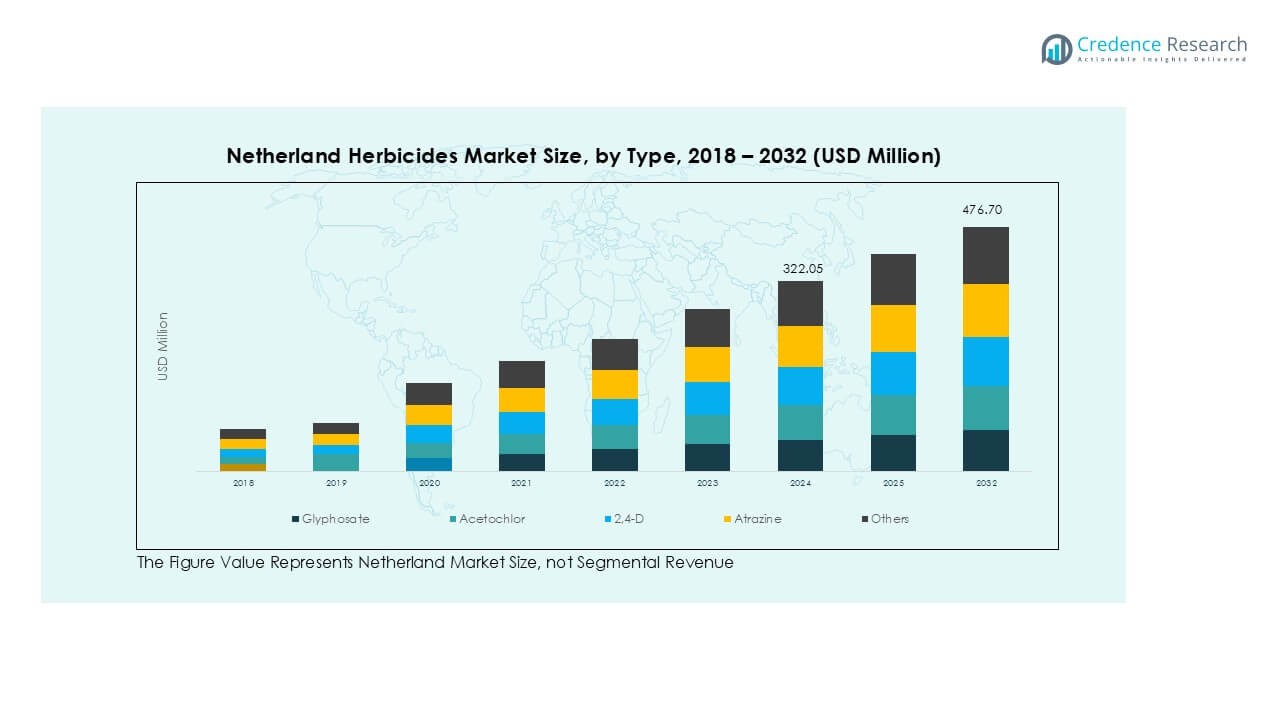
Glyphosate dominated the Netherlands herbicides market in 2024, accounting for over 35% of total share. Its popularity is driven by its broad-spectrum weed control, cost efficiency, and compatibility with no-till farming practices. Farmers use glyphosate extensively for pre-plant and post-harvest weed management in cereals, grains, and oilseeds, which improves crop yield and reduces labor costs. Acetochlor and 2,4-D follow, serving as key solutions for selective weed control in maize and pasturelands. Atrazine and other herbicides hold niche shares, mainly in specialty crop production and resistance management programs.
- For instance, BASF and Corteva products are used on thousands of hectares of Dutch maize farms to control broadleaf weeds and grasses effectively.
By Application
Foliar application led the market with nearly 50% share in 2024, favored for its precision and rapid action against weeds. This method enables targeted spraying, reducing chemical wastage and overall input costs for farmers. Adoption is supported by advancements in spray equipment that enhance coverage and minimize drift. Fertigation follows as a growing segment, particularly in greenhouse and horticultural operations, where it delivers controlled herbicide doses through irrigation systems. Soil application remains crucial for pre-emergence control, while other methods cater to specific, localized requirements in specialty crop fields and orchard management.
- For instance, Effective weed management, which can include foliar herbicide applications, is a key factor in boosting sugar beet yields, according to research from Wageningen University and others. However, the exact yield increase varies significantly depending on specific herbicide programs, environmental conditions, and weed populations.
By Crop Type
Cereals and grains represented the largest crop segment, capturing around 45% share in 2024. High cultivation area for wheat, barley, and corn in the Netherlands drives strong herbicide demand to secure yields and maintain quality standards. Glyphosate and acetochlor are key products used for broadleaf and grass weed control in this segment. Oilseeds and pulses follow, supported by the expansion of rapeseed cultivation and sustainable protein crop programs. Fruits and vegetables represent a steady market, relying on selective herbicides to protect high-value crops, while the “others” category includes ornamentals and niche crops requiring targeted solutions.
Key Growth Drivers
Rising Adoption of Modern Farming Practices
The Netherlands herbicides market is expanding as farmers adopt precision agriculture and mechanized farming techniques. Advanced spraying systems and GPS-guided equipment improve application efficiency and reduce chemical wastage. Farmers increasingly use herbicides for pre- and post-emergence weed control to maintain crop yields and minimize labor costs. The focus on sustainable farming practices supports the use of targeted herbicide formulations that lower environmental impact. This shift toward efficient, technology-driven agriculture strengthens demand for high-performance herbicides across cereals, grains, and horticultural crops.
- For instance, Wageningen University reports that more than 70% of Dutch arable farms now use precision guidance systems, cutting herbicide overlap by up to 15%.
Government Support for Crop Protection
Government initiatives promoting agricultural productivity are boosting herbicide adoption across the Netherlands. Subsidies for modern equipment and integrated weed management programs encourage farmers to invest in chemical control solutions. Regulatory frameworks supporting safe herbicide use provide clarity and confidence for growers. Public and private research collaborations also help develop low-residue, eco-friendly herbicides aligned with EU Green Deal goals. These measures collectively drive market growth by ensuring that farmers have access to safe, effective, and compliant herbicide products for diverse crop applications.
- For instance, the Dutch government channels part of its €5.5 billion CAP budget toward precision farming incentives, supporting adoption of low-drift sprayers and smart weed-control systems.
Expanding Cultivation of High-Value Crops
The growing area under cereals, grains, fruits, and vegetables is a key driver of herbicide demand. Dutch farmers focus on intensive crop production to meet domestic and export requirements, increasing the need for effective weed management solutions. Herbicides play a critical role in protecting high-value crops from yield losses and ensuring uniform growth. The horticultural sector, in particular, benefits from selective herbicide formulations that maintain crop quality. This expansion in cultivation area directly correlates with rising herbicide consumption across multiple farming systems.
Key Trends & Opportunities
Shift Toward Bio-Based Herbicides
There is a strong trend toward bio-based and low-toxicity herbicides that meet sustainability standards. Farmers are seeking alternatives to traditional chemical formulations to reduce soil and water contamination risks. This creates opportunities for manufacturers to develop bio-herbicides with competitive efficacy and cost profiles. Growing consumer demand for residue-free food also accelerates adoption. The Netherlands, with its focus on sustainable agriculture, offers a favorable market for such products, enabling companies to differentiate through innovation and compliance with EU regulatory goals.
- For instance, in 2023, the EU organic farming area grew to 17.7 million hectares. While the Netherlands contributed to this total, official figures from 2023 show its organic farmland was 80,360 hectares. This expansion of organic farming is a natural driver of demand for bio-herbicides.
Integration of Digital Agriculture Solutions
The integration of digital tools in weed management is transforming the herbicide market. Smart spraying technologies, AI-based weed detection, and data analytics help optimize herbicide dosage and timing. This trend supports cost savings, improved crop protection, and reduced environmental impact. Companies that offer digital platforms alongside herbicide products gain a competitive edge by providing complete weed management solutions. The rising adoption of precision farming across Dutch farms creates a major opportunity for technology-enabled herbicide applications.
- For example, Dutch farms using precision weed-mapping technologies report herbicide input reductions of up to 20% while maintaining yield levels.
Key Challenges
Stringent Regulatory Environment
Strict EU regulations on herbicide residues and chemical approvals pose a challenge for market participants. Several active ingredients face restrictions or phased bans, requiring companies to reformulate products or seek alternative chemistries. Compliance with Maximum Residue Limits (MRLs) increases R&D and registration costs for manufacturers. Delays in approval processes may slow the launch of new herbicides, limiting farmers’ options. These regulatory pressures create uncertainty in the market and demand constant investment in product innovation and compliance strategies.
Rising Weed Resistance Issues
The increasing incidence of herbicide-resistant weed species is a growing concern for Dutch farmers. Overreliance on glyphosate and other popular herbicides has led to reduced efficacy in some regions. This forces growers to rotate chemicals or use higher doses, increasing input costs and environmental risks. Manufacturers must invest in developing new modes of action and integrated weed management solutions. Failure to address resistance challenges can reduce herbicide adoption rates and negatively impact crop yields in the long term.
Regional Analysis
Eastern Netherlands
Eastern Netherlands held the largest share of the herbicides market, accounting for nearly 32% in 2024. The region’s dominance is supported by extensive cultivation of cereals, grains, and forage crops, which drives consistent herbicide demand for pre- and post-emergence weed control. Farmers in this area adopt precision farming tools and mechanized spraying systems to optimize herbicide use and improve yields. The presence of large-scale farms and research initiatives focused on sustainable agriculture further strengthens market growth. Increasing focus on integrated weed management programs enhances herbicide adoption and ensures balanced use of chemical and non-chemical control methods.
Western Netherlands
Western Netherlands captured around 28% market share in 2024, driven by its strong horticulture and greenhouse farming sector. The region is a major producer of high-value vegetables, flowers, and fruits, requiring selective herbicides to protect crops from weed competition without affecting quality. Fertigation-based herbicide application is popular here due to controlled irrigation systems. Adoption of bio-based herbicides is rising in response to sustainability targets and consumer demand for residue-free produce. Government support for eco-friendly farming practices and advanced irrigation infrastructure continues to encourage efficient herbicide use in this region’s intensive agricultural systems.
Northern Netherlands
Northern Netherlands accounted for approximately 20% of the herbicides market share in 2024. This region focuses on dairy farming and large-scale cultivation of maize, sugar beets, and potatoes, driving steady herbicide consumption. Farmers rely on glyphosate and acetochlor for effective broadleaf and grass weed management. The relatively cooler climate and shorter growing season make timely weed control critical to secure yields. Increased use of precision spraying technologies helps reduce wastage and comply with EU environmental guidelines. Ongoing research into weed resistance management in this region also supports herbicide adoption and promotes crop sustainability.
Southern Netherlands
Southern Netherlands represented about 20% of the market share in 2024, supported by a mix of arable farming, orchards, and horticultural crops. The region shows strong adoption of foliar and soil-applied herbicides to maintain productivity across diverse cropping patterns. Fruit and vegetable growers demand selective herbicides to ensure high-quality output for domestic and export markets. Rising investments in drip irrigation systems have expanded opportunities for fertigation-based applications. The region also benefits from farmer cooperatives promoting sustainable crop protection practices, driving the use of modern herbicides with lower environmental impact and improved efficiency across multiple crop segments.
Market Segmentations:
By Type
- Glyphosate
- Acetochlor
- 2,4-D
- Atrazine
- Others
By Application
- Fertigation
- Foliar
- Soil
- Others
By Crop Type
- Cereals & Grains
- Oilseeds & Pulses
- Fruits & Vegetables
- Others
By Geography
- Eastern Netherlands
- Western Netherlands
- Northen Netherlands
- Southern Netherlands
Competitive Landscape
The Netherlands herbicides market is moderately consolidated, with leading players including BASF SE, Bayer AG, Syngenta Group, Corteva Agriscience, and FMC Corporation holding significant shares. These companies focus on developing advanced herbicide formulations that comply with EU regulations and address growing concerns over weed resistance. BASF and Bayer lead with extensive product portfolios covering glyphosate, acetochlor, and selective herbicides for cereals and horticulture. Syngenta and Corteva emphasize innovation in pre- and post-emergence products supported by strong R&D investments. UPL Limited, Nufarm Ltd, and ADAMA Agricultural Solutions expand their presence through cost-effective generics and partnerships with local distributors. Companies actively invest in bio-based herbicides and precision application technologies to align with sustainability targets. Strategic collaborations, mergers, and product launches are key competitive strategies, while compliance with stringent residue limits and environmental standards remains a differentiating factor, shaping the competitive positioning of both global and regional players in the market.
Key Player Analysis
- BASF SE
- Bayer AG
- Syngenta Group
- Corteva Agriscience
- Nufarm Ltd
- ADAMA Agricultural Solutions Ltd.
- FMC Corporation
- UPL Limited
- Sumitomo Chemical Co. Ltd
- Belchim Crop Protection
Recent Developments
- In December 2023, ADAMA introduced its most advanced cross-spectrum herbicide called Kampai for the grain business. The new product provides the broadest application window for broadleaf and narrow-leaf weed control for cereal crops.
- In September 2023, American Water Chemicals (AWC) announced the launch of its European division, named Amaya Solutions Europe, SL. This strategic move marks a significant milestone in AWC's global expansion efforts, aimed at enhancing its presence in the European market.
- In July 2023, ADAMA introduced new products, Davai A Plus and Clearfield Broad-Spectrum Herbicide Solutions, for imidazolinone-tolerant legumes like lentils, peas, and soybeans.
- In March 2023, BASF announced the launch of a novel corn herbicide named Surtain, which is set to be available for use in the United States in 2024. This innovative herbicide features solid encapsulation technology, marking it as the first of its kind in the industry.
- In January 2023, Bayer formed a new partnership with Oerth Bio to enhance crop protection technology and create more eco-friendly crop protection solutions.
Report Coverage
The research report offers an in-depth analysis based on Type, Application, Crop Type and Geography. It details leading market players, providing an overview of their business, product offerings, investments, revenue streams, and key applications. Additionally, the report includes insights into the competitive environment, SWOT analysis, current market trends, as well as the primary drivers and constraints. Furthermore, it discusses various factors that have driven market expansion in recent years. The report also explores market dynamics, regulatory scenarios, and technological advancements that are shaping the industry. It assesses the impact of external factors and global economic changes on market growth. Lastly, it provides strategic recommendations for new entrants and established companies to navigate the complexities of the market.
Future Outlook
- The market will witness steady growth driven by rising demand for high-yield crops.
- Adoption of bio-based and eco-friendly herbicides will expand due to sustainability goals.
- Precision farming and smart spraying technologies will improve herbicide efficiency and reduce waste.
- Increased R&D investments will lead to development of low-residue and resistance-management solutions.
- Government regulations will continue shaping product approvals and promoting safer formulations.
- Demand for selective herbicides will rise in horticulture and greenhouse farming segments.
- Integrated weed management practices will gain traction across large-scale farms.
- Strategic partnerships and mergers among key players will enhance market reach.
- Rising weed resistance will drive innovation in new modes of action.
- Eastern Netherlands will remain the leading region, supported by strong cereal and grain production.
Request a Free Sample
Fill in your details and we'll send you a free sample report.
- Sample data tables & charts
- Research methodology
Need a Custom Version of This Report?
Tailor the scope, geography, or segments to your exact requirements.
- Custom geography or segment scope
- Direct access to our analyst team
Frequently Asked Questions
What is the current market size for Netherland Herbicides market, and what is its projected size in 2032?
At what Compound Annual Growth Rate is the Netherland Herbicides market projected to grow between 2025 and 2032?
Which Netherland Herbicides market segment held the largest share in 2024?
What are the primary factors fueling the growth of the Netherland Herbicides market?
Who are the leading companies in the Netherland Herbicides market?
Which region commanded the largest share of the Netherland Herbicides market in 2024?
Table of Content
Chapter 1. Report Introduction
- 1.1 Report Description & Purpose
- 1.1.1 Report Title & Market Definition
- 1.1.2 Unique Selling Propositions (USP) & Key Differentiators
- 1.1.3 Value Proposition for Stakeholders
- 1.2 Research Objectives
- 1.2.1 Market Sizing Objectives (Volume & Revenue)
- 1.2.2 Segmentation Objectives
- 1.2.3 Competitive Intelligence Objectives
- 1.2.4 Forecast & Scenario Objectives
- 1.3 Report Scope
- 1.3.1 Netherland Herbicides Scope – Types & Subtypes Covered
- 1.3.2 Geographic Scope – Regions & Countries Covered
- 1.3.3 Historical Period, Base Year & Forecast Period (2024; forecast to 2032)
- 1.3.4 Inclusions & Exclusions
- 1.4 HS Code & Classification Framework
- 1.5 Currency, Units & Pricing Basis
- 1.6 Target Stakeholders
- 1.7 Limitations & Assumptions
Chapter 2. Executive Summary
- 2.1 Global Netherland Herbicides Market Snapshot
- 2.1.1 Market Size – Historical (2024) & Forecast (2024-2032) (2024: USD 322.05 million → 2032: USD 476.70 million)
- 2.1.2 Volume & Revenue – Global Totals
- 2.1.3 Key Market Highlights – Top Five Facts
- 2.2 Netherland Herbicides Market Segmentation Snapshot
- 2.2.1 Market Split by Region – 2024 vs. 2032
- 2.3 Competitive Snapshot
- 2.3.1 Top 10 Players by Revenue Share – 2024
- 2.3.2 Top 10 Players by Volume Share – 2024
- 2.3.3 Recent Strategic Developments (18-Month Summary)
- 2.4 Key Investment Highlights & Strategic Conclusions
Chapter 3. Netherland Herbicides Market Dynamics & Industry Analysis
- 3.1 Market Overview & Context
- 3.1.1 Netherland Herbicides Market Position in the Broader Automotive Value Chain
- 3.1.2 OEM vs. Replacement Market Dynamics
- 3.1.3 Market Maturity & Development Stage by Region
- 3.2 Netherland Herbicides Market Drivers
- 3.3 Netherland Herbicides Market Restraints & Challenges
- 3.4 Netherland Herbicides Market Opportunities
- 3.5 Porter's Five Forces Analysis
- 3.5.1 Threat of New Entrants
- 3.5.2 Bargaining Power of Suppliers
- 3.5.3 Bargaining Power of Buyers
- 3.5.4 Threat of Substitutes
- 3.5.5 Competitive Rivalry – Intensity Assessment
- 3.6 Netherland Herbicides Value Chain Analysis
- 3.6.1 Upstream – Raw Material/Input Suppliers
- 3.6.1.1 Raw Material/Input 1
- 3.6.1.2 Raw Material/Input 2
- 3.6.1.3 Raw Material/Input 3
- 3.6.2 Midstream – Production/Manufacturing/Service Delivery
- 3.6.2.1 Production/Process Overview
- 3.6.2.2 Key Facility Locations & Capacity by Manufacturer
- 3.6.3 Downstream – Distribution & End Consumer
- 3.6.3.1 Primary Channel – B2B/OEM
- 3.6.3.2 Secondary Channels – Dealer, Retail, Online, Direct
- 3.6.4 Value Chain Profitability Analysis
- 3.6.1 Upstream – Raw Material/Input Suppliers
- 3.7 PESTEL Analysis
- 3.7.1 Political Factors
- 3.7.2 Economic Factors
- 3.7.3 Social Factors
- 3.7.4 Technological Factors
- 3.7.5 Environmental Factors
- 3.7.6 Legal Factors
- 3.8 Netherland Herbicides Supply Chain Analysis
- 3.8.1 Raw Material/Input Supply Risk Assessment
- 3.8.2 Manufacturing Concentration Risk (Geographic Exposure)
- 3.8.3 Trade Disruption Impact Analysis
- 3.9 Regulatory & Policy Landscape
Note: The regulatory and policy landscape section covers regulations based on their applicability to the market, Netherland Herbicides category, geography, and scope of the study. Only regulatory frameworks with a material impact on operations, compliance, trade, sustainability, or market access are analyzed in detail.
Chapter 4. Key Investment Pockets & Opportunity Analysis
- 4.1 Netherland Herbicides Market Attractiveness Analysis
- 4.1.1 By Region – Investment Attractiveness Matrix (Volume × CAGR)
- 4.2 Absolute Revenue Growth Opportunity
- 4.2.1 By Region – Absolute USD Growth Through 2032
- 4.3 Incremental Volume Opportunity
- 4.3.1 By Region – Incremental Volume Through 2032
- 4.3.2 Segment – Incremental Volume
- 4.4 Emerging Submarket Opportunity Deep Dive (Subject to Applicability)
- 4.5 Emerging Market Opportunity Scorecards
- 4.5.1 United States
- 4.5.2 Europe
- 4.5.3 Asia
- 4.5.4 Middle East & Africa
Note: Emerging Market Opportunity Scorecards will be included based on relevance and strategic importance. Regions listed are indicative and may vary depending on data availability and market dynamics.
Chapter 5. Netherland Herbicides Import-Export Analysis & Trade Flows
- 5.1 Global Trade Overview
- 5.1.1 Global Export Value by Country (2024)
- 5.1.2 Global Export Volume by Country (2024)
- 5.1.3 Global Import Value by Country (2024)
- 5.1.4 Global Import Volume by Country (2024)
- 5.1.5 Net Trade Balance by Country (2024)
- 5.2 Export Analysis – Segment
- 5.2.1 Type 1 (HS Code)
- 5.2.2 Type 2 (HS Code)
- 5.2.3 Type 3 (HS Code)
- 5.2.4 Type 4 (HS Code)
- 5.2.5 Type 5 (HS Code)
- 5.3 Import Analysis – Segment
- 5.3.1 Type 1 (HS Code)
- 5.3.2 Type 2 (HS Code)
- 5.3.3 Type 3 (HS Code)
- 5.3.4 Type 4 (HS Code)
- 5.3.5 Type 5 (HS Code)
- 5.4 Average Unit Trade Prices
- 5.4.1 Average Export Price – Segment & Country
- 5.4.2 Average Import Price – Segment & Source Country
- 5.4.3 Price Trends (2024)
- 5.5 Key Trade Route Analysis
- 5.5.1 Trade Route 1
- 5.5.2 Trade Route 2
- 5.5.3 Trade Route 3
- 5.5.4 Trade Route 4
- 5.5.5 Trade Route 5
- 5.6 Trade Policy Impact Assessment
- 5.6.1 US Anti-Dumping & Section 301 Tariffs
- 5.6.2 EU Customs Union Impact
- 5.6.3 Major Free Trade Agreements
- 5.6.4 USMCA Rules of Origin
Note: Trade policy analysis will be included only where relevant to the Netherland Herbicides market.
Chapter 6. Competitive Landscape & Company Benchmarking
- 6.1 Netherland Herbicides Market Concentration & Structure
- 6.1.1 Herfindahl-Hirschman Index (HHI) – vs. 2024
- 6.1.2 Tier 1, Tier 2 & Tier 3 Market Structure
- 6.1.3 Global, Regional & Local Player Dynamics
- 6.2 Netherland Herbicides Market Share Analysis – 2024
- 6.2.1 Global Revenue Share by Company
- 6.2.2 Global Volume Share by Company
- 6.2.3 Regional Revenue Share
- 6.2.4 Market Share Evolution ( vs. 2024)
- 6.2.5 OEM Segment Share by Company
- 6.2.6 Replacement Segment Share by Company
- 6.3 Production/Delivery Capacity & Facility Analysis
- 6.3.1 Global Installed Capacity
- 6.3.2 Capacity Utilization Rates
- 6.3.3 Production/Output Volume
- 6.3.4 Facility Locations & Capacity Map
- 6.3.5 Planned Capacity Additions
- 6.4 Netherland Herbicides Competitive Benchmarking Matrix
- 6.4.1 Revenue, Volume, CAGR & Profitability Comparison
- 6.4.2 Channel Revenue Mix
- 6.4.3 Geographic Revenue Exposure
- 6.4.4 R&D Intensity
- 6.4.5 Sustainability Maturity
- 6.5 Strategic Developments in Netherland Herbicides (Last 24 Months)
- 6.5.1 Mergers, Acquisitions & Divestments
- 6.5.2 New Netherland Herbicides Launches
- 6.5.3 Facility Expansions
- 6.5.4 Strategic Alliances, Joint Ventures & Partnerships
- 6.5.5 Distribution Expansion & Market Entry
- 6.5.6 Sustainability & ESG Initiatives
- 6.6 Competitive Strategy Mapping
- 6.6.1 Leader, Challenger, Follower & Niche Classification
- 6.6.2 Pricing Strategy Comparison
- 6.6.3 Channel Strategy Matrix
Note: Strategic developments are included based on their materiality and the availability of reliable information.
Chapter 7. Global Netherland Herbicides Market – By Distribution Channel
- 7.1 Segment Overview
- 7.1.1 Volume & Revenue Split by Channel (2024 & 2032)
- 7.1.2 Channel Mix Evolution (2024-2032)
Chapter 8. Regional Market Analysis – Global Overview
- 8.1 Global Regional Overview
- 8.1.1 Regional Volume Share
- 8.1.2 Regional Revenue Share
- 8.1.3 Regional Volume by Region
- 8.1.4 Regional Revenue by Region
- 8.1.5 Regional Forecast Through 2032
- 8.2 Cross-Regional Segment Analysis
- 8.2.1 By Distribution Channel
- 8.2.2 By Brand/Price Tier
Chapter 9. North America Netherland Herbicides Market
- 9.1 United States
- 9.2 Canada
- 9.3 Mexico
Chapter 10. Europe Netherland Herbicides Market
- 10.1 Germany
- 10.2 France
- 10.3 Italy
- 10.4 United Kingdom
- 10.5 Spain
- 10.6 Poland
- 10.7 Russia
- 10.8 Netherlands
- 10.9 Belgium
- 10.10 Sweden
- 10.11 Denmark
- 10.12 Norway
- 10.13 Rest of Europe
Chapter 11. Asia Pacific Netherland Herbicides Market
- 11.1 China
- 11.2 India
- 11.3 Japan
- 11.4 South Korea
- 11.5 Thailand
- 11.6 Indonesia
- 11.7 Vietnam
- 11.8 Malaysia
- 11.9 Australia
- 11.10 Rest of Asia Pacific
Chapter 12. Latin America Netherland Herbicides Market
- 12.1 Brazil
- 12.2 Argentina
- 12.3 Colombia
- 12.4 Chile
- 12.5 Rest of Latin America
Chapter 13. Middle East Netherland Herbicides Market
- 13.1 Saudi Arabia
- 13.2 United Arab Emirates
- 13.3 Turkey
- 13.4 Israel
- 13.5 Iran
- 13.6 Rest of the Middle East
Chapter 14. Africa Netherland Herbicides Market
- 14.1 South Africa
- 14.2 Egypt
- 14.3 Nigeria
- 14.4 Morocco
- 14.5 Rest of Africa
Chapter 15. Netherland Herbicides Company Profiles
- 15.1 [Company 01]
- 15.1.1 Company Overview
- 15.1.2 Key Management Personnel
- 15.1.3 Products & Services Portfolio
- 15.1.4 Financial Performance
- 15.1.5 Key Market Focus & Geographic Presence
- 15.1.6 Recent Developments & Strategic Initiatives
Note: The company profile list is preliminary and may change based on research findings, market developments, data availability, and client requirements.
Chapter 16. Appendices
- Appendix A – List of Abbreviations & Acronyms
- Appendix B – Industry Classification Code Reference – Full Series
- Appendix C – Production & Capacity Data Tables
- Appendix D – End-Use & Demand Base Tables
- Appendix E – Consumption & Replacement Rate Assumptions
- Appendix F – ASP Reference Tables
- Appendix G – Manufacturing & Facility Database
- Appendix H – Import-Export Data Tables
- Appendix I – Regulatory Summary Tables
- Appendix J – Primary Research Participant List (Anonymized)
- Appendix K – Primary Research Questionnaire Framework
- Appendix L – Data Sources & Bibliography
- Appendix M – Market Size Divergence & Source Comparison
Chapter 17. Research Methodology
- 17.1 Research Framework & Philosophy
- 17.2 Secondary Research – Sources, Hierarchy & Data Extraction
- 17.3 Data Modeling – Bottom-Up & Top-Down Market Sizing
- 17.4 Primary Research – Stakeholder Framework, LOI & Sample Sizes
- 17.5 Forecast Methodology – Regression, Scenario & Sensitivity Analysis
- 17.6 Quality Control – Four-Layer Validation Framework
- 17.7 Limitations & Standard Assumptions
- 17.8 Disclaimer
