Market Overview
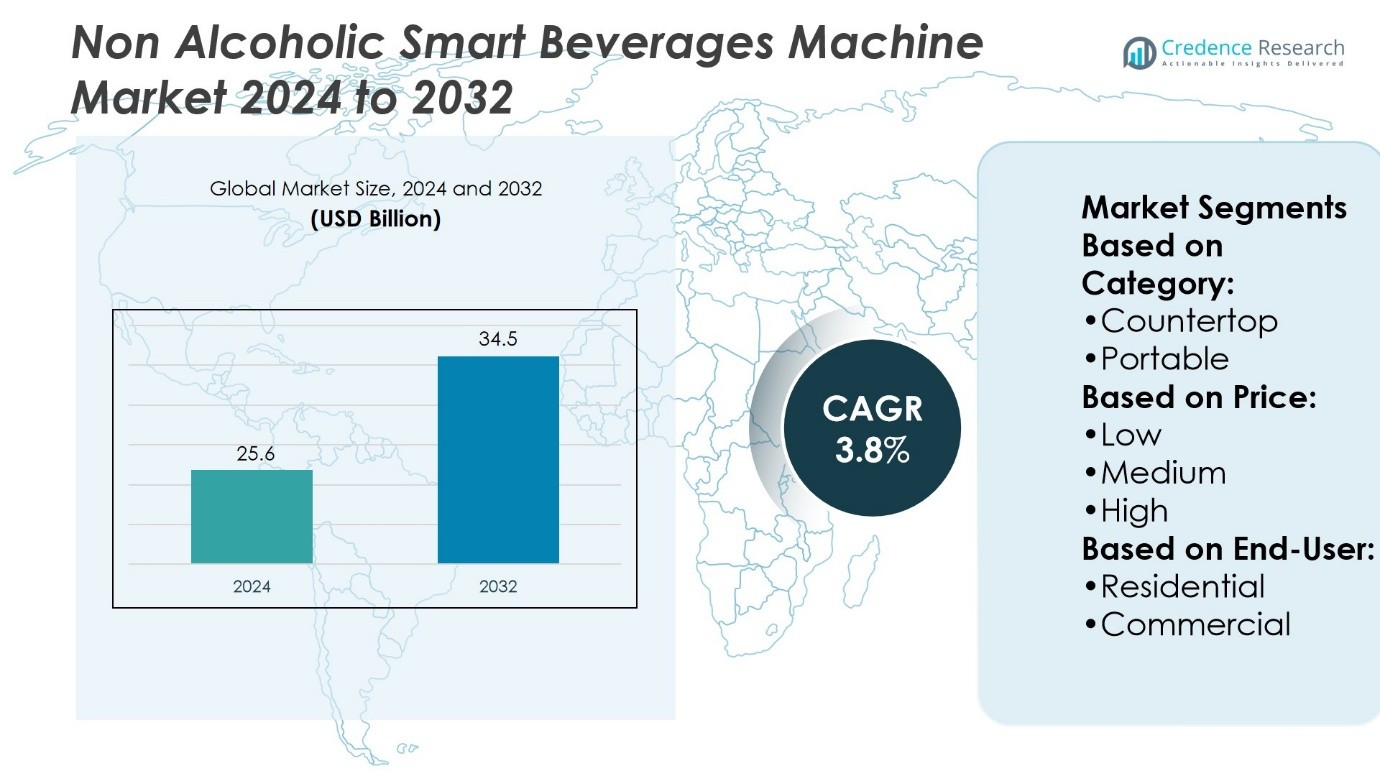
Non-Alcoholic Smart Beverages Machine Market size was valued at USD 25.6 billion in 2024 and is anticipated to reach USD 34.5 billion by 2032, at a CAGR of 3.8% during the forecast period.
| REPORT ATTRIBUTE |
DETAILS |
| Historical Period |
2020-2023 |
| Base Year |
2024 |
| Forecast Period |
2025-2032 |
| Non-Alcoholic Smart Beverages Machine Market Size 2024 |
USD 25.6 Billion |
| Non-Alcoholic Smart Beverages Machine Market, CAGR |
3.8% |
| Non-Alcoholic Smart Beverages Machine Market Size 2032 |
USD 34.5 Billion |
The Non-Alcoholic Smart Beverages Machine Market grows due to rising health awareness, demand for convenience, and preference for customizable beverage options. It benefits from advanced features such as AI-driven personalization, IoT connectivity, and touchless dispensing, which improve user experience and operational efficiency. Sustainability-focused designs using energy-efficient systems and recyclable components also drive adoption. Key trends highlight expanding use in residential, commercial, and hospitality spaces, along with growing presence in non-traditional venues like offices, gyms, and retail outlets. The combination of health-centric demand and technology integration positions the market for strong and sustained global growth.
The Non-Alcoholic Smart Beverages Machine Market shows strong geographical presence, with North America leading in adoption, Europe focusing on sustainability, and Asia-Pacific emerging as the fastest-growing region. Latin America and the Middle East & Africa record steady expansion supported by hospitality and urban demand. It features competition among global and regional manufacturers offering innovative, connected, and eco-friendly machines. Key players strengthen their market position through technology integration, product differentiation, and partnerships across commercial, residential, and hospitality sectors.
Access crucial information at unmatched prices!
Request your sample report today & start making informed decisions powered by Credence Research Inc.!
Download Sample
Market Insights
- The Non-Alcoholic Smart Beverages Machine Market was valued at USD 25.6 billion in 2024 and is projected to reach USD 34.5 billion by 2032, growing at a CAGR of 3.8%.
- Rising health awareness, demand for convenience, and preference for customizable beverages drive strong market growth.
- Advanced features such as AI-driven personalization, IoT connectivity, and touchless dispensing enhance user experience and efficiency.
- High upfront costs, maintenance requirements, and limited awareness in certain regions restrain wider adoption.
- North America leads the market, Europe focuses on sustainability, and Asia-Pacific emerges as the fastest-growing region.
- Intense competition among global and regional players pushes innovation, product differentiation, and sustainability-focused designs.
- Expanding applications in residential, commercial, hospitality, and non-traditional spaces such as offices, gyms, and retail outlets create new growth opportunities.
Market Drivers
Rising Demand for Health-Oriented and Convenient Beverage Options
The Non-Alcoholic Smart Beverages Machine Market grows due to rising consumer preference for healthier drink alternatives. Smart dispensers provide sugar-free, low-calorie, and functional drinks that align with wellness trends. It supports quick preparation of customized beverages, offering both convenience and variety. Consumers prioritize machines that allow personalization of flavors and ingredients. Demand for home use and commercial settings continues to expand with lifestyle changes. Strong health awareness acts as a core factor driving market adoption.
- For instance, PepsiCo’s SodaStream platform dispensed over 5 billion liters of sparkling water globally in 2022, helping reduce single-use plastic bottles while supporting customizable, health-oriented beverage options.
Advancements in Connected Technologies and Smart Features
Smart technologies accelerate growth in the Non-Alcoholic Smart Beverages Machine Market by enabling real-time control and monitoring. Wi-Fi and app-based interfaces allow users to select, customize, and track beverage intake easily. It enhances user experience by integrating AI for predictive recommendations. Energy efficiency and automatic cleaning functions strengthen appeal across residential and professional use. These features reduce maintenance time and increase product longevity. Market leaders focus on expanding connected ecosystems to ensure stronger consumer engagement.
- For instance, Coca-Cola’s Freestyle machines, deployed in more than 50,000 locations worldwide, allow real-time data monitoring and customization of beverage combinations, processing approximately 20 million pours daily.
Expanding Commercial Applications Across Hospitality and Retail
The Non-Alcoholic Smart Beverages Machine Market benefits from high adoption in hotels, restaurants, gyms, and corporate offices. Businesses seek machines that deliver consistent quality and faster service. It improves operational efficiency while lowering dependency on manual preparation. Retail chains use smart machines to offer customers premium self-serve beverage experiences. Gyms and wellness centers integrate them to promote healthy hydration choices. Growing commercial demand contributes significantly to overall market penetration.
Focus on Sustainability and Energy-Efficient Product Development
Sustainability drives investment in the Non-Alcoholic Smart Beverages Machine Market with emphasis on energy-efficient and eco-friendly designs. Manufacturers develop machines with recyclable materials and reduced carbon footprints. It supports alignment with global environmental standards and customer expectations. Water-saving technology and reusable packaging integration strengthen long-term adoption. Consumers favor brands committed to sustainable manufacturing practices. The emphasis on environmental responsibility positions smart beverage machines as future-ready solutions.
Market Trends
Integration of Artificial Intelligence and Personalization in Beverage Selection
The Non-Alcoholic Smart Beverages Machine Market shows a clear trend toward AI-driven personalization. Machines now analyze user preferences and suggest customized drinks based on past choices. It enables greater consumer engagement by offering data-backed recommendations. Smart sensors track nutritional content, allowing users to manage sugar and calorie intake. This trend aligns with consumer demand for healthier and more tailored options. Personalization strengthens brand loyalty and enhances machine adoption across multiple settings.
- For instance, advanced Mr. Coffee models may include features like a brew strength selector and a built-in water filtration system for a more consistent flavor. Personalization of settings strengthens brand loyalty and enhances machine adoption across multiple settings.
Expansion of Touchless and Contact-Free Dispensing Solutions
Hygiene awareness drives innovation in the Non-Alcoholic Smart Beverages Machine Market, with emphasis on touchless technology. Voice commands, mobile applications, and gesture-based systems replace traditional push buttons. It reduces the risk of contamination and improves safety in shared environments. Businesses adopt these machines to meet higher health standards in workplaces, gyms, and restaurants. The touchless trend also appeals to consumers seeking seamless, modern experiences. Manufacturers focus on creating user-friendly, contact-free models to meet rising expectations.
- For instance, the Hamilton Beach FlexBrew Single-Serve system offers multiple brew-size options, such as using K-Cup pods or ground coffee, along with brew-strength selection. This personalization, which caters to individual preferences, helps strengthen brand loyalty.
Growing Role of Sustainability and Eco-Friendly Beverage Dispensing
Sustainable design stands out as a major trend in the Non-Alcoholic Smart Beverages Machine Market. Machines with energy-efficient systems, recyclable components, and water-saving features gain stronger market acceptance. It reflects the global push toward reduced environmental impact and resource conservation. Brands highlight eco-friendly credentials to attract environmentally conscious buyers. Refillable containers and reduced reliance on single-use plastics further support this movement. Sustainability-focused machines strengthen brand reputation and long-term adoption in both residential and commercial sectors.
Increasing Adoption Across Non-Traditional Commercial Spaces
The Non-Alcoholic Smart Beverages Machine Market expands beyond traditional food service outlets into new commercial environments. Offices, airports, retail stores, and educational institutions integrate these machines for improved customer and employee experiences. It addresses rising demand for convenient, healthy drink options in everyday spaces. Retailers use machines to enhance store engagement, while airports focus on fast, hygienic service. The presence in non-traditional venues reflects broader acceptance and strong scalability potential. This trend highlights the market’s shift toward diversified applications worldwide.
Market Challenges Analysis
High Initial Investment and Maintenance Complexity Limiting Broader Adoption
The Non-Alcoholic Smart Beverages Machine Market faces a key challenge in its high upfront cost and ongoing maintenance needs. Advanced features such as AI integration, touchless dispensing, and smart sensors increase purchase prices compared to traditional machines. It creates barriers for small businesses and budget-conscious consumers. Maintenance costs also rise due to the need for regular software updates, spare parts, and technical servicing. Commercial operators often hesitate when weighing operational benefits against recurring expenses. This financial burden slows large-scale adoption, especially in emerging markets.
Limited Awareness, Technical Integration Issues, and Supply Chain Constraints
Consumer awareness of smart beverage machines remains limited in certain regions, restricting market growth. Many users still prefer conventional drink dispensers due to familiarity and lower cost. The Non-Alcoholic Smart Beverages Machine Market also struggles with integration challenges, as not all venues support IoT connectivity or digital payment systems. It complicates deployment in locations with weak infrastructure. Supply chain disruptions and fluctuating component availability further delay production and delivery timelines. These obstacles hinder rapid market penetration and impact global expansion strategies.
Market Opportunities
Rising Demand for Health-Centric and Customizable Beverage Solutions
The Non-Alcoholic Smart Beverages Machine Market presents strong opportunities through growing consumer focus on wellness and personalized nutrition. Smart machines can deliver sugar-free, vitamin-enriched, and low-calorie drinks tailored to individual needs. It allows consumers to track nutritional intake and customize beverages instantly, strengthening user engagement. Expansion into residential settings highlights the potential for home-based smart dispensing systems. Health-conscious buyers view these machines as tools for lifestyle management rather than simple dispensers. This trend creates significant room for innovation in product design and service models.
Expansion Potential Across Emerging Markets and Non-Traditional Venues
Commercial adoption of smart beverage machines in offices, airports, gyms, and retail outlets creates new revenue channels. The Non-Alcoholic Smart Beverages Machine Market can further grow by targeting emerging economies with rising disposable incomes and urbanization. It offers opportunities for companies to establish first-mover advantages in underpenetrated regions. Partnerships with hospitality, healthcare, and education sectors strengthen distribution networks and increase consumer exposure. Integration of mobile payments and IoT platforms also enables wider acceptance in digital-first markets. These factors position smart beverage machines for accelerated global expansion.
Market Segmentation Analysis:
By Category
The Non-Alcoholic Smart Beverages Machine Market is segmented into countertop and portable models. Countertop machines dominate due to their suitability for commercial environments, including restaurants, cafes, and office spaces. It supports higher capacity and integrates advanced features like AI-driven customization and touchless dispensing. Portable models appeal to residential users and small businesses seeking compact, space-saving solutions. Their lightweight design and user-friendly interfaces expand adoption among younger demographics and urban households. Both categories show steady demand, with countertop machines leading in commercial applications while portable models expand consumer reach.
- For instance, The De’Longhi Dinamica Plus is a fully automatic espresso machine that features programmable profiles for up to three users and a guest. Users can personalize their drinks through the machine’s display or the Coffee Link app.
By Price
The market divides into low, medium, and high-priced machines, each targeting different consumer bases. Low-cost machines attract budget-conscious households seeking simple dispensing solutions without advanced connectivity. Medium-priced machines gain traction among small businesses and mid-sized offices that value a balance between affordability and functionality. It highlights growing demand for durable machines with core smart features at reasonable cost. High-priced machines cater to premium hotels, large corporations, and luxury residential buyers. These machines integrate AI, IoT connectivity, and advanced sustainability features, driving strong uptake in high-income markets.
- For instance, The Cuisinart PerfecTemp Coffee Maker is a fully programmable drip coffee machine. Key features include adjustable brew strength for a “regular” or “bold” flavor and programmable brew-time up to 24 hours in advance. The machine uses advanced technology to deliver hotter coffee without compromising taste.
By End User
End-user segmentation includes residential, commercial, and hotels, reflecting diverse adoption patterns. Residential users prefer compact and portable machines designed for personalized consumption and health tracking. Commercial users, including offices, gyms, and retail outlets, adopt machines to enhance convenience, customer engagement, and service efficiency. Hotels represent a premium segment where demand centers on high-end machines offering advanced customization, sustainability, and reliability. It emphasizes the role of smart machines in improving guest experiences and aligning with hospitality standards. Across all end-user groups, the market demonstrates strong potential with tailored machine offerings that address unique needs.
Segments:
Based on Category:
Based on Price:
Based on End-User:
Based on the Geography:
- North America
- Europe
- Germany
- France
- U.K.
- Italy
- Spain
- Rest of Europe
- Asia Pacific
- China
- Japan
- India
- South Korea
- South-east Asia
- Rest of Asia Pacific
- Latin America
- Brazil
- Argentina
- Rest of Latin America
- Middle East & Africa
- GCC Countries
- South Africa
- Rest of the Middle East and Africa
Regional Analysis
North America
North America holds the largest market share of the Non-Alcoholic Smart Beverages Machine Market, accounting for nearly 35% of global revenue. The region benefits from high consumer awareness about health-focused drinks and strong adoption of smart kitchen appliances. It reflects a mature market where advanced technologies such as IoT integration, AI-based personalization, and touchless dispensing have gained strong acceptance. Commercial spaces, including offices, gyms, and hospitality sectors, show high investment in premium machines that deliver convenience and variety. Hotels and restaurants also lead adoption as they prioritize efficient service and premium guest experiences. Rising demand for sustainable and eco-friendly machines further strengthens regional growth. The dominance of established players and strong distribution channels enhances market expansion across the United States and Canada.
Europe
Europe contributes around 28% of the global market share, supported by strong environmental regulations and high focus on sustainable consumer products. The region prioritizes machines that integrate recyclable components, energy efficiency, and reduced water consumption. It reflects strong alignment with EU directives on sustainability and innovation. Countries such as Germany, the United Kingdom, and France represent major adopters due to their advanced hospitality sectors and high disposable incomes. Commercial adoption dominates, with offices, hotels, and airports investing in smart machines to offer healthier beverage options. Residential demand also rises, particularly in urban households favoring compact and portable units. Growing investment in R&D and government-backed sustainability programs continue to push the region forward.
Asia-Pacific
Asia-Pacific secures approximately 25% of the global market share and represents the fastest-growing regional segment. Rapid urbanization, rising disposable incomes, and a young population drive adoption of smart beverage machines. It benefits from expanding commercial applications in offices, educational institutions, gyms, and hospitality spaces. Countries such as China, Japan, South Korea, and India show diverse demand patterns, with premium adoption in developed economies and strong uptake of low- to mid-priced machines in emerging ones. The increasing popularity of health-oriented drinks strengthens market acceptance. Expansion of e-commerce platforms also improves accessibility across rural and urban regions. Local manufacturing capabilities reduce costs and create competitive opportunities for regional players.
Latin America
Latin America holds about 7% of the Non-Alcoholic Smart Beverages Machine Market share. The region faces slower adoption due to price sensitivity and infrastructure challenges but shows steady growth potential. It benefits from expanding hospitality sectors in Brazil, Mexico, and Argentina, where hotels and restaurants adopt machines to improve service efficiency. Rising health awareness also drives demand among younger consumers. It demonstrates gradual adoption in residential markets as urban households show interest in portable smart machines. Partnerships with international brands and local distributors help expand availability. While smaller in size, the region shows promising opportunities for long-term growth.
Middle East & Africa
The Middle East & Africa accounts for nearly 5% of global market share, representing an emerging but developing market segment. Adoption remains concentrated in premium hotels, resorts, and corporate spaces where demand for advanced, high-priced machines is high. It reflects strong reliance on imports due to limited local manufacturing. Countries such as the United Arab Emirates, Saudi Arabia, and South Africa lead regional adoption. Residential uptake remains low due to affordability challenges but is expected to rise with increasing urbanization and lifestyle changes. Expansion of hospitality and tourism sectors provides major growth opportunities. Market penetration will likely improve with stronger distribution partnerships and declining hardware costs.
Shape Your Report to Specific Countries or Regions & Enjoy 30% Off!
Key Player Analysis
- Nebula
- Moccamaster USA
- Breville USA
- Coffee
- Hamilton Beach Brands, Inc
- Isoda
- AICOOK
- De’Longhi
- Cuisinart
- IFB Appliances
Competitive Analysis
The Non-Alcoholic Smart Beverages Machine Market features led by AICOOK, Breville USA, Cuisinart, De’Longhi, Hamilton Beach Brands, Inc., IFB Appliances, Isoda, Moccamaster USA, Mr. Coffee, and Nebula. The Non-Alcoholic Smart Beverages Machine Market shows a highly competitive landscape driven by constant innovation, evolving consumer demand, and rapid technology adoption. Companies differentiate their offerings by integrating smart features such as IoT connectivity, AI-based personalization, and touchless dispensing. It reflects a market where design, functionality, and sustainability strongly influence consumer choices across residential, commercial, and hospitality sectors. Pricing strategies also play a critical role, with distinct opportunities in premium, mid-range, and budget segments. Global distribution networks and digital platforms enhance visibility and market penetration, while sustainability initiatives, including recyclable materials and energy-efficient designs, further strengthen brand positioning. Intense competition pushes manufacturers to focus on user experience, product durability, and service support to retain customer loyalty.
Recent Developments
- In April 2025, Keurig Dr Pepper announced its Q1 2025 results and reaffirmed its guidance for the year. The company continues to focus on delivering strong financial performance and strategic growth initiatives.
- In March 2025, PepsiCo announced its 2024 net revenue was nearly $91.8 billion, a slight increase over the previous year, driven by its diverse food and beverage brands including Lay’s, Doritos, Gatorade, and Pepsi-Cola. The company’s strong performance was attributed to its integrated portfolio of convenient foods and drinks, with brands like Pepsi-Cola, Gatorade, and Lay’s contributing to their global success.
- In 2024, The Coca-Cola Company increased its global reach by adding over 250,000 net new outlets and nearly 600,000 new coolers, which was a key strategy to recruit new consumers and foster sustained revenue growth by ensuring products are available to drink cold.
- In July 2024, Nestlé reported its half-year results for 2024, achieving organic growth of 2.1%. The company saw positive real internal growth of 0.1% for the first half and 2.2% for the second quarter, with improvements across all geographies.
Report Coverage
The research report offers an in-depth analysis based on Category, Price, End-User and Geography. It details leading market players, providing an overview of their business, product offerings, investments, revenue streams, and key applications. Additionally, the report includes insights into the competitive environment, SWOT analysis, current market trends, as well as the primary drivers and constraints. Furthermore, it discusses various factors that have driven market expansion in recent years. The report also explores market dynamics, regulatory scenarios, and technological advancements that are shaping the industry. It assesses the impact of external factors and global economic changes on market growth. Lastly, it provides strategic recommendations for new entrants and established companies to navigate the complexities of the market.
Future Outlook
- The market will grow with rising demand for health-focused and customizable beverage options.
- Smart machines will integrate AI and IoT to enhance personalization and user control.
- Touchless dispensing will gain wider adoption due to hygiene and safety preferences.
- Sustainability will remain a priority, with focus on recyclable materials and energy efficiency.
- Residential adoption will increase as consumers embrace compact and portable models.
- Commercial spaces like offices, gyms, and airports will expand machine installations.
- Emerging markets will create strong opportunities due to urbanization and rising incomes.
- Digital payment integration will strengthen acceptance in technologically advanced regions.
- Competition will intensify, driving innovation in design and advanced features.
- Strong partnerships in hospitality and retail sectors will accelerate global market penetration.


