
Market Overview
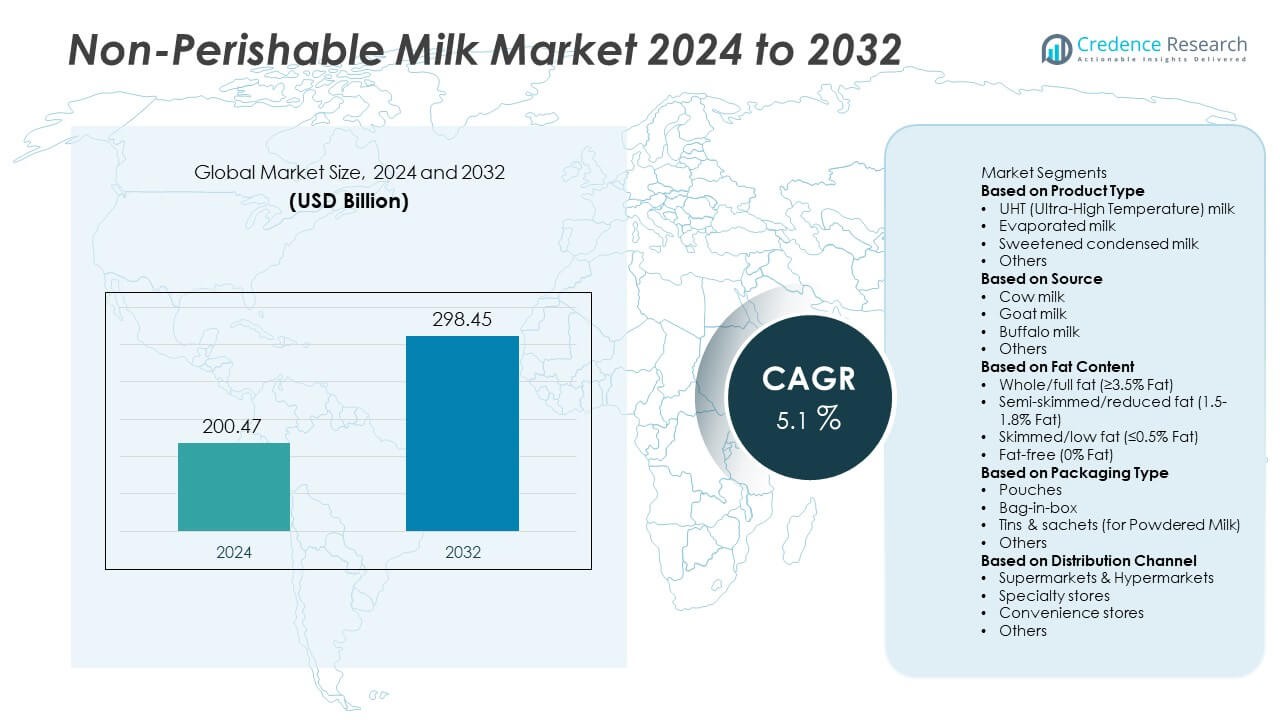
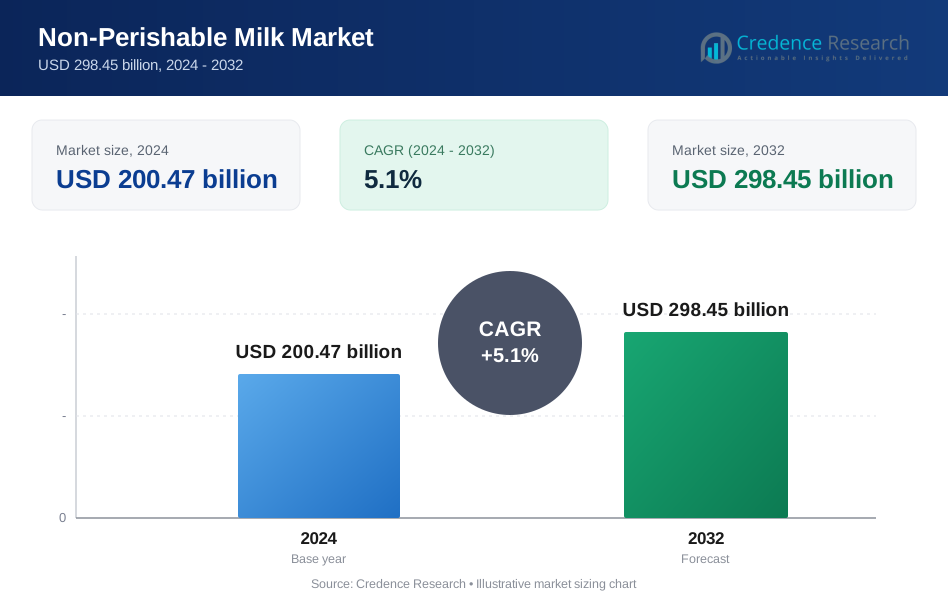
The Non-Perishable Milk market was valued at USD 200.47 billion in 2024 and is projected to reach USD 298.45 billion by 2032, expanding at a CAGR of 5.1% during the forecast period.
| REPORT ATTRIBUTE | DETAILS |
|---|---|
| Historical Period | 2020-2023 |
| Base Year | 2024 |
| Forecast Period | 2025-2032 |
| Non-Perishable Milk Market Size 2024 | USD 200.47 Billion |
| Non-Perishable Milk Market, CAGR | 5.1% |
| Non-Perishable Milk Market Size 2032 | USD 298.45 Billion |
The non-perishable milk market is led by major players such as Nestlé, Danone, Fonterra, Arla Foods, Friesland Campina, Lactalis, Saputo, Parmalat, Amul, and DMK Group, all of which emphasize innovation, fortified variants, and sustainable packaging to strengthen market presence. These companies leverage global supply chains and strong brand portfolios to meet rising demand across households, food service, and industrial sectors. Regionally, North America dominated the market with 34% share in 2024, supported by advanced retail networks and strong consumer preference for UHT milk. Europe followed with 28% share, driven by bakery and confectionery demand and strict sustainability standards, while Asia-Pacific secured 25% share, emerging as the fastest-growing region with urbanization, rising incomes, and limited cold chain infrastructure boosting adoption.
Market Insights
- The non-perishable milk market was valued at USD 200.47 billion in 2024 and is projected to reach USD 298.45 billion by 2032, growing at a CAGR of 5.1%.
- Rising urbanization and changing consumer lifestyles drive demand, with the UHT milk segment leading at 48% share in 2024 due to convenience and longer shelf life.
- Key trends include growing demand for fortified, lactose-free, and sustainable packaging solutions, supported by strong adoption across households and the food service sector.
- The market is competitive with leading players such as Nestlé, Danone, Fonterra, Arla Foods, FrieslandCampina, Lactalis, Saputo, Parmalat, Amul, and DMK Group focusing on product innovation, sustainability, and expansion into emerging markets.
- Regionally, North America led with 34% share in 2024, followed by Europe at 28% and Asia-Pacific at 25%, while Latin America and the Middle East & Africa together accounted for 13%, supported by rising retail penetration and limited cold chain infrastructure.
Market Segmentation Analysis:
By Product Type
The UHT (Ultra-High Temperature) milk segment dominated the non-perishable milk market with 48% share in 2024. Its leadership is driven by extended shelf life, convenience, and growing adoption in urban areas with limited refrigeration. UHT milk is widely preferred in both developed and developing economies for household and institutional use due to ease of storage and transport. Evaporated and sweetened condensed milk also contribute significantly, especially in bakery and confectionery industries, while niche categories under “others” support specialty consumption. However, UHT milk continues to lead as the primary driver of global demand.
- For instance, Tetra Pak offers high-speed Ultra-High-Temperature (UHT) packaging lines, such as its A3/Speed models for portion packages like the Tetra Prisma® Aseptic 330 Square. These lines can produce up to 24,000 cartons per hour and, through the combination of UHT treatment and aseptic packaging, can achieve a validated shelf life of six to twelve months without refrigeration.
By Source
Cow milk accounted for the largest share of 63% in the non-perishable milk market in 2024. Its dominance is linked to widespread availability, high nutritional value, and global consumer preference. Cow milk-based UHT, evaporated, and condensed formats enjoy strong acceptance across households and commercial sectors. Goat and buffalo milk, though smaller segments, are growing in popularity in regions such as the Middle East, South Asia, and parts of Europe due to perceived digestive benefits and higher nutritional content. Despite this growth, cow milk remains the dominant source, fueling the bulk of non-perishable milk demand.
- For instance, FrieslandCampina received 9.05 billion kilograms of milk from its member farmers in 2024, which it processed at numerous global facilities—including in the Netherlands where it is optimizing its production network—to produce a wide range of dairy products, including UHT milk, supporting global supply chains.
By Fat Content
Whole/full fat milk led the non-perishable milk market with 41% share in 2024, reflecting consumer demand for richer taste and higher nutritional benefits. Whole fat variants are widely used in households, bakeries, and food service industries, making them the most consumed category. Semi-skimmed and skimmed/low-fat milk are gaining traction in developed markets, driven by health-conscious consumers seeking lower-calorie options. Fat-free milk remains a niche segment but is expanding gradually among diet-focused consumers. Nevertheless, the continued popularity of full fat milk ensures its dominance across both developed and emerging markets.
Key Growth Drivers
Rising Urbanization and Lifestyle Changes
The growing pace of urbanization and busy lifestyles are driving demand for non-perishable milk. Consumers increasingly prefer UHT and condensed milk as they offer longer shelf life and require no refrigeration, making them convenient for storage and use. Urban households, students, and working professionals rely on these products for daily consumption and quick preparation of beverages and recipes. Expanding penetration in developing regions, where cold chain facilities are limited, further strengthens this trend, positioning non-perishable milk as a vital solution for modern consumer needs.
- For instance, Parag Milk Foods has a UHT processing unit at its Palamaner facility with a capacity of 0.17 million liters per day, which it uses to supply products like UHT milk to urban markets and retail chains. The company leverages the long shelf life of UHT products to target these areas, including major Indian metros, where cold storage infrastructure can be inconsistent.
Expanding Food and Beverage Industry
The food and beverage sector significantly boosts the non-perishable milk market, as evaporated and condensed milk are widely used in bakery, confectionery, and ready-to-drink beverages. Hotels, cafes, and restaurants prefer long-life milk due to ease of storage and consistent supply. Growing demand for packaged foods and desserts has further supported industrial applications. This sectoral reliance creates stable, bulk demand, ensuring sustained growth. With global food service expansion and rising preference for convenience-based products, the industry provides consistent opportunities for non-perishable milk adoption.
- For instance, Nestlé Professional has offered sweetened condensed milk, including in single-serve format, to its HoReCa customers in various regions, and aims to meet the high-volume needs of businesses like café chains and quick-service restaurants.
Rising Nutritional Awareness and Product Innovation
Increasing consumer focus on nutrition is fueling adoption of fortified non-perishable milk variants. Companies are introducing value-added products enriched with vitamins, minerals, and protein to attract health-conscious consumers. The development of lactose-free and low-fat UHT milk has also broadened the customer base, appealing to those with dietary restrictions. Innovations in packaging, such as aseptic cartons, improve safety and portability, further supporting demand. This shift toward healthier and innovative options strengthens the market’s ability to cater to diverse consumer needs while maintaining strong growth momentum.
Key Trends & Opportunities
Growth of Sustainable Packaging
Sustainability trends are reshaping the non-perishable milk market, with manufacturers adopting recyclable cartons and eco-friendly materials. Rising consumer preference for environmentally responsible products is pushing companies to invest in greener packaging solutions. These innovations not only address regulatory pressures but also strengthen brand positioning. Demand for sustainable options is particularly strong in Europe and North America, where eco-conscious purchasing decisions are rising. This shift creates opportunities for companies to differentiate through packaging, aligning with global sustainability goals while meeting evolving consumer expectations.
- For instance, SIG Group launched its combibloc EcoPlus carton for UHT milk, manufactured with 82% renewable paperboard and a carbon footprint reduction of 28 grams CO₂e per carton, supporting major dairy brands in Germany and the UK.
Expansion of E-Commerce and Retail Channels
The growth of e-commerce and modern retail networks is significantly boosting accessibility of non-perishable milk. Online platforms provide convenient delivery options, while supermarkets and hypermarkets offer wide product assortments. Subscription-based models for long-life milk products are gaining traction among urban consumers. Expanding retail penetration in emerging markets ensures broader product availability and brand visibility. With rising digital adoption and changing purchasing behaviors, the integration of online and offline channels creates new growth opportunities for non-perishable milk producers worldwide.
- For instance, Danone partnered with JD.com to enable monthly direct delivery of up to 420,000 UHT milk packs to consumers in major Chinese cities through an integrated e-commerce fulfillment network.
Key Challenges
Fluctuating Raw Material Prices
Volatility in raw material prices, particularly milk supply, affects production costs in the non-perishable milk market. Seasonal variations, climate change impacts, and supply chain disruptions often lead to inconsistent pricing, which challenges manufacturers in maintaining affordability. Smaller producers are particularly vulnerable, as they lack the scale to absorb cost fluctuations. This volatility directly impacts profitability and pricing strategies, requiring companies to adopt long-term supplier contracts and efficiency improvements to sustain competitiveness.
Health Concerns and Competition from Alternatives
Rising health concerns around processed and high-sugar milk products pose a challenge to market growth. Sweetened condensed milk, for instance, faces scrutiny due to increasing awareness of obesity and diabetes risks. Additionally, plant-based alternatives such as almond, soy, and oat milk are capturing health-conscious consumers seeking natural and dairy-free options. These alternatives threaten traditional demand, particularly in developed markets. To address this challenge, manufacturers must focus on developing healthier formulations, such as low-sugar and lactose-free products, to retain consumer trust and competitiveness.
Regional Analysis
North America
North America held the largest share of 34% in the non-perishable milk market in 2024, driven by high consumer demand for convenient dairy options and strong retail penetration. The U.S. dominates regional consumption, supported by widespread use of UHT and evaporated milk in households and the food service sector. Canada also contributes with growing adoption of fortified and lactose-free non-perishable milk products. The region benefits from advanced packaging technology and strong distribution networks across supermarkets, hypermarkets, and online channels. Rising demand for sustainable packaging and healthier variants further strengthens North America’s leadership in the global market.
Europe
Europe accounted for 28% share of the non-perishable milk market in 2024, supported by high consumption of evaporated and condensed milk across bakery and confectionery industries. Countries such as Germany, France, and the UK lead adoption, fueled by strong food service demand and a well-established retail infrastructure. Consumer preference for eco-friendly packaging and fortified milk variants continues to shape growth. Eastern Europe is also witnessing steady adoption as disposable incomes and urbanization increase. Strict sustainability regulations across the region encourage innovation, making Europe a significant contributor to the global non-perishable milk market.
Asia-Pacific
Asia-Pacific captured 25% share of the non-perishable milk market in 2024, making it the fastest-growing region. China and India lead demand due to large populations, growing urbanization, and limited cold chain infrastructure in rural areas. Rising middle-class incomes and expanding modern retail networks further fuel adoption. Japan and Southeast Asia also contribute with strong demand for UHT milk and condensed milk for culinary applications. Government initiatives to improve nutrition and support dairy processing enhance market prospects. With continued urban growth and rising consumer awareness, Asia-Pacific remains a key driver of long-term expansion in this market.
Latin America
Latin America represented 7% share of the non-perishable milk market in 2024, with Brazil and Mexico leading regional demand. Non-perishable milk consumption is supported by its suitability for regions with limited refrigeration infrastructure and growing use in traditional recipes. Expansion of supermarkets and rising adoption of packaged foods contribute to steady growth. However, economic instability and fluctuating raw milk supply present challenges. Despite these hurdles, the market is sustained by strong demand from the food service sector and increasing interest in fortified and affordable dairy options across urban and semi-urban populations.
Middle East & Africa
The Middle East & Africa accounted for 6% share of the non-perishable milk market in 2024, driven by growing urban populations and reliance on long-shelf-life dairy products in regions with hot climates. Gulf countries dominate demand, particularly for UHT milk, due to strong import reliance and modern retail penetration. In Africa, adoption is supported by limited refrigeration facilities and rising household demand for affordable dairy options. However, challenges such as import dependency and affordability issues persist. Expanding investments in local dairy processing and fortified milk products are expected to support gradual growth across the region.
Market Segmentations:
By Product Type
- UHT (Ultra-High Temperature) milk
- Evaporated milk
- Sweetened condensed milk
- Others
By Source
- Cow milk
- Goat milk
- Buffalo milk
- Others
By Fat Content
- Whole/full fat (≥3.5% Fat)
- Semi-skimmed/reduced fat (1.5-1.8% Fat)
- Skimmed/low fat (≤0.5% Fat)
- Fat-free (0% Fat)
By Packaging Type
- Pouches
- Bag-in-box
- Tins & sachets (for Powdered Milk)
- Others
By Distribution Channel
- Supermarkets & Hypermarkets
- Specialty stores
- Convenience stores
- Others
By Geography
- North America
- U.S.
- Canada
- Mexico
- Europe
- Germany
- France
- U.K.
- Italy
- Spain
- Rest of Europe
- Asia Pacific
- China
- Japan
- India
- South Korea
- South-east Asia
- Rest of Asia Pacific
- Latin America
- Brazil
- Argentina
- Rest of Latin America
- Middle East & Africa
- GCC Countries
- South Africa
- Rest of the Middle East and Africa
Competitive Landscape
The competitive landscape of the non-perishable milk market is shaped by leading players including Nestlé, Danone, Fonterra, Arla Foods, FrieslandCampina, Lactalis, Saputo, Parmalat, Amul, and DMK Group. These companies leverage strong global supply chains, advanced dairy processing capabilities, and wide product portfolios to maintain their market dominance. Their strategies focus on innovation in UHT, evaporated, and condensed milk, with added emphasis on fortified, lactose-free, and sustainable variants to meet changing consumer preferences. Many players are investing in eco-friendly packaging solutions to align with regulatory requirements and strengthen brand positioning. Expansion into high-growth markets in Asia-Pacific, Latin America, and Africa is a core strategy, supported by localized production facilities that ensure cost efficiency and improved accessibility. Additionally, partnerships with modern retail and e-commerce platforms enhance reach and visibility. The market remains highly competitive, with continuous price optimization, product diversification, and sustainability-focused initiatives driving leadership among top global dairy companies.
Key Player Analysis
Recent Developments
- In April 2025, Arla Foods and DMK Group announced intent to merge, forming Europe’s largest dairy cooperative.
- In 2025, Fonterra dropped its “carbon zero milk” claim for its Simply Milk line after missing emission targets.
- In July 2024, Nestlé reduced fat in milk powder by up to 60% using new protein aggregation technology.
- In June 2024, Arla Foods Bangladesh, the regional branch of the international dairy company Arla Foods, inaugurated a new UHT milk manufacturing facility in Gazipur, Bangladesh. With a total investment of Euro 15 million in collaboration with Mutual Group, the plant is expected to establish a new benchmark for safe and environmentally responsible dairy manufacturing in the country, with a strong commitment to delivering affordable nutrition.
Report Coverage
The research report offers an in-depth analysis based on Product Type, Source, Fat Content, Packaging Type, Distribution Channel and Geography. It details leading market players, providing an overview of their business, product offerings, investments, revenue streams, and key applications. Additionally, the report includes insights into the competitive environment, SWOT analysis, current market trends, as well as the primary drivers and constraints. Furthermore, it discusses various factors that have driven market expansion in recent years. The report also explores market dynamics, regulatory scenarios, and technological advancements that are shaping the industry. It assesses the impact of external factors and global economic changes on market growth. Lastly, it provides strategic recommendations for new entrants and established companies to navigate the complexities of the market.
Future Outlook
- The market will expand steadily with increasing demand for convenient dairy products.
- UHT milk will continue to dominate due to long shelf life and wide accessibility.
- Fortified and lactose-free variants will gain stronger traction among health-conscious consumers.
- Sustainable packaging will remain a priority, driven by regulatory and consumer expectations.
- Asia-Pacific will emerge as the fastest-growing regional market with rising urbanization.
- North America and Europe will maintain leadership with strong retail and food service demand.
- E-commerce platforms will boost sales through subscription models and doorstep delivery.
- Industrial and food service applications will drive bulk demand for evaporated and condensed milk.
- Local production in emerging markets will expand to reduce import dependency.
- Intense competition will push companies to innovate in taste, nutrition, and eco-friendly solutions.
Request a Free Sample
Fill in your details and we'll send you a free sample report.
- Sample data tables & charts
- Research methodology
Need a Custom Version of This Report?
Tailor the scope, geography, or segments to your exact requirements.
- Custom geography or segment scope
- Direct access to our analyst team
Frequently Asked Questions
What is the current market size for Non-Perishable Milk market, and what is its projected size in 2032?
At what Compound Annual Growth Rate is the Non-Perishable Milk market projected to grow between 2025 and 2032?
Which Non-Perishable Milk market segment held the largest share in 2024?
What are the primary factors fueling the growth of the Non-Perishable Milk market?
Who are the leading companies in the Non-Perishable Milk market?
Which region commanded the largest share of the Non-Perishable Milk market in 2024?
Table of Content
Chapter 1. Report Introduction
- 1.1 Report Description & Purpose
- 1.1.1 Report Title & Market Definition
- 1.1.2 Unique Selling Propositions (USP) & Key Differentiators
- 1.1.3 Value Proposition for Stakeholders
- 1.2 Research Objectives
- 1.2.1 Market Sizing Objectives (Volume & Revenue)
- 1.2.2 Segmentation Objectives
- 1.2.3 Competitive Intelligence Objectives
- 1.2.4 Forecast & Scenario Objectives
- 1.3 Report Scope
- 1.3.1 Non-Perishable Milk Scope – Types & Subtypes Covered
- 1.3.2 Geographic Scope – Regions & Countries Covered
- 1.3.3 Historical Period, Base Year & Forecast Period (2024; forecast to 2032)
- 1.3.4 Inclusions & Exclusions
- 1.4 HS Code & Classification Framework
- 1.5 Currency, Units & Pricing Basis
- 1.6 Target Stakeholders
- 1.7 Limitations & Assumptions
Chapter 2. Executive Summary
- 2.1 Global Non-Perishable Milk Market Snapshot
- 2.1.1 Market Size – Historical (2024) & Forecast (2024-2032) (2024: USD 200.47 billion → 2032: USD 298.45 billion)
- 2.1.2 Volume & Revenue – Global Totals
- 2.1.3 Key Market Highlights – Top Five Facts
- 2.2 Non-Perishable Milk Market Segmentation Snapshot
- 2.2.1 Market Split by Region – 2024 vs. 2032
- 2.3 Competitive Snapshot
- 2.3.1 Top 10 Players by Revenue Share – 2024
- 2.3.2 Top 10 Players by Volume Share – 2024
- 2.3.3 Recent Strategic Developments (18-Month Summary)
- 2.4 Key Investment Highlights & Strategic Conclusions
Chapter 3. Non-Perishable Milk Market Dynamics & Industry Analysis
- 3.1 Market Overview & Context
- 3.1.1 Non-Perishable Milk Market Position in the Broader Automotive Value Chain
- 3.1.2 OEM vs. Replacement Market Dynamics
- 3.1.3 Market Maturity & Development Stage by Region
- 3.2 Non-Perishable Milk Market Drivers
- 3.3 Non-Perishable Milk Market Restraints & Challenges
- 3.4 Non-Perishable Milk Market Opportunities
- 3.5 Porter's Five Forces Analysis
- 3.5.1 Threat of New Entrants
- 3.5.2 Bargaining Power of Suppliers
- 3.5.3 Bargaining Power of Buyers
- 3.5.4 Threat of Substitutes
- 3.5.5 Competitive Rivalry – Intensity Assessment
- 3.6 Non-Perishable Milk Value Chain Analysis
- 3.6.1 Upstream – Raw Material/Input Suppliers
- 3.6.1.1 Raw Material/Input 1
- 3.6.1.2 Raw Material/Input 2
- 3.6.1.3 Raw Material/Input 3
- 3.6.2 Midstream – Production/Manufacturing/Service Delivery
- 3.6.2.1 Production/Process Overview
- 3.6.2.2 Key Facility Locations & Capacity by Manufacturer
- 3.6.3 Downstream – Distribution & End Consumer
- 3.6.3.1 Primary Channel – B2B/OEM
- 3.6.3.2 Secondary Channels – Dealer, Retail, Online, Direct
- 3.6.4 Value Chain Profitability Analysis
- 3.6.1 Upstream – Raw Material/Input Suppliers
- 3.7 PESTEL Analysis
- 3.7.1 Political Factors
- 3.7.2 Economic Factors
- 3.7.3 Social Factors
- 3.7.4 Technological Factors
- 3.7.5 Environmental Factors
- 3.7.6 Legal Factors
- 3.8 Non-Perishable Milk Supply Chain Analysis
- 3.8.1 Raw Material/Input Supply Risk Assessment
- 3.8.2 Manufacturing Concentration Risk (Geographic Exposure)
- 3.8.3 Trade Disruption Impact Analysis
- 3.9 Regulatory & Policy Landscape
Note: The regulatory and policy landscape section covers regulations based on their applicability to the market, Non-Perishable Milk category, geography, and scope of the study. Only regulatory frameworks with a material impact on operations, compliance, trade, sustainability, or market access are analyzed in detail.
Chapter 4. Key Investment Pockets & Opportunity Analysis
- 4.1 Non-Perishable Milk Market Attractiveness Analysis
- 4.1.1 By Region – Investment Attractiveness Matrix (Volume × CAGR)
- 4.2 Absolute Revenue Growth Opportunity
- 4.2.1 By Region – Absolute USD Growth Through 2032
- 4.3 Incremental Volume Opportunity
- 4.3.1 By Region – Incremental Volume Through 2032
- 4.3.2 Segment – Incremental Volume
- 4.4 Emerging Submarket Opportunity Deep Dive (Subject to Applicability)
- 4.5 Emerging Market Opportunity Scorecards
- 4.5.1 United States
- 4.5.2 Europe
- 4.5.3 Asia
- 4.5.4 Middle East & Africa
Note: Emerging Market Opportunity Scorecards will be included based on relevance and strategic importance. Regions listed are indicative and may vary depending on data availability and market dynamics.
Chapter 5. Non-Perishable Milk Import-Export Analysis & Trade Flows
- 5.1 Global Trade Overview
- 5.1.1 Global Export Value by Country (2024)
- 5.1.2 Global Export Volume by Country (2024)
- 5.1.3 Global Import Value by Country (2024)
- 5.1.4 Global Import Volume by Country (2024)
- 5.1.5 Net Trade Balance by Country (2024)
- 5.2 Export Analysis – Segment
- 5.2.1 Type 1 (HS Code)
- 5.2.2 Type 2 (HS Code)
- 5.2.3 Type 3 (HS Code)
- 5.2.4 Type 4 (HS Code)
- 5.2.5 Type 5 (HS Code)
- 5.3 Import Analysis – Segment
- 5.3.1 Type 1 (HS Code)
- 5.3.2 Type 2 (HS Code)
- 5.3.3 Type 3 (HS Code)
- 5.3.4 Type 4 (HS Code)
- 5.3.5 Type 5 (HS Code)
- 5.4 Average Unit Trade Prices
- 5.4.1 Average Export Price – Segment & Country
- 5.4.2 Average Import Price – Segment & Source Country
- 5.4.3 Price Trends (2024)
- 5.5 Key Trade Route Analysis
- 5.5.1 Trade Route 1
- 5.5.2 Trade Route 2
- 5.5.3 Trade Route 3
- 5.5.4 Trade Route 4
- 5.5.5 Trade Route 5
- 5.6 Trade Policy Impact Assessment
- 5.6.1 US Anti-Dumping & Section 301 Tariffs
- 5.6.2 EU Customs Union Impact
- 5.6.3 Major Free Trade Agreements
- 5.6.4 USMCA Rules of Origin
Note: Trade policy analysis will be included only where relevant to the Non-Perishable Milk market.
Chapter 6. Competitive Landscape & Company Benchmarking
- 6.1 Non-Perishable Milk Market Concentration & Structure
- 6.1.1 Herfindahl-Hirschman Index (HHI) – vs. 2024
- 6.1.2 Tier 1, Tier 2 & Tier 3 Market Structure
- 6.1.3 Global, Regional & Local Player Dynamics
- 6.2 Non-Perishable Milk Market Share Analysis – 2024
- 6.2.1 Global Revenue Share by Company
- 6.2.2 Global Volume Share by Company
- 6.2.3 Regional Revenue Share
- 6.2.4 Market Share Evolution ( vs. 2024)
- 6.2.5 OEM Segment Share by Company
- 6.2.6 Replacement Segment Share by Company
- 6.3 Production/Delivery Capacity & Facility Analysis
- 6.3.1 Global Installed Capacity
- 6.3.2 Capacity Utilization Rates
- 6.3.3 Production/Output Volume
- 6.3.4 Facility Locations & Capacity Map
- 6.3.5 Planned Capacity Additions
- 6.4 Non-Perishable Milk Competitive Benchmarking Matrix
- 6.4.1 Revenue, Volume, CAGR & Profitability Comparison
- 6.4.2 Channel Revenue Mix
- 6.4.3 Geographic Revenue Exposure
- 6.4.4 R&D Intensity
- 6.4.5 Sustainability Maturity
- 6.5 Strategic Developments in Non-Perishable Milk (Last 24 Months)
- 6.5.1 Mergers, Acquisitions & Divestments
- 6.5.2 New Non-Perishable Milk Launches
- 6.5.3 Facility Expansions
- 6.5.4 Strategic Alliances, Joint Ventures & Partnerships
- 6.5.5 Distribution Expansion & Market Entry
- 6.5.6 Sustainability & ESG Initiatives
- 6.6 Competitive Strategy Mapping
- 6.6.1 Leader, Challenger, Follower & Niche Classification
- 6.6.2 Pricing Strategy Comparison
- 6.6.3 Channel Strategy Matrix
Note: Strategic developments are included based on their materiality and the availability of reliable information.
Chapter 7. Global Non-Perishable Milk Market – By Distribution Channel
- 7.1 Segment Overview
- 7.1.1 Volume & Revenue Split by Channel (2024 & 2032)
- 7.1.2 Channel Mix Evolution (2024-2032)
Chapter 8. Regional Market Analysis – Global Overview
- 8.1 Global Regional Overview
- 8.1.1 Regional Volume Share
- 8.1.2 Regional Revenue Share
- 8.1.3 Regional Volume by Region
- 8.1.4 Regional Revenue by Region
- 8.1.5 Regional Forecast Through 2032
- 8.2 Cross-Regional Segment Analysis
- 8.2.1 By Distribution Channel
- 8.2.2 By Brand/Price Tier
Chapter 9. North America Non-Perishable Milk Market
- 9.1 United States
- 9.2 Canada
- 9.3 Mexico
Chapter 10. Europe Non-Perishable Milk Market
- 10.1 Germany
- 10.2 France
- 10.3 Italy
- 10.4 United Kingdom
- 10.5 Spain
- 10.6 Poland
- 10.7 Russia
- 10.8 Netherlands
- 10.9 Belgium
- 10.10 Sweden
- 10.11 Denmark
- 10.12 Norway
- 10.13 Rest of Europe
Chapter 11. Asia Pacific Non-Perishable Milk Market
- 11.1 China
- 11.2 India
- 11.3 Japan
- 11.4 South Korea
- 11.5 Thailand
- 11.6 Indonesia
- 11.7 Vietnam
- 11.8 Malaysia
- 11.9 Australia
- 11.10 Rest of Asia Pacific
Chapter 12. Latin America Non-Perishable Milk Market
- 12.1 Brazil
- 12.2 Argentina
- 12.3 Colombia
- 12.4 Chile
- 12.5 Rest of Latin America
Chapter 13. Middle East Non-Perishable Milk Market
- 13.1 Saudi Arabia
- 13.2 United Arab Emirates
- 13.3 Turkey
- 13.4 Israel
- 13.5 Iran
- 13.6 Rest of the Middle East
Chapter 14. Africa Non-Perishable Milk Market
- 14.1 South Africa
- 14.2 Egypt
- 14.3 Nigeria
- 14.4 Morocco
- 14.5 Rest of Africa
Chapter 15. Non-Perishable Milk Company Profiles
- 15.1 [Company 01]
- 15.1.1 Company Overview
- 15.1.2 Key Management Personnel
- 15.1.3 Products & Services Portfolio
- 15.1.4 Financial Performance
- 15.1.5 Key Market Focus & Geographic Presence
- 15.1.6 Recent Developments & Strategic Initiatives
Note: The company profile list is preliminary and may change based on research findings, market developments, data availability, and client requirements.
Chapter 16. Appendices
- Appendix A – List of Abbreviations & Acronyms
- Appendix B – Industry Classification Code Reference – Full Series
- Appendix C – Production & Capacity Data Tables
- Appendix D – End-Use & Demand Base Tables
- Appendix E – Consumption & Replacement Rate Assumptions
- Appendix F – ASP Reference Tables
- Appendix G – Manufacturing & Facility Database
- Appendix H – Import-Export Data Tables
- Appendix I – Regulatory Summary Tables
- Appendix J – Primary Research Participant List (Anonymized)
- Appendix K – Primary Research Questionnaire Framework
- Appendix L – Data Sources & Bibliography
- Appendix M – Market Size Divergence & Source Comparison
Chapter 17. Research Methodology
- 17.1 Research Framework & Philosophy
- 17.2 Secondary Research – Sources, Hierarchy & Data Extraction
- 17.3 Data Modeling – Bottom-Up & Top-Down Market Sizing
- 17.4 Primary Research – Stakeholder Framework, LOI & Sample Sizes
- 17.5 Forecast Methodology – Regression, Scenario & Sensitivity Analysis
- 17.6 Quality Control – Four-Layer Validation Framework
- 17.7 Limitations & Standard Assumptions
- 17.8 Disclaimer
