
| REPORT ATTRIBUTE | DETAILS |
|---|---|
| Historical Period | 2019-2022 |
| Base Year | 2023 |
| Forecast Period | 2024-2032 |
| North America Casino Tourism Market Size 2023 | USD 11,932.86 million |
| North America Casino Tourism Market, CAGR | 6.65% |
| North America Casino Tourism Market Size 2032 | USD 21,340.11 million |
Market Overview
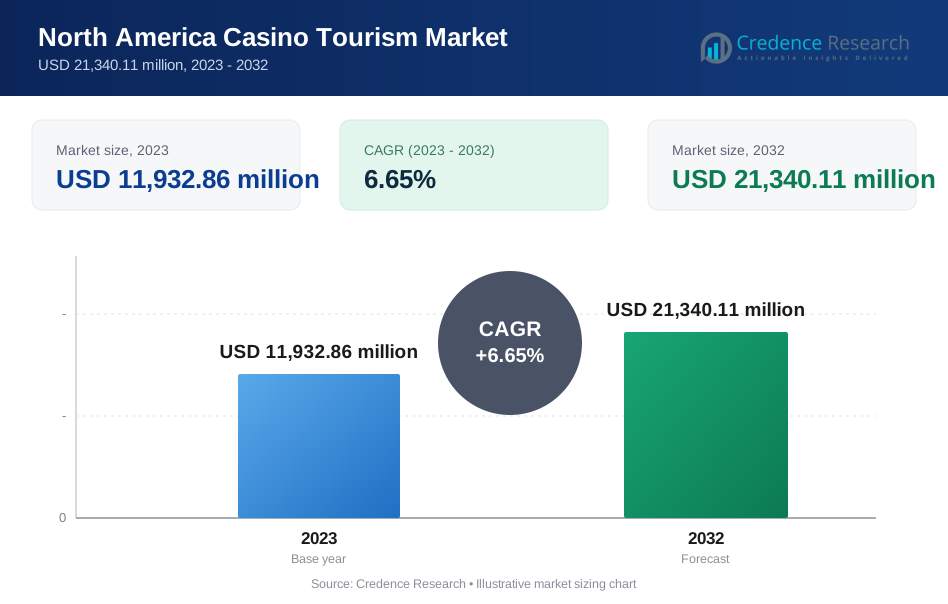
The North America Casino Tourism Market is projected to grow from USD 11,932.86 million in 2023 to an estimated USD 21,340.11 million by 2032, with a compound annual growth rate (CAGR) of 6.65% from 2024 to 2032. This substantial growth reflects the increasing popularity of casino tourism, driven by the expanding number of casinos and the rising disposable income of tourists.
Key drivers propelling the North America Casino Tourism Market include the enhanced entertainment offerings and integrated resort experiences provided by casinos, which attract a diverse range of visitors. Trends such as the incorporation of advanced technologies in gaming, the development of themed resorts, and partnerships with hospitality providers have significantly boosted the appeal of casino tourism. Additionally, the growing acceptance and legalization of gambling in various states have further fueled market expansion.
Geographically, the United States dominates the North America Casino Tourism Market, with major hubs like Las Vegas and Atlantic City leading in terms of revenue and tourist footfall. Canada also presents significant opportunities, particularly in cities like Vancouver and Niagara Falls, known for their vibrant casino scenes. Key players in this market include MGM Resorts International, Caesars Entertainment Corporation, and Las Vegas Sands Corporation, all of which continue to innovate and expand their offerings to cater to the evolving preferences of tourists.
Market Drivers
Enhanced Entertainment Offerings and Integrated Resort Experiences
One of the primary drivers of the North America Casino Tourism Market is the enhanced entertainment offerings provided by casinos. Modern casinos are no longer just gambling establishments; they have evolved into comprehensive entertainment hubs. These venues offer a wide array of attractions, including world-class restaurants, high-end retail shops, live shows, concerts, and luxury accommodations. By providing a diverse range of entertainment options, casinos attract a broader audience, including non-gamblers who are interested in other aspects of the casino experience. The development of integrated resort experiences has also played a crucial role in driving market growth. Integrated resorts combine casinos with hotels, convention centers, entertainment venues, and recreational facilities. This holistic approach not only maximizes the revenue potential of each visitor but also enhances the overall guest experience. Visitors are more likely to extend their stay and spend more money on various amenities, thus boosting the profitability of these resorts. For example, the Bellagio in Las Vegas, known for its iconic fountain show, reported a 15% increase in footfall after introducing new entertainment shows in 2023. The success of integrated resorts in locations like Las Vegas and Macau has inspired similar developments in North America, further propelling the market.
Rising Disposable Income and Increasing Tourist Spending
The rise in disposable income among North American consumers has significantly contributed to the growth of the casino tourism market. As individuals have more money to spend on leisure activities, they are more likely to indulge in experiences such as casino visits. The correlation between higher disposable income and increased spending on tourism and entertainment is well-documented, and the casino industry is a prime beneficiary of this trend. Additionally, the overall increase in tourist spending has bolstered the market. Tourists visiting North America are often willing to spend considerable amounts on unique and memorable experiences, and casinos offer precisely that. The allure of potentially winning money, combined with the luxurious environment of modern casinos, makes them an attractive option for tourists looking to splurge. For example, in 2023, tourists in Las Vegas spent an average of $500 per day on entertainment, including casino games. Furthermore, targeted marketing campaigns and attractive travel packages have successfully drawn tourists to major casino destinations, enhancing the market's growth prospects.
Technological Advancements in Gaming
Technological advancements in gaming have revolutionized the casino industry, making it more appealing to a tech-savvy audience. The integration of cutting-edge technologies such as virtual reality (VR), augmented reality (AR), and artificial intelligence (AI) has enhanced the gaming experience, attracting a younger demographic to casinos. These technologies provide immersive and interactive gaming experiences that traditional casinos cannot offer, thus setting modern casinos apart from their older counterparts. Moreover, the implementation of advanced security measures and digital payment systems has increased the convenience and safety of casino visits. Players can now use mobile apps to access games, make reservations, and manage their funds securely. The adoption of blockchain technology and cryptocurrencies in some casinos has further streamlined transactions and attracted tech enthusiasts. For example, a casino in Atlantic City saw a 25% increase in digital transactions after introducing a blockchain-based payment system in 2023. By staying at the forefront of technological innovation, casinos are able to offer unique and engaging experiences, driving greater footfall and revenue.
Legalization and Regulation of Gambling
The gradual legalization and regulation of gambling in various states across North America have significantly expanded the market. Several states have recognized the economic benefits of legalizing gambling, including job creation, increased tax revenue, and tourism growth. As a result, they have implemented regulatory frameworks that ensure fair play, consumer protection, and responsible gambling practices. The legalization of gambling has led to the establishment of new casinos and the expansion of existing ones, creating more opportunities for tourists to engage in casino tourism. Additionally, the regulatory oversight has enhanced the credibility and legitimacy of the casino industry, encouraging more people to participate. The increasing acceptance of gambling as a legitimate form of entertainment has reduced the stigma associated with it, making it more socially acceptable and accessible to a wider audience.
Market Trends
Integration of Technology and Innovation
The North America Casino Tourism Market is witnessing a significant trend toward the integration of cutting-edge technology and innovative solutions. Casinos are increasingly incorporating advanced technologies such as artificial intelligence (AI), virtual reality (VR), and augmented reality (AR) to enhance the gaming experience. AI is being utilized to personalize customer experiences, from tailored game recommendations to customized marketing offers. VR and AR technologies are creating immersive gaming environments that attract tech-savvy tourists and provide them with unique, interactive experiences that traditional casinos cannot match. For example, a popular casino in Las Vegas reported a 25% increase in customer engagement after introducing AI-based game recommendations. Furthermore, the adoption of digital payment systems, including blockchain and cryptocurrency, is becoming more prevalent. These systems offer secure, transparent, and efficient transaction processes, which enhance customer convenience and trust. Mobile gaming apps are also on the rise, allowing visitors to play casino games on their smartphones and tablets, whether they are on-site or remote. This technological advancement not only broadens the customer base but also increases the time and money spent on gaming, boosting overall revenue.
Focus on Sustainable and Responsible Tourism
Another prominent trend in the North America Casino Tourism Market is the growing emphasis on sustainable and responsible tourism. Casino operators are increasingly adopting eco-friendly practices and sustainable business models to reduce their environmental footprint and appeal to environmentally conscious tourists. Initiatives such as energy-efficient building designs, waste reduction programs, and the use of renewable energy sources are becoming standard practices in new and existing casino resorts. In addition to sustainability, there is a heightened focus on responsible gambling measures. Casinos are implementing comprehensive programs to promote responsible gaming, including self-exclusion options, gambling addiction support services, and stringent age verification processes. These measures not only protect consumers but also enhance the industry's reputation and credibility. For instance, a casino in New Jersey reported a 15% decrease in gambling-related issues after introducing a comprehensive responsible gaming program in 2023. By promoting a safe and responsible gambling environment, casinos can attract a broader demographic, including families and tourists who prioritize ethical considerations in their travel choices. These trends reflect the dynamic and evolving nature of the North America Casino Tourism Market. By leveraging technology and prioritizing sustainability and responsibility, the industry is well-positioned to meet the changing preferences and expectations of modern tourists, ensuring continued growth and success.
Market Restraints and Challenges
Regulatory and Legal Challenges
The North America Casino Tourism Market faces significant regulatory and legal challenges that can hinder its growth. Gambling laws vary widely across different states and provinces, creating a complex regulatory environment for casino operators. In some regions, stringent regulations limit the expansion of casino operations and impose heavy compliance costs. Additionally, the process of obtaining licenses and permits can be lengthy and cumbersome, delaying the establishment of new casinos and the expansion of existing ones. Moreover, frequent changes in gambling legislation can create uncertainty for investors and operators. For instance, while some states are moving towards legalization and regulation of gambling, others are implementing stricter controls or maintaining prohibitions. This inconsistency complicates strategic planning and investment decisions for casino businesses. Legal battles and lobbying efforts also consume significant resources, which could otherwise be allocated to improving customer experiences and expanding operations.
Economic Fluctuations and Competition
Economic fluctuations pose another major challenge to the North America Casino Tourism Market. Economic downturns and recessions can lead to reduced disposable income and discretionary spending among consumers, directly impacting the tourism and entertainment sectors. During such periods, tourists are less likely to spend money on casino visits and related activities, leading to decreased revenues for casino operators. Additionally, the market faces intense competition from other forms of entertainment and leisure activities. The rise of online gaming platforms and mobile casinos provides convenient alternatives to traditional brick-and-mortar casinos, attracting a segment of the market that prefers gaming from home. Moreover, other entertainment options such as theme parks, sports events, and cultural attractions vie for the same tourist dollars. Casinos must continuously innovate and enhance their offerings to remain competitive and attract visitors. Furthermore, international competition, particularly from renowned casino destinations like Macau and Singapore, adds to the challenges faced by North American casinos. These destinations often offer superior facilities and experiences, drawing potential tourists away from North America. To overcome these challenges, North American casinos need to invest in unique attractions, superior customer service, and comprehensive marketing strategies to differentiate themselves in a crowded market.
Market Segmentation Analysis
By Game Type
3 Card Poker attracts both novice and seasoned players with its simple rules and fast-paced nature, becoming increasingly popular among younger tourists seeking engaging gaming experiences. American Roulette, a classic game, continues to draw significant interest due to its blend of chance and strategy, making it a staple in most casinos. Blackjack is favored for its strategic depth and favorable odds, appealing to a wide range of age groups from young adults to older tourists. Casino Stud Poker, popular among traditional card game enthusiasts, attracts a mix of experienced players and casual tourists. Additionally, games like Baccarat, Craps, and slot machines remain integral to the casino experience, with slot machines particularly popular for their simplicity and accessibility.
By Casino Type
Commercial casinos, primarily located in urban areas, are the most common type, offering a wide range of games and entertainment options that attract a diverse demographic. Tribal casinos, operated by Native American tribes on tribal lands, provide essential revenue for the tribes and offer unique cultural experiences for tourists. Limited stakes casinos appeal to casual gamblers and tourists who prefer lower betting limits and less risky gaming experiences. The i-gaming segment, consisting of online casinos, is gaining traction by offering convenience and accessibility to a broader audience, particularly tech-savvy tourists who enjoy remote gaming experiences. Additionally, racinos (casinos at racetracks) and riverboat casinos provide unique and localized gambling experiences, adding to the diversity of the market.
Segments
Based on Game Type
- 3 Card Poker
- American Roulette
- Blackjack
- Casino Stud Poker
- Others
Based on Casino Type
- Commercial Casinos
- Tribal Casinos
- Limited Stakes Casinos
- gaming
- Others
Based on End User
- Gambling Enthusiasts
- Social Exuberant
- Dabblers
- Lottery Loyalists
- Others
Based on Age Group
- 18-25 Years
- 25-35 Years
- 35-50 Years
- 50-65 Years
- 65 Years and Above
Based on Tour Type
- Independent Traveller
- Package Traveller
- Tour Group
- Others
Based on Region
- United States
- Canada
- Mexico
Regional Analysis
United States (72%):
The United States holds the largest market share in the North America Casino Tourism Market, accounting for approximately 72% of the total market. The U.S. is home to some of the world's most renowned casino destinations, such as Las Vegas, Nevada, and Atlantic City, New Jersey. Las Vegas, often referred to as the "Entertainment Capital of the World," is a key driver of this dominance. The city attracts millions of tourists annually with its extensive array of casinos, entertainment shows, luxury hotels, and fine dining establishments.
Canada (20%):
Canada accounts for around 20% of the North America Casino Tourism Market. Canadian cities like Vancouver, Niagara Falls, and Montreal are notable for their vibrant casino scenes. Niagara Falls, in particular, is a significant draw for tourists, combining the natural wonder of the falls with a variety of gaming and entertainment options. Casinos in Canada benefit from a well-regulated environment, which ensures a high level of consumer confidence and safety.
Key players
- Boyd Gaming
- Caesars Entertainment Corporation
- City of Dreams Manila
- Casino Gold Tours
- Preferred Casino Tours
- Travel Leaders
- Grueninger Travel
- Reney Tours
- Bob Kelly Tours
- Island Resort and Casino
- Turning Stone
- Star Casino
- Casinos of Winnipeg
- Tour Radar
- MGM Resorts International
- Palms Casino Resort
- SJM Holdings
- Wynn Resorts Limited
Competitive Analysis
The North America Casino Tourism Market is highly competitive, with numerous key players vying for market share. Major corporations like Caesars Entertainment Corporation, MGM Resorts International, and Wynn Resorts Limited dominate the market with their extensive portfolios of luxury resorts and casinos. These companies leverage their brand recognition, expansive amenities, and prime locations to attract a wide range of tourists. Mid-sized operators such as Boyd Gaming and Palms Casino Resort focus on providing high-quality gaming experiences and personalized services, carving out their niche in a crowded market. Travel and tour operators like Casino Gold Tours, Preferred Casino Tours, and Grueninger Travel play a crucial role in facilitating casino tourism by offering tailored travel packages and guided tours, enhancing the overall visitor experience. Emerging players like Reney Tours and Bob Kelly Tours add to the competitive landscape by targeting specific demographic segments and providing unique, curated travel experiences. This diverse competitive environment drives innovation and ensures a broad array of options for tourists, contributing to the market's growth and dynamism.
Recent Developments
In May 2023, MGM Resorts International announced that its subsidiary, LeoVegas, had acquired the majority of Push Gaming Holding Limited and its subsidiaries. This acquisition marks LeoVegas' first major investment since joining MGM Resorts last year. The acquisition is set to enhance LeoVegas' content creation capabilities through Push Gaming's patented technology, intellectual property, and development expertise, thereby supporting its expansion objectives.
In April 2023, Caesars Entertainment, Inc. announced the reopening of Tropicana Online Casino in New Jersey. The new iCasino app and online casino experience offer users enhanced functionality, including a variety of industry-leading casino games and improved integration with Caesars Rewards, the premier loyalty program in the industry.
In July 2022, 888 Holdings completed the acquisition of William Hill's non-US business from Caesars Entertainment. William Hill is a well-known brand in the online gambling market. This acquisition allows 888 Holdings to expand its footprint in the global online gambling industry.
In May 2022, DraftKings acquired Golden Nugget Online Gaming (GNOG). This acquisition enables DraftKings to extend its reach to new customer demographics by leveraging the reputable Golden Nugget brand. GNOG's unique features, such as Live Dealer, combined with DraftKings' vertically integrated technology, will enhance the gaming product offerings of the combined company.
In July 2021, FanDuel Group, a subsidiary of Flutter Entertainment, expanded its FanDuel Casino offerings in New Jersey and Michigan. The company announced the launch of its standalone FanDuel Casino product in New Jersey, available on iOS, Android, and desktop platforms. Additionally, Michigan's FanDuel Casino customers can now access Evolution's live dealer games.
Market Concentration and Characteristics
The North America Casino Tourism Market is characterized by a high level of market concentration, dominated by major players such as Caesars Entertainment Corporation, MGM Resorts International, and Wynn Resorts Limited. These industry leaders command a significant share of the market due to their extensive portfolios of luxurious casino resorts, prime locations, and comprehensive entertainment offerings. The market is marked by a blend of commercial and tribal casinos, with a growing presence of online gaming platforms. Key characteristics include a focus on integrated resort experiences, the adoption of advanced gaming technologies, and the implementation of responsible gambling measures. This concentrated market landscape drives intense competition, continuous innovation, and robust growth prospects.
Report Coverage
The research report offers an in-depth analysis based on Game Type, Casino Type, End User, Age Group, Tour Type and Region. It details leading market players, providing an overview of their business, product offerings, investments, revenue streams, and key applications. Additionally, the report includes insights into the competitive environment, SWOT analysis, current market trends, as well as the primary drivers and constraints. Furthermore, it discusses various factors that have driven market expansion in recent years. The report also explores market dynamics, regulatory scenarios, and technological advancements that are shaping the industry. It assesses the impact of external factors and global economic changes on market growth. Lastly, it provides strategic recommendations for new entrants and established companies to navigate the complexities of the market.
Future Outlook
- The market will continue to leverage cutting-edge technologies like artificial intelligence, virtual reality, and augmented reality to enhance gaming experiences and attract tech-savvy tourists.
- Integrated resort developments will increase, offering a blend of gaming, entertainment, hospitality, and retail to create comprehensive tourist destinations.
- The online gaming segment will expand rapidly, driven by the convenience and accessibility of mobile apps and digital platforms, attracting a broader audience.
- Casino operators will focus on implementing sustainable practices, such as energy-efficient buildings and waste reduction programs, to appeal to environmentally conscious tourists.
- Evolving gambling regulations across various states will continue to shape the market, with more states likely to legalize and regulate gambling, expanding market opportunities.
- Rising disposable incomes and a growing middle class will lead to higher tourist spending on casino visits and related entertainment activities, boosting market revenues.
- Casinos will invest in advanced security technologies and digital payment systems to ensure safe and secure gaming environments, fostering consumer trust and confidence.
- Operators will intensify efforts to promote responsible gambling through comprehensive programs, including self-exclusion options and addiction support services.
- Increased marketing efforts targeting international tourists, particularly from Asia and Europe, will enhance the market’s growth, bringing in a diverse array of visitors.
- Strategic partnerships between casino operators, hospitality providers, and entertainment companies will create unique offerings and experiences, driving visitor engagement and market expansion.
Request a Free Sample
Fill in your details and we'll send you a free sample report.
- Sample data tables & charts
- Research methodology
Need a Custom Version of This Report?
Tailor the scope, geography, or segments to your exact requirements.
- Custom geography or segment scope
- Direct access to our analyst team
Frequently Asked Questions
What is the projected growth of the North America Casino Tourism Market?
What are the main drivers of growth in the North America Casino Tourism Market?
Which regions dominate the North America Casino Tourism Market?
How are technological advancements influencing the casino tourism market?
What role does responsible gambling play in the North America Casino Tourism Market?
Table of Content
Chapter 1. Report Introduction
- 1.1 Report Description & Purpose
- 1.1.1 Report Title & Market Definition
- 1.1.2 Unique Selling Propositions (USP) & Key Differentiators
- 1.1.3 Value Proposition for Stakeholders
- 1.2 Research Objectives
- 1.2.1 Market Sizing Objectives (Volume & Revenue)
- 1.2.2 Segmentation Objectives
- 1.2.3 Competitive Intelligence Objectives
- 1.2.4 Forecast & Scenario Objectives
- 1.3 Report Scope
- 1.3.1 North America Casino Tourism Scope – Types & Subtypes Covered
- 1.3.2 Geographic Scope – Regions & Countries Covered
- 1.3.3 Historical Period, Base Year & Forecast Period (2023; forecast to 2032)
- 1.3.4 Inclusions & Exclusions
- 1.4 HS Code & Classification Framework
- 1.5 Currency, Units & Pricing Basis
- 1.6 Target Stakeholders
- 1.7 Limitations & Assumptions
Chapter 2. Executive Summary
- 2.1 Global North America Casino Tourism Market Snapshot
- 2.1.1 Market Size – Historical (2023) & Forecast (2023-2032) (2023: USD 11,932.86 million → 2032: USD 21,340.11 million)
- 2.1.2 Volume & Revenue – Global Totals
- 2.1.3 Key Market Highlights – Top Five Facts
- 2.2 North America Casino Tourism Market Segmentation Snapshot
- 2.2.1 Market Split by Region – 2023 vs. 2032
- 2.3 Competitive Snapshot
- 2.3.1 Top 10 Players by Revenue Share – 2023
- 2.3.2 Top 10 Players by Volume Share – 2023
- 2.3.3 Recent Strategic Developments (18-Month Summary)
- 2.4 Key Investment Highlights & Strategic Conclusions
Chapter 3. North America Casino Tourism Market Dynamics & Industry Analysis
- 3.1 Market Overview & Context
- 3.1.1 North America Casino Tourism Market Position in the Broader Automotive Value Chain
- 3.1.2 OEM vs. Replacement Market Dynamics
- 3.1.3 Market Maturity & Development Stage by Region
- 3.2 North America Casino Tourism Market Drivers
- 3.3 North America Casino Tourism Market Restraints & Challenges
- 3.4 North America Casino Tourism Market Opportunities
- 3.5 Porter's Five Forces Analysis
- 3.5.1 Threat of New Entrants
- 3.5.2 Bargaining Power of Suppliers
- 3.5.3 Bargaining Power of Buyers
- 3.5.4 Threat of Substitutes
- 3.5.5 Competitive Rivalry – Intensity Assessment
- 3.6 North America Casino Tourism Value Chain Analysis
- 3.6.1 Upstream – Raw Material/Input Suppliers
- 3.6.1.1 Raw Material/Input 1
- 3.6.1.2 Raw Material/Input 2
- 3.6.1.3 Raw Material/Input 3
- 3.6.2 Midstream – Production/Manufacturing/Service Delivery
- 3.6.2.1 Production/Process Overview
- 3.6.2.2 Key Facility Locations & Capacity by Manufacturer
- 3.6.3 Downstream – Distribution & End Consumer
- 3.6.3.1 Primary Channel – B2B/OEM
- 3.6.3.2 Secondary Channels – Dealer, Retail, Online, Direct
- 3.6.4 Value Chain Profitability Analysis
- 3.6.1 Upstream – Raw Material/Input Suppliers
- 3.7 PESTEL Analysis
- 3.7.1 Political Factors
- 3.7.2 Economic Factors
- 3.7.3 Social Factors
- 3.7.4 Technological Factors
- 3.7.5 Environmental Factors
- 3.7.6 Legal Factors
- 3.8 North America Casino Tourism Supply Chain Analysis
- 3.8.1 Raw Material/Input Supply Risk Assessment
- 3.8.2 Manufacturing Concentration Risk (Geographic Exposure)
- 3.8.3 Trade Disruption Impact Analysis
- 3.9 Regulatory & Policy Landscape
Note: The regulatory and policy landscape section covers regulations based on their applicability to the market, North America Casino Tourism category, geography, and scope of the study. Only regulatory frameworks with a material impact on operations, compliance, trade, sustainability, or market access are analyzed in detail.
Chapter 4. Key Investment Pockets & Opportunity Analysis
- 4.1 North America Casino Tourism Market Attractiveness Analysis
- 4.1.1 By Region – Investment Attractiveness Matrix (Volume × CAGR)
- 4.2 Absolute Revenue Growth Opportunity
- 4.2.1 By Region – Absolute USD Growth Through 2032
- 4.3 Incremental Volume Opportunity
- 4.3.1 By Region – Incremental Volume Through 2032
- 4.3.2 Segment – Incremental Volume
- 4.4 Emerging Submarket Opportunity Deep Dive (Subject to Applicability)
- 4.5 Emerging Market Opportunity Scorecards
- 4.5.1 United States
- 4.5.2 Europe
- 4.5.3 Asia
- 4.5.4 Middle East & Africa
Note: Emerging Market Opportunity Scorecards will be included based on relevance and strategic importance. Regions listed are indicative and may vary depending on data availability and market dynamics.
Chapter 5. North America Casino Tourism Import-Export Analysis & Trade Flows
- 5.1 Global Trade Overview
- 5.1.1 Global Export Value by Country (2023)
- 5.1.2 Global Export Volume by Country (2023)
- 5.1.3 Global Import Value by Country (2023)
- 5.1.4 Global Import Volume by Country (2023)
- 5.1.5 Net Trade Balance by Country (2023)
- 5.2 Export Analysis – Segment
- 5.2.1 Type 1 (HS Code)
- 5.2.2 Type 2 (HS Code)
- 5.2.3 Type 3 (HS Code)
- 5.2.4 Type 4 (HS Code)
- 5.2.5 Type 5 (HS Code)
- 5.3 Import Analysis – Segment
- 5.3.1 Type 1 (HS Code)
- 5.3.2 Type 2 (HS Code)
- 5.3.3 Type 3 (HS Code)
- 5.3.4 Type 4 (HS Code)
- 5.3.5 Type 5 (HS Code)
- 5.4 Average Unit Trade Prices
- 5.4.1 Average Export Price – Segment & Country
- 5.4.2 Average Import Price – Segment & Source Country
- 5.4.3 Price Trends (2023)
- 5.5 Key Trade Route Analysis
- 5.5.1 Trade Route 1
- 5.5.2 Trade Route 2
- 5.5.3 Trade Route 3
- 5.5.4 Trade Route 4
- 5.5.5 Trade Route 5
- 5.6 Trade Policy Impact Assessment
- 5.6.1 US Anti-Dumping & Section 301 Tariffs
- 5.6.2 EU Customs Union Impact
- 5.6.3 Major Free Trade Agreements
- 5.6.4 USMCA Rules of Origin
Note: Trade policy analysis will be included only where relevant to the North America Casino Tourism market.
Chapter 6. Competitive Landscape & Company Benchmarking
- 6.1 North America Casino Tourism Market Concentration & Structure
- 6.1.1 Herfindahl-Hirschman Index (HHI) – vs. 2023
- 6.1.2 Tier 1, Tier 2 & Tier 3 Market Structure
- 6.1.3 Global, Regional & Local Player Dynamics
- 6.2 North America Casino Tourism Market Share Analysis – 2023
- 6.2.1 Global Revenue Share by Company
- 6.2.2 Global Volume Share by Company
- 6.2.3 Regional Revenue Share
- 6.2.4 Market Share Evolution ( vs. 2023)
- 6.2.5 OEM Segment Share by Company
- 6.2.6 Replacement Segment Share by Company
- 6.3 Production/Delivery Capacity & Facility Analysis
- 6.3.1 Global Installed Capacity
- 6.3.2 Capacity Utilization Rates
- 6.3.3 Production/Output Volume
- 6.3.4 Facility Locations & Capacity Map
- 6.3.5 Planned Capacity Additions
- 6.4 North America Casino Tourism Competitive Benchmarking Matrix
- 6.4.1 Revenue, Volume, CAGR & Profitability Comparison
- 6.4.2 Channel Revenue Mix
- 6.4.3 Geographic Revenue Exposure
- 6.4.4 R&D Intensity
- 6.4.5 Sustainability Maturity
- 6.5 Strategic Developments in North America Casino Tourism (Last 24 Months)
- 6.5.1 Mergers, Acquisitions & Divestments
- 6.5.2 New North America Casino Tourism Launches
- 6.5.3 Facility Expansions
- 6.5.4 Strategic Alliances, Joint Ventures & Partnerships
- 6.5.5 Distribution Expansion & Market Entry
- 6.5.6 Sustainability & ESG Initiatives
- 6.6 Competitive Strategy Mapping
- 6.6.1 Leader, Challenger, Follower & Niche Classification
- 6.6.2 Pricing Strategy Comparison
- 6.6.3 Channel Strategy Matrix
Note: Strategic developments are included based on their materiality and the availability of reliable information.
Chapter 7. Global North America Casino Tourism Market – By Distribution Channel
- 7.1 Segment Overview
- 7.1.1 Volume & Revenue Split by Channel (2023 & 2032)
- 7.1.2 Channel Mix Evolution (2023-2032)
Chapter 8. Regional Market Analysis – Global Overview
- 8.1 Global Regional Overview
- 8.1.1 Regional Volume Share
- 8.1.2 Regional Revenue Share
- 8.1.3 Regional Volume by Region
- 8.1.4 Regional Revenue by Region
- 8.1.5 Regional Forecast Through 2032
- 8.2 Cross-Regional Segment Analysis
- 8.2.1 By Distribution Channel
- 8.2.2 By Brand/Price Tier
Chapter 9. North America North America Casino Tourism Market
- 9.1 United States
- 9.2 Canada
- 9.3 Mexico
Chapter 10. Europe North America Casino Tourism Market
- 10.1 Germany
- 10.2 France
- 10.3 Italy
- 10.4 United Kingdom
- 10.5 Spain
- 10.6 Poland
- 10.7 Russia
- 10.8 Netherlands
- 10.9 Belgium
- 10.10 Sweden
- 10.11 Denmark
- 10.12 Norway
- 10.13 Rest of Europe
Chapter 11. Asia Pacific North America Casino Tourism Market
- 11.1 China
- 11.2 India
- 11.3 Japan
- 11.4 South Korea
- 11.5 Thailand
- 11.6 Indonesia
- 11.7 Vietnam
- 11.8 Malaysia
- 11.9 Australia
- 11.10 Rest of Asia Pacific
Chapter 12. Latin America North America Casino Tourism Market
- 12.1 Brazil
- 12.2 Argentina
- 12.3 Colombia
- 12.4 Chile
- 12.5 Rest of Latin America
Chapter 13. Middle East North America Casino Tourism Market
- 13.1 Saudi Arabia
- 13.2 United Arab Emirates
- 13.3 Turkey
- 13.4 Israel
- 13.5 Iran
- 13.6 Rest of the Middle East
Chapter 14. Africa North America Casino Tourism Market
- 14.1 South Africa
- 14.2 Egypt
- 14.3 Nigeria
- 14.4 Morocco
- 14.5 Rest of Africa
Chapter 15. North America Casino Tourism Company Profiles
- 15.1 [Company 01]
- 15.1.1 Company Overview
- 15.1.2 Key Management Personnel
- 15.1.3 Products & Services Portfolio
- 15.1.4 Financial Performance
- 15.1.5 Key Market Focus & Geographic Presence
- 15.1.6 Recent Developments & Strategic Initiatives
Note: The company profile list is preliminary and may change based on research findings, market developments, data availability, and client requirements.
Chapter 16. Appendices
- Appendix A – List of Abbreviations & Acronyms
- Appendix B – Industry Classification Code Reference – Full Series
- Appendix C – Production & Capacity Data Tables
- Appendix D – End-Use & Demand Base Tables
- Appendix E – Consumption & Replacement Rate Assumptions
- Appendix F – ASP Reference Tables
- Appendix G – Manufacturing & Facility Database
- Appendix H – Import-Export Data Tables
- Appendix I – Regulatory Summary Tables
- Appendix J – Primary Research Participant List (Anonymized)
- Appendix K – Primary Research Questionnaire Framework
- Appendix L – Data Sources & Bibliography
- Appendix M – Market Size Divergence & Source Comparison
Chapter 17. Research Methodology
- 17.1 Research Framework & Philosophy
- 17.2 Secondary Research – Sources, Hierarchy & Data Extraction
- 17.3 Data Modeling – Bottom-Up & Top-Down Market Sizing
- 17.4 Primary Research – Stakeholder Framework, LOI & Sample Sizes
- 17.5 Forecast Methodology – Regression, Scenario & Sensitivity Analysis
- 17.6 Quality Control – Four-Layer Validation Framework
- 17.7 Limitations & Standard Assumptions
- 17.8 Disclaimer
