
Market Overview:
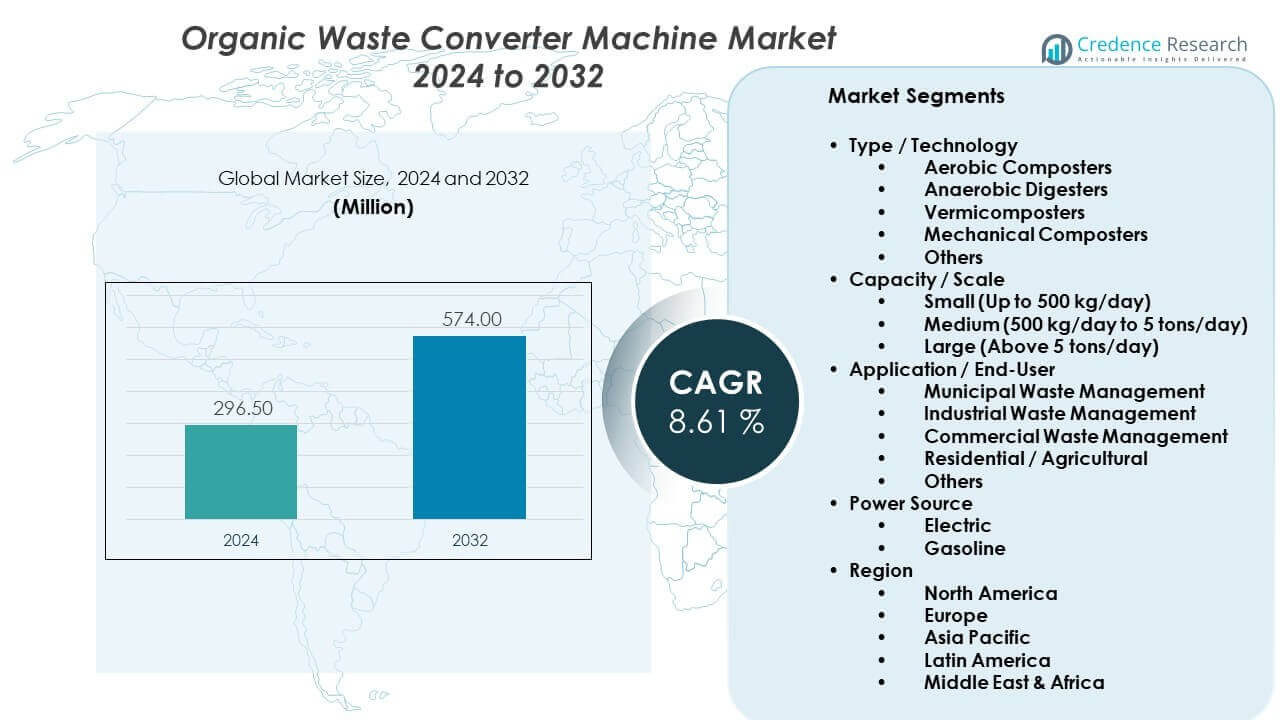
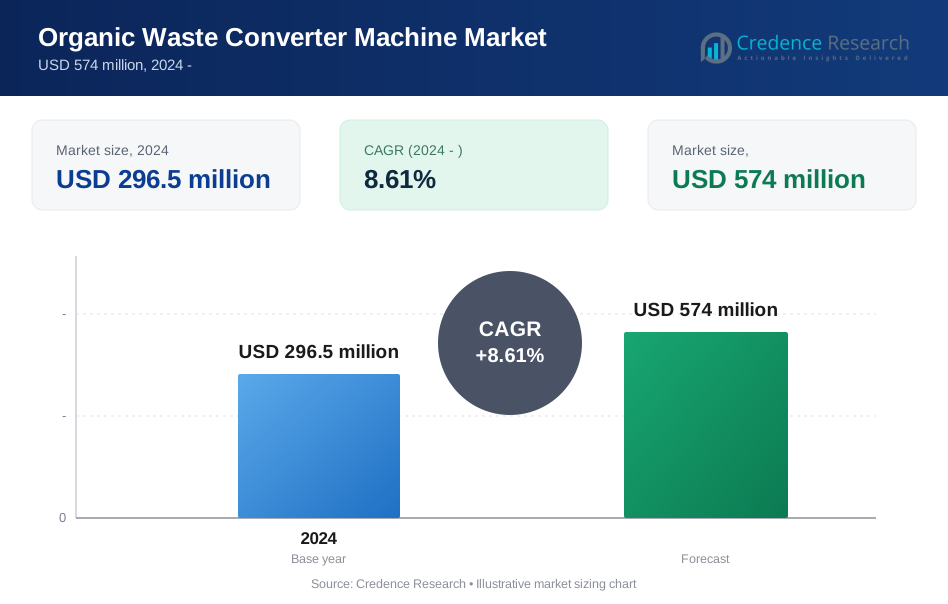
The Organic waste converter machine market is projected to grow from USD 296.5 million in 2024 to an estimated USD 574 million by 2032. The market is expected to register a compound annual growth rate of 8.61% from 2024 to 2032.
| REPORT ATTRIBUTE | DETAILS |
|---|---|
| Historical Period | 2020-2023 |
| Base Year | 2024 |
| Forecast Period | 2025-2032 |
| Organic Waste Converter Machine Market Size 2024 | USD 296.5 million |
| Organic Waste Converter Machine Market, CAGR | 8.61% |
| Organic Waste Converter Machine Market Size 2032 | USD 574 million |
Market growth is driven by rising organic waste volumes from households, food services, and agriculture. Municipal bodies promote on-site waste processing to cut transport and disposal costs. Businesses adopt converter machines to meet waste compliance rules and sustainability targets. Hotels, hospitals, and campuses prefer automated systems for faster waste reduction. Technology advances improve odor control, energy use, and processing speed. Growing compost demand also supports machine adoption. These factors together strengthen steady market expansion across end-user segments.
Asia Pacific leads the market due to rapid urban growth and strong waste management reforms. Countries like India and China push decentralized waste processing solutions. Europe follows, driven by strict landfill rules and circular economy goals. North America shows steady adoption from commercial users and local governments. Emerging markets in Latin America and the Middle East gain traction through smart city projects. Limited landfill capacity and public awareness drive regional uptake. These dynamics shape global market penetration patterns.
Market Insights:
- The market reached USD 296.5 million in 2024 and is projected to hit USD 574 million by 2032, expanding at a CAGR of 8.61%, driven by decentralized waste processing demand.
- Asia Pacific leads with about 35% share due to rapid urbanization, followed by North America at nearly 25% from strong compliance norms, and Europe at around 22% supported by circular economy policies.
- Asia Pacific also stands as the fastest-growing region with a 35% share, supported by government waste reforms, high population density, and cost-effective local manufacturing.
- By application, municipal waste management dominates with roughly 40% share due to city-led waste treatment programs, while commercial waste management holds close to 28% driven by hotels, malls, and institutions.
- By capacity, medium-scale systems account for nearly 45% share due to suitability for commercial and institutional users, while small-scale units represent about 30% driven by residential and compact facilities.
Market Drivers:
Rising Urban Waste Volumes And Pressure On Municipal Disposal Systems
The Organic waste converter machine market gains momentum from rising urban organic waste volumes. Cities face daily pressure to handle food and green waste. Local bodies push on-site treatment to reduce transport loads. These machines help shrink waste volume within hours. They lower dependence on landfills and dumping grounds. Many cities face land scarcity for new disposal sites. This constraint supports faster equipment adoption. Waste reduction goals also support steady demand.
- For instance, Veolia reports that decentralized organic waste treatment systems can reduce organic waste volume by more than 80% within 24 hours at municipal facilities. Waste reduction goals also support steady demand.
Stricter Environmental Rules And Mandatory Waste Segregation Policies
Governments enforce strict rules on organic waste handling. Many regions mandate source-level segregation and processing. The Organic waste converter machine market benefits from these policies. It supports compliance for hotels, malls, and institutions. Penalties for non-compliance push faster investment. Regulators prefer decentralized treatment over central dumping. This approach cuts emissions and odor issues. Policy clarity improves buyer confidence across sectors.
- For instance, European Commission data shows mandatory bio-waste separation across EU member states, covering over 200 million urban residents by 2023. Policy clarity improves buyer confidence across sectors.
Cost Control Needs Across Commercial And Institutional Waste Generators
Businesses aim to cut waste transport and tipping fees. Converter machines reduce recurring disposal expenses. Hospitals and campuses value predictable waste handling costs. These systems limit reliance on third-party contractors. Compost output also creates minor cost recovery options. Budget planning improves with in-house waste treatment. Operational savings attract mid-size facilities. This driver supports long-term installations.
Corporate Sustainability Targets And ESG Reporting Commitments
Companies face rising pressure to meet sustainability goals. Waste reduction forms a key ESG metric. The Organic waste converter machine market aligns with internal waste audits. It helps firms show measurable waste diversion. Many brands publish sustainability reports annually. In-house processing strengthens reported impact claims. Green certifications also support machine adoption. Corporate demand remains a strong driver.
Market Trends:
Growing Preference For Fully Automated And Low-Odor Processing Systems
Users prefer machines with minimal manual handling. Automation improves safety and hygiene at sites. The Organic waste converter machine market reflects this shift. Sensors and timers improve process control. Odor suppression features gain strong buyer focus. Quiet operation suits residential and commercial zones. Automation reduces training needs for staff. This trend supports premium equipment demand.
- For instance, Oklin International Ltd states its automated systems reduce odor levels by over 90% through enclosed aerobic processing and bio-filtration. Automation reduces training needs for staff.
Integration Of Smart Monitoring And Remote Performance Tracking
Smart dashboards gain interest among operators. Users track cycles, output, and faults remotely. This feature supports maintenance planning. The Organic waste converter machine market sees rising digital features. Alerts reduce downtime and service delays. Facility managers prefer data-driven oversight. Remote access supports multi-site operations. Digital tools raise product differentiation.
Rising Demand From Compact And Space-Constrained Facilities
Smaller machines gain traction in dense cities. Apartments and small hotels seek compact designs. Space efficiency drives product redesign. The Organic waste converter machine market adapts to this need. Modular units allow flexible placement. Noise control suits indoor or basement use. Compact systems expand buyer reach. This trend supports urban adoption.
Shift Toward Energy-Efficient And Faster Processing Technologies
Buyers evaluate power use closely. Energy-efficient motors gain preference. Faster cycles improve daily waste handling. The Organic waste converter machine market reflects efficiency upgrades. Lower energy bills support long-term savings. Improved heat management boosts performance. Vendors highlight operating cost benefits. Efficiency becomes a key buying factor.
Market Challenges Analysis:
High Initial Equipment Cost And Budget Constraints For Small Users
High upfront cost limits adoption among small buyers. Many facilities operate on tight budgets. The Organic waste converter machine market faces this restraint. Return on investment varies by waste volume. Smaller sites struggle to justify capital spend. Financing options remain limited in many regions. Cost concerns slow purchase decisions. This challenge affects market penetration pace.
Operational Complexity And Need For Skilled Maintenance Support
Machines require proper operation and upkeep. Poor handling affects output quality. The Organic waste converter machine market faces service gaps. Skilled technicians remain scarce in some regions. Maintenance delays raise downtime risks. Spare parts access also varies by supplier. Users fear performance inconsistency. These issues challenge buyer confidence.
Market Opportunities:
Expansion Of Smart Cities And Decentralized Waste Processing Projects
Smart city programs create strong demand potential. Local governments fund on-site waste solutions. The Organic waste converter machine market aligns with these goals. Decentralized systems reduce transport emissions. Public facilities serve as early adopters. Pilot projects boost wider acceptance. Policy funding lowers entry barriers. This opportunity supports long-term growth.
Rising Adoption In Emerging Economies With Urban Infrastructure Gaps
Emerging regions face rapid urban waste growth. Centralized systems struggle to scale. The Organic waste converter machine market meets local needs. Compact systems suit mixed-use developments. Awareness campaigns improve acceptance rates. Private builders adopt machines in new projects. Local manufacturing reduces cost barriers. These markets offer strong expansion potential.
Market Segmentation Analysis:
Type / Technology
The Organic waste converter machine market shows clear variation across technology types. Aerobic composters hold wide acceptance due to simple operation and faster waste breakdown. Anaerobic digesters attract interest where biogas recovery supports energy goals. Vermicomposters serve niche demand in agriculture and small communities. Mechanical composters gain traction for rapid volume reduction in space-limited sites. Other technologies support specialized waste streams and pilot projects. Technology choice depends on waste type, output needs, and operating control. Buyers prioritize reliability and ease of use.
Capacity / Scale
Capacity-based demand reflects waste volume patterns across users. Small systems suit apartments, schools, and small hotels. Medium units dominate commercial and institutional facilities with steady waste flow. Large-scale machines support municipal and industrial waste programs. Scale selection affects cost efficiency and processing speed. Buyers assess daily waste load before investment. Flexible capacity options improve market reach. This segmentation supports diverse adoption profiles.
- For instance, Waste Management, Inc highlights that medium-capacity on-site organic processors handle consistent daily loads for commercial facilities without off-site hauling. Flexible capacity options improve market reach.
Application / End-User
Municipal waste management drives bulk demand through decentralized processing models. Industrial users adopt machines to manage canteen and process waste. Commercial facilities prefer on-site treatment for cost control. Residential and agricultural users value compost reuse. Other applications include healthcare and food processing units. End-user choice shapes system size and automation level. Compliance needs influence buying decisions.
Power Source
Electric models dominate due to clean operation and easy integration. Gasoline-powered units serve remote or off-grid locations. Power choice depends on infrastructure access and cost control. This segment supports varied deployment environments.
Segmentation:
Type / Technology- Aerobic Composters
- Anaerobic Digesters
- Vermicomposters
- Mechanical Composters
- Others
- Small (Up to 500 kg/day)
- Medium (500 kg/day to 5 tons/day)
- Large (Above 5 tons/day)
- Municipal Waste Management
- Industrial Waste Management
- Commercial Waste Management
- Residential / Agricultural
- Others
- Electric
- Gasoline
- North America
- U.S.
- Canada
- Mexico
- Europe
- Germany
- France
- U.K.
- Italy
- Spain
- Rest of Europe
- Asia Pacific
- China
- Japan
- India
- South Korea
- South-east Asia
- Rest of Asia Pacific
- Latin America
- Brazil
- Argentina
- Rest of Latin America
- Middle East & Africa
- GCC Countries
- South Africa
- Rest of the Middle East and Africa
Regional Analysis:
Asia Pacific
Asia Pacific holds about 35% market share and leads global adoption. Rapid urban growth increases daily organic waste volumes. Governments promote decentralized waste processing systems across cities. The Organic waste converter machine market benefits from public sanitation programs. Commercial complexes adopt machines to meet local waste rules. Cost-effective manufacturing supports wider equipment access. Strong policy backing sustains regional demand.
North America And Europe
North America accounts for nearly 25% market share with stable demand. Strict waste disposal rules drive equipment purchases. Commercial and municipal users invest in on-site treatment systems. The Organic waste converter machine market gains support from sustainability targets. Europe follows with around 22% share driven by circular economy policies. Source segregation rules strengthen machine deployment. Mature infrastructure ensures steady replacement demand.
Latin America And Middle East & Africa
Latin America represents close to 10% market share with gradual uptake. Urban authorities seek alternatives to landfill disposal. Pilot projects support early market penetration. The Organic waste converter machine market shows rising interest from commercial users. Middle East & Africa hold about 8% share with selective adoption. Hospitality and smart city projects drive demand. Policy support shapes long-term regional growth.
Key Player Analysis:
- Oklin International Ltd
- Joraform AB
- ECO BOT (Asia) Pte Ltd
- Veolia
- Waste Management, Inc
Competitive Analysis:
The Organic waste converter machine market shows moderate fragmentation with global and regional players competing on technology and service reach. Leading companies focus on durable systems, faster processing cycles, and low-odor performance. It favors vendors with strong after-sales support and local installation capability. Product differentiation relies on automation levels, capacity range, and energy efficiency. Strategic pricing helps firms address municipal and commercial buyers. Partnerships with local authorities improve project access. Competitive strength depends on reliability, compliance support, and lifecycle cost control.
Recent Developments:
- In February 2025, ECO BOT (Asia) Pte Ltd’s technology was adopted by Energus, a UK-based corporate venue and training centre, to enhance its net-zero sustainability strategy. Energus announced it had become one of the first companies in its county to install the "Eco Bot" waste disposal machine, which dries and sanitizes organic waste to reduce its volume by approximately 80%. This installation aligns with compliance requirements for the 2021 Environment Act, positioning Eco Bot as a key solution for businesses needing to segregate and process food waste on-site.
- In September 2024, Veolia secured a significant joint waste, recycling, and street cleansing contract with North Herts and East Herts Councils in the United Kingdom, set to commence in May 2025. As part of this new partnership, Veolia will manage the continued weekly food waste collection service for North Herts and oversee the introduction of a new separate weekly food waste collection service for East Herts. This contract highlights Veolia's role in scaling municipal organic waste infrastructure to meet stricter recycling mandates across Europe.
- In May 2024, Oklin International Ltd showcased its latest advancements in composting technology at the IFAT Munich trade fair, a leading global event for environmental technologies. During this period, the company highlighted the deployment of its commercial composting solutions, including the installation of 90 units of the GG02 model in public schools across Hong Kong. These machines, designed to turn food waste into compost within 24 hours, demonstrate Oklin's expanding footprint in the educational and institutional sectors, reinforcing its commitment to decentralized organic waste management.
- In late 2023, Joraform AB saw its commercial composting technology deployed at high-profile sustainability projects, such as the installation of the JK6200 machine at Dromoland Castle in Ireland. This installation, facilitated by local partners, allows the estate to process approximately 40 tonnes of food waste annually on-site, converting it into nutrient-rich compost for use in the castle’s gardens. This move underscores Joraform's continued relevance in the European market for "rotating" dual-chamber composters that cater to the hospitality and commercial sectors.
Report Coverage:
The research report offers an in-depth analysis based on Type / Technology, Capacity / Scale, Application / End-User, Power Source, and Region. It details leading market players, providing an overview of their business, product offerings, investments, revenue streams, and key applications. Additionally, the report includes insights into the competitive environment, SWOT analysis, current market trends, as well as the primary drivers and constraints. Furthermore, it discusses various factors that have driven market expansion in recent years. The report also explores market dynamics, regulatory scenarios, and technological advancements that are shaping the industry. It assesses the impact of external factors and global economic changes on market growth. Lastly, it provides strategic recommendations for new entrants and established companies to navigate the complexities of the market.
Future Outlook:
- Urban decentralization policies will continue to increase demand for on-site organic waste treatment solutions.
- Automation will gain stronger preference across commercial and institutional installations.
- Compact and modular systems will support adoption in space-constrained urban facilities.
- Smart monitoring features will improve operational visibility and maintenance planning.
- Municipal waste programs will remain the largest source of equipment demand.
- Commercial kitchens and hospitality facilities will drive steady replacement cycles.
- Energy-efficient designs will influence purchasing decisions across cost-sensitive buyers.
- Emerging economies will attract new local manufacturers and assembly partners.
- After-sales service capability will shape long-term vendor competitiveness.
- Corporate sustainability reporting will reinforce consistent demand for converter machines.
Request a Free Sample
Fill in your details and we'll send you a free sample report.
- Sample data tables & charts
- Research methodology
Need a Custom Version of This Report?
Tailor the scope, geography, or segments to your exact requirements.
- Custom geography or segment scope
- Direct access to our analyst team
Frequently Asked Questions
What is the current market size for Organic waste converter machine market, and what is its projected size in 2032?
At what Compound Annual Growth Rate is the Organic waste converter machine market projected to grow between 2025 and 2032?
Which Organic waste converter machine market segment held the largest share in 2024?
What are the primary factors fueling the growth of the Organic waste converter machine market?
Who are the leading companies in the Organic waste converter machine market?
Which region commanded the largest share of the Organic waste converter machine market in 2024?
Table of Content
Chapter 1. Report Introduction
- 1.1 Report Description & Purpose
- 1.1.1 Report Title & Market Definition
- 1.1.2 Unique Selling Propositions (USP) & Key Differentiators
- 1.1.3 Value Proposition for Stakeholders
- 1.2 Research Objectives
- 1.2.1 Market Sizing Objectives (Volume & Revenue) (Volume Where Applicable)
- 1.2.2 Segmentation Objectives
- 1.2.3 Competitive Intelligence Objectives
- 1.2.4 Forecast & Scenario Objectives
- 1.3 Report Scope
- 1.3.1 Organic Waste Converter Machine Scope – Segments & Subsegments Covered
- 1.3.2 Geographic Scope – Regions & Countries Covered
- 1.3.3 Historical Period, Base Year & Forecast Period (2024; forecast to 2032)
- 1.3.4 Inclusions & Exclusions
- 1.4 Industry Classification & Applicable Codes
- 1.5 Currency, Measurement Units & Valuation Basis
- 1.6 Target Stakeholders
- 1.7 Limitations & Assumptions
Chapter 2. Executive Summary
- 2.1 Global Organic Waste Converter Machine Market Snapshot
- 2.1.1 Market Size – Historical (2024) & Forecast (2024-2032) (2024: USD 296.5 million → 2032: USD 574 million)
- 2.1.2 Volume & Revenue – Global Totals (Volume Where Applicable)
- 2.1.3 Key Market Highlights – Top Five Facts
- 2.2 Organic Waste Converter Machine Market Segmentation Snapshot
- 2.2.1 Market Split by Region – 2024 vs. 2032
- 2.3 Competitive Snapshot
- 2.3.1 Top 10 Players by Revenue Share – 2024
- 2.3.2 Top 10 Players by Volume Share – 2024 (Volume Where Applicable)
- 2.3.3 Recent Strategic Developments (18-Month Summary)
- 2.4 Key Investment Highlights & Strategic Conclusions
Chapter 3. Organic Waste Converter Machine Market Dynamics & Industry Analysis
- 3.1 Market Overview & Context
- 3.1.1 Organic Waste Converter Machine Market Position in the Broader Industry Value Chain
- 3.1.2 Demand Structure & Purchasing Dynamics
- 3.1.3 Market Maturity & Development Stage by Region
- 3.2 Organic Waste Converter Machine Market Drivers
- 3.3 Organic Waste Converter Machine Market Restraints & Challenges
- 3.4 Organic Waste Converter Machine Market Opportunities
- 3.5 Porter's Five Forces Analysis
- 3.5.1 Threat of New Entrants
- 3.5.2 Bargaining Power of Suppliers
- 3.5.3 Bargaining Power of Buyers
- 3.5.4 Threat of Substitutes
- 3.5.5 Competitive Rivalry – Intensity Assessment
- 3.6 Organic Waste Converter Machine Value Chain Analysis
- 3.6.1 Upstream – Key Inputs, Resources & Suppliers
- 3.6.1.1 Key Input/Resource 1
- 3.6.1.2 Key Input/Resource 2
- 3.6.1.3 Key Input/Resource 3
- 3.6.2 Midstream – Core Operations & Value Creation
- 3.6.2.1 Operating Model & Process Overview
- 3.6.2.2 Key Operating Locations & Capabilities by Company
- 3.6.3 Downstream – Market Channels & End Users
- 3.6.3.1 Direct Sales & Customer Engagement Channels
- 3.6.3.2 Indirect Sales, Intermediaries & Partner Channels
- 3.6.4 Value Chain Profitability Analysis
- 3.6.1 Upstream – Key Inputs, Resources & Suppliers
- 3.7 PESTEL Analysis
- 3.7.1 Political Factors
- 3.7.2 Economic Factors
- 3.7.3 Social Factors
- 3.7.4 Technological Factors
- 3.7.5 Environmental Factors
- 3.7.6 Legal Factors
- 3.8 Organic Waste Converter Machine Supply Chain Analysis
- 3.8.1 Critical Input & Resource Availability Risk Assessment
- 3.8.2 Supplier & Operational Concentration Risk (Geographic Exposure)
- 3.8.3 Supply & Service Disruption Impact Analysis
- 3.9 Regulatory & Policy Landscape
Note: The regulatory and policy landscape section covers regulations based on their applicability to the market, Organic Waste Converter Machine category, geography, and scope of the study. Only regulatory frameworks with a material impact on operations, compliance, trade, sustainability, or market access are analyzed in detail.
Chapter 4. Key Investment Pockets & Opportunity Analysis
- 4.1 Organic Waste Converter Machine Market Attractiveness Analysis
- 4.1.1 By Region – Investment Attractiveness Matrix (Market Size × CAGR)
- 4.2 Absolute Revenue Growth Opportunity
- 4.2.1 By Region – Absolute Revenue Growth Through 2032
- 4.3 Incremental Demand Opportunity
- 4.3.1 By Region – Incremental Demand Through 2032
- 4.3.2 Segment – Incremental Demand
- 4.4 Emerging Submarket Opportunity Deep Dive (Subject to Applicability)
- 4.5 Priority Market Opportunity Scorecards
- 4.5.1 United States
- 4.5.2 Europe
- 4.5.3 Asia
- 4.5.4 Middle East & Africa
Note: Priority market opportunity scorecards reflect the geographic scope and strategic relevance of the study. Listed markets are indicative and may be adapted to the industry.
Chapter 5. Organic Waste Converter Machine Cross-Border Trade & Market Access Analysis
- 5.1 International Trade & Cross-Border Activity Overview
- 5.1.1 Global Export Value by Country (2024)
- 5.1.2 Global Export Volume by Country (2024) (Volume Where Applicable)
- 5.1.3 Global Import Value by Country (2024)
- 5.1.4 Global Import Volume by Country (2024) (Volume Where Applicable)
- 5.1.5 Net Trade Balance by Country (2024)
- 5.2 Export Analysis – Segment
- 5.2.1 Category 1 (Applicable Classification Code)
- 5.2.2 Category 2 (Applicable Classification Code)
- 5.2.3 Category 3 (Applicable Classification Code)
- 5.2.4 Category 4 (Applicable Classification Code)
- 5.2.5 Category 5 (Applicable Classification Code)
- 5.3 Import Analysis – Segment
- 5.3.1 Category 1 (Applicable Classification Code)
- 5.3.2 Category 2 (Applicable Classification Code)
- 5.3.3 Category 3 (Applicable Classification Code)
- 5.3.4 Category 4 (Applicable Classification Code)
- 5.3.5 Category 5 (Applicable Classification Code)
- 5.4 Cross-Border Pricing & Transaction Benchmarks
- 5.4.1 Export Pricing – Segment & Country
- 5.4.2 Import Pricing – Segment & Source Country
- 5.4.3 Price Trends (2024)
- 5.5 Key Cross-Border Trade & Delivery Routes
- 5.5.1 Cross-Border Trade/Delivery Route 1
- 5.5.2 Cross-Border Trade/Delivery Route 2
- 5.5.3 Cross-Border Trade/Delivery Route 3
- 5.5.4 Cross-Border Trade/Delivery Route 4
- 5.5.5 Cross-Border Trade/Delivery Route 5
- 5.6 Trade Policy & Market Access Impact Assessment
- 5.6.1 Tariff & Non-Tariff Barriers
- 5.6.2 Regional Trade & Economic Integration Frameworks
- 5.6.3 Bilateral & Multilateral Trade Agreements
- 5.6.4 Cross-Border Operating, Licensing & Localization Requirements
Note: This chapter applies where cross-border trade or delivery is relevant to Organic Waste Converter Machine. Goods, services, and digital offerings are assessed using applicable classifications and transaction measures. Import-export volumes, trade balances, and route analyses are included only where meaningful to the market.
Chapter 6. Competitive Landscape & Company Benchmarking
- 6.1 Organic Waste Converter Machine Market Concentration & Structure
- 6.1.1 Herfindahl-Hirschman Index (HHI) – vs. 2024
- 6.1.2 Leading, Mid-Sized & Emerging Player Structure
- 6.1.3 Global, Regional & Local Player Dynamics
- 6.2 Organic Waste Converter Machine Market Share Analysis – 2024
- 6.2.1 Global Revenue Share by Company
- 6.2.2 Global Volume Share by Company (Volume Where Applicable)
- 6.2.3 Regional Revenue Share
- 6.2.4 Market Share Evolution ( vs. 2024)
- 6.2.5 Company Market Share by Key Segment
- 6.2.6 Company Market Share by Customer Group
- 6.3 Operating Scale, Capacity & Infrastructure Analysis
- 6.3.1 Global Operating Scale & Supply Capacity
- 6.3.2 Resource Utilization & Operating Efficiency
- 6.3.3 Output, Service Delivery & Activity Metrics
- 6.3.4 Operating Footprint & Infrastructure Map
- 6.3.5 Planned Operational & Capacity Expansion
- 6.4 Organic Waste Converter Machine Competitive Benchmarking Matrix
- 6.4.1 Revenue, Growth, Profitability & Operating Metric Comparison
- 6.4.2 Channel Revenue Mix
- 6.4.3 Geographic Revenue Exposure
- 6.4.4 R&D Intensity
- 6.4.5 Sustainability Maturity
- 6.5 Strategic Developments in Organic Waste Converter Machine (Last 24 Months)
- 6.5.1 Mergers, Acquisitions & Divestments
- 6.5.2 New Products, Services & Solutions in Organic Waste Converter Machine
- 6.5.3 Operational & Infrastructure Expansions
- 6.5.4 Strategic Alliances, Joint Ventures & Partnerships
- 6.5.5 Distribution Expansion & Market Entry
- 6.5.6 Sustainability & ESG Initiatives
- 6.6 Competitive Strategy Mapping
- 6.6.1 Leader, Challenger, Follower & Niche Classification
- 6.6.2 Pricing Strategy Comparison
- 6.6.3 Channel Strategy Matrix
Note: Strategic developments are included based on their materiality and the availability of reliable information.
Chapter 7. Global Organic Waste Converter Machine Market – By Sales & Delivery Channel
- 7.1 Segment Overview
- 7.1.1 Volume & Revenue Split by Channel (2024 & 2032) (Volume Where Applicable)
- 7.1.2 Channel Mix Evolution (2024-2032)
Chapter 8. Regional Market Analysis – Global Overview
- 8.1 Global Regional Overview
- 8.1.1 Regional Volume Share (Volume Where Applicable)
- 8.1.2 Regional Revenue Share
- 8.1.3 Regional Volume by Region (Volume Where Applicable)
- 8.1.4 Regional Revenue by Region
- 8.1.5 Regional Forecast Through 2032
- 8.2 Cross-Regional Segment Analysis
- 8.2.1 By Sales & Delivery Channel
- 8.2.2 By Competitive Positioning & Price Tier
Chapter 9. North America Organic Waste Converter Machine Market
- 9.1 United States
- 9.2 Canada
- 9.3 Mexico
Chapter 10. Europe Organic Waste Converter Machine Market
- 10.1 Germany
- 10.2 France
- 10.3 Italy
- 10.4 United Kingdom
- 10.5 Spain
- 10.6 Poland
- 10.7 Russia
- 10.8 Netherlands
- 10.9 Belgium
- 10.10 Sweden
- 10.11 Denmark
- 10.12 Norway
- 10.13 Rest of Europe
Chapter 11. Asia Pacific Organic Waste Converter Machine Market
- 11.1 China
- 11.2 India
- 11.3 Japan
- 11.4 South Korea
- 11.5 Thailand
- 11.6 Indonesia
- 11.7 Vietnam
- 11.8 Malaysia
- 11.9 Australia
- 11.10 Rest of Asia Pacific
Chapter 12. Latin America Organic Waste Converter Machine Market
- 12.1 Brazil
- 12.2 Argentina
- 12.3 Colombia
- 12.4 Chile
- 12.5 Rest of Latin America
Chapter 13. Middle East Organic Waste Converter Machine Market
- 13.1 Saudi Arabia
- 13.2 United Arab Emirates
- 13.3 Turkey
- 13.4 Israel
- 13.5 Iran
- 13.6 Rest of the Middle East
Chapter 14. Africa Organic Waste Converter Machine Market
- 14.1 South Africa
- 14.2 Egypt
- 14.3 Nigeria
- 14.4 Morocco
- 14.5 Rest of Africa
Chapter 15. Organic Waste Converter Machine Company Profiles
- 15.1 [Company 01]
- 15.1.1 Company Overview
- 15.1.2 Key Management Personnel
- 15.1.3 Products & Services Portfolio
- 15.1.4 Financial Performance
- 15.1.5 Key Market Focus & Geographic Presence
- 15.1.6 Recent Developments & Strategic Initiatives
Note: The company profile list is preliminary and may change based on research findings, market developments, data availability, and client requirements.
Chapter 16. Appendices
- Appendix A – List of Abbreviations & Acronyms
- Appendix B – Industry Classification Code Reference – Full Series
- Appendix C – Supply, Output & Operating Capacity Data Tables
- Appendix D – End-Use & Demand Base Tables
- Appendix E – Demand, Adoption & Usage Assumptions
- Appendix F – Pricing & Revenue Metric Reference Tables
- Appendix G – Company Operations & Infrastructure Database
- Appendix H – Cross-Border Trade & Activity Data Tables (Where Applicable)
- Appendix I – Regulatory Summary Tables
- Appendix J – Primary Research Participant List (Anonymized)
- Appendix K – Primary Research Questionnaire Framework
- Appendix L – Data Sources & Bibliography
- Appendix M – Market Size Divergence & Source Comparison
Chapter 17. Research Methodology
- 17.1 Research Framework & Philosophy
- 17.2 Secondary Research – Sources, Hierarchy & Data Extraction
- 17.3 Data Modeling – Bottom-Up & Top-Down Market Sizing
- 17.4 Primary Research – Stakeholder Framework, LOI & Sample Sizes
- 17.5 Forecast Methodology – Regression, Scenario & Sensitivity Analysis
- 17.6 Quality Control – Four-Layer Validation Framework
- 17.7 Limitations & Standard Assumptions
- 17.8 Disclaimer
