
Market Overview
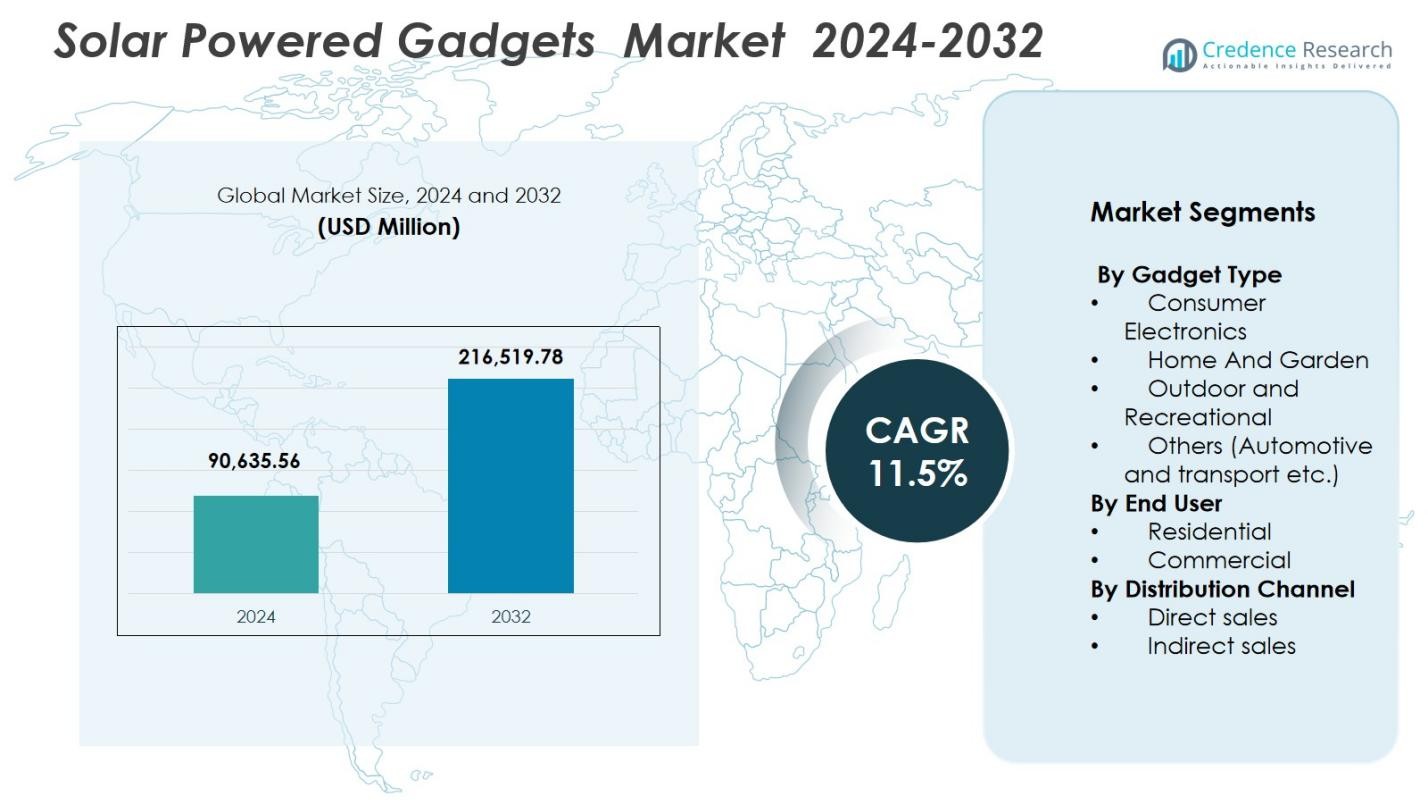
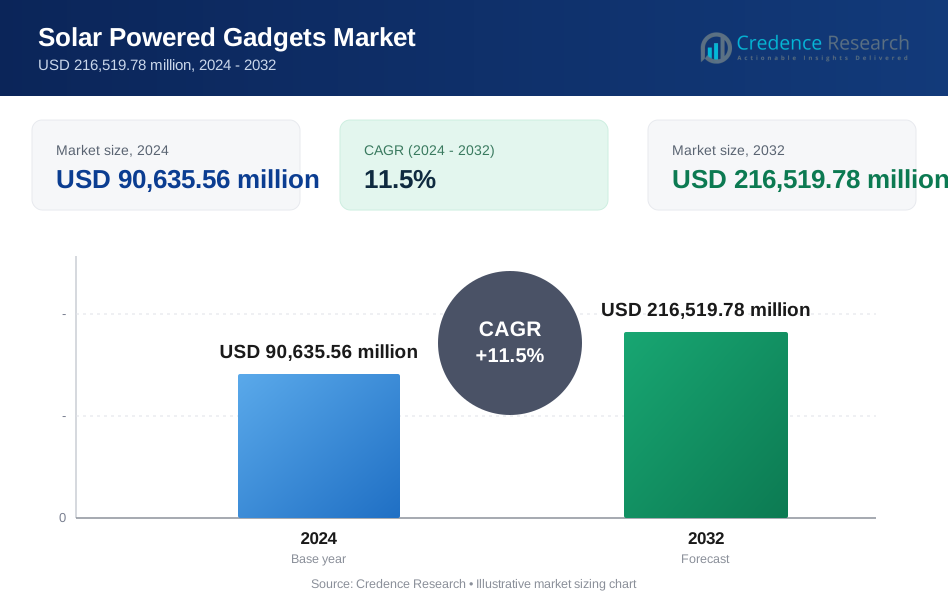
Solar Powered Gadgets market size was valued at USD 90,635.56 Million in 2024 and is anticipated to reach USD 216,519.78 Million by 2032, at a CAGR of 11.5% during the forecast period.
| REPORT ATTRIBUTE | DETAILS |
|---|---|
| Historical Period | 2020-2023 |
| Base Year | 2024 |
| Forecast Period | 2025-2032 |
| Solar Powered Gadgets market Size 2024 | USD 90,635.56 Million |
| Solar Powered Gadgets market , CAGR | 11.5% |
| Solar Powered Gadgets market Size 2032 | USD 216,519.78 Million |
Solar Powered Gadgets market is shaped by leading players such as Garmin, GoSun, Gemma Lighting, Hikvision Digital Technology, INVT Solar Technology, LS VISION Technology, Pvilion, Solar Solutions AG, Soleos, and Sun Surveillance, all focusing on innovative, energy-efficient, and portable solar solutions. These companies strengthen their presence through advancements in solar cells, battery technologies, and smart integrations for consumer, commercial, and outdoor applications. Regionally, North America leads the market with a 31.4% share in 2024, supported by strong sustainability adoption, smart home penetration, and high consumer spending. Europe and Asia-Pacific follow closely, driven by environmental regulations, rising electrification, and expanding outdoor and residential solar gadget usage.
Market Insights
- Solar Powered Gadgets market was valued at USD 90,635.56 million in 2024 and is projected to reach USD 216,519.78 million by 2032, growing at a CAGR of 11.5%.
- Rising demand for portable, energy-efficient consumer electronics and smart home devices drives market growth, with Consumer Electronics holding the largest share at 46.2% in 2024.
- Increasing trends toward IoT-enabled solar gadgets, smart surveillance, and outdoor recreational devices fuel innovation, supported by improvements in solar cell efficiency and battery storage.
- Key players such as Garmin, GoSun, Gemma Lighting, Hikvision Digital Technology, INVT Solar Technology, and Pvilion expand portfolios through advanced designs and product innovation, intensifying market competition.
- North America leads with 31.4% share, followed by Asia-Pacific at 29.8% and Europe at 27.6%, while Latin America and Middle East & Africa show rising adoption driven by off-grid applications and rural electrification needs.
Market Segmentation Analysis
By Gadget Type
The Solar Powered Gadgets market by gadget type is led by Consumer Electronics, accounting for 46.2% of the market in 2024, driven by rising adoption of solar-powered chargers, smartwatches, power banks, and portable lighting devices. Consumers increasingly prefer renewable and off-grid charging solutions, especially for travel and outdoor activities. The Home and Garden segment grows steadily due to demand for solar lights, lawn devices, and security systems. Outdoor and Recreational gadgets benefit from the surge in adventure tourism, while Others, including automotive and transport applications, expand with growing interest in solar-assisted vehicle accessories and telematics equipment.
- For instance, Anker introduced its 625 Solar Panel with 23% conversion efficiency, enabling faster off-grid power generation for its PowerHouse systems.
By End User
The end-user segmentation is dominated by the Residential sector, holding 58.7% share in 2024, supported by strong consumer preference for energy-efficient household products and reduced dependence on grid electricity. Solar-powered lighting, surveillance devices, and portable chargers experience high installation rates in homes, particularly in regions with frequent power outages. The Commercial segment grows with increasing uptake of solar-based security systems, digital signage, and portable operational tools across retail, hospitality, and industrial facilities. Businesses prioritize sustainability commitments and operational cost reductions, accelerating adoption of solar-integrated gadgets across commercial environments.
- For instance, Panasonic introduced solar-powered security and monitoring solutions designed for commercial premises requiring uninterrupted power.
By Distribution Channel
Within distribution channels, Indirect Sales lead the market with 64.9% share in 2024, driven by the dominance of e-commerce, retail chains, specialty stores, and third-party distributors offering a wide range of solar gadgets at competitive prices. Online platforms significantly influence purchasing decisions through product comparisons, reviews, and promotional bundles. Direct Sales continue to grow, supported by OEM websites, B2B contracts, and institutional procurement, particularly for commercial installations. However, indirect channels remain preferred due to broader accessibility, convenience, and extensive product availability across global consumer and commercial markets.
Key Growth Drivers
Rising Consumer Shift Toward Clean and Portable Energy Solutions
Growing awareness of renewable energy benefits and increasing reliance on portable electronics significantly boost demand for solar-powered gadgets. Consumers prefer energy-independent devices such as solar chargers, lanterns, surveillance cameras, and smart home tools, especially in regions facing high electricity costs or unstable grid access. The convenience of off-grid charging for travel, emergency preparedness, and outdoor recreation further accelerates adoption. Government incentives promoting solar adoption, combined with falling photovoltaic module costs, enhance affordability and accessibility. Additionally, the rising emphasis on sustainability encourages consumers to switch from disposable batteries to solar-integrated solutions. Urban households, students, and frequent travelers increasingly view solar gadgets as essential, expanding mainstream demand across both residential and commercial sectors.
- For instance, Anker’s Solar Power Bank (PowerCore Solar 20000) features IP65 durability and high-efficiency solar cells, making it popular among travelers needing off-grid charging.
Technological Advancements in Solar Efficiency and Device Integration
Rapid innovation in photovoltaic materials, battery storage, and energy-harvesting electronics drives the transition toward more efficient and multifunctional solar-powered gadgets. Thin-film PV, perovskite cells, and flexible solar fabrics enable lightweight, compact, and aesthetically appealing gadget designs suitable for wearables, IoT devices, smart home systems, and outdoor tools. Improved lithium-ion and solid-state batteries extend runtime and durability, allowing continuous performance even in low-light conditions. Integration with IoT platforms, Bluetooth connectivity, and smart control apps enhances functionality, enabling real-time monitoring and automated energy optimization. These technological enhancements not only increase efficiency but also expand the range of feasible applications, encouraging manufacturers to expand product portfolios and accelerate innovation cycles.
- For instance, researchers at Oxford PV achieved over 28% efficiency in perovskite-silicon tandem solar cells, demonstrating real potential for high-performance miniature solar modules used in consumer devices.
Growing Adoption in Outdoor, Recreational, and Emergency Preparedness Use Cases
Increasing participation in hiking, camping, adventure tourism, and remote work boosts demand for solar-powered outdoor gadgets such as lanterns, coolers, power banks, and communication devices. These solutions eliminate dependence on fuel-powered generators, enhancing safety, convenience, and sustainability. Emergency response agencies and households also adopt solar-powered radios, floodlights, and backup chargers to improve disaster preparedness as climate-related events become more frequent. Solar-powered security devices are gaining traction in rural and remote zones where grid connectivity is limited. As awareness of energy resilience grows, consumers and organizations prioritize gadgets that ensure uninterrupted functionality, fueling strong long-term market expansion across global outdoor and emergency-use sectors.
Key Trends & Opportunities
Expansion of Smart Solar Gadgets Integrated with IoT and AI
The convergence of solar technology with IoT and AI presents major growth opportunities, enabling smarter, connected devices that optimize energy usage and extend operational lifespan. Solar-powered cameras with AI-based motion detection, smart garden lights with adaptive brightness control, and wearables that track health and solar energy performance illustrate this shift toward intelligent functionality. Manufacturers are investing in cloud-based monitoring systems that allow users to remotely track device performance and energy output. As smart home ecosystems expand globally, solar gadgets that integrate seamlessly with platforms such as Amazon Alexa, Google Home, and proprietary IoT hubs offer strong commercial potential, especially for residential and small business users seeking modern, sustainable technology solutions.
- For instance, Ring (Amazon) offers several outdoor cameras, including the Solar Panel-powered Ring Stick Up Cam (3rd Gen) and the premium Ring Stick Up Cam Pro, which support cloud-linked monitoring via a paid Ring Protect subscription.
Increasing Commercial Applications Across Retail, Security, and Mobility
Commercial environments increasingly adopt solar-powered gadgets to reduce operating costs and improve environmental performance. Retail spaces deploy solar-powered digital signage, POS accessories, and lighting systems to enhance customer engagement while lowering energy consumption. Corporate campuses and industrial sites adopt solar-powered surveillance units and access control devices to strengthen security without extensive cabling. Transportation and mobility sectors explore opportunities in solar-assisted communication systems, telematics modules, and portable fleet tools that support sustainability mandates. As organizations prioritize ESG goals, solar-powered gadgets present practical, scalable solutions, creating new revenue opportunities for manufacturers targeting commercial and institutional markets.
- For instance, connected-operations vendors offer solar-powered gateways and sensor hubs that transmit vehicle and asset data from trailers and remote equipment yards, supporting emissions monitoring and sustainability dashboards for commercial customers.
Key Challenges
Performance Limitations in Low-Sunlight Regions and Weather-Dependent Conditions
Solar-powered gadgets often face challenges in regions with limited sunlight, frequent cloud cover, or extended winters, leading to inconsistent energy generation and reduced device reliability. This dependency restricts adoption in northern latitudes and densely built urban areas where shading obstructs solar exposure. Weather fluctuations also influence charging time, power output, and battery performance, particularly in high-demand gadgets such as surveillance cameras or emergency tools. Users often require supplementary charging methods, increasing product complexity and cost. Addressing performance variability through improved storage, hybrid charging technologies, and higher-efficiency solar materials remains essential to broadening global adoption.
Higher Upfront Costs and Limited Consumer Awareness in Emerging Markets
Despite long-term savings, solar-powered gadgets typically involve higher initial costs due to advanced PV materials, batteries, and integrated electronics. In price-sensitive markets, consumers may hesitate to shift from conventional battery-powered or grid-powered alternatives. Awareness gaps regarding benefits, durability, and total cost of ownership further slow adoption. Limited retail penetration, inadequate product demonstrations, and insufficient aftersales support also affect market expansion in developing regions. Manufacturers must improve affordability through localized production, government collaborations, and value-driven product offerings to overcome this barrier and unlock demand across emerging global markets.
Regional Analysis
North America
North America leads the Solar Powered Gadgets market with 31.4% share in 2024, driven by strong consumer inclination toward sustainable technologies, high spending on smart home devices, and widespread adoption of solar-powered surveillance, lighting, and portable electronics. The U.S. contributes significantly due to robust innovation, advanced retail distribution, and growing outdoor recreation trends. Government programs supporting renewable energy awareness further accelerate adoption. Rising use of solar gadgets in residential security and commercial applications positions the region as a continued demand center, supported by strong technology integration and high acceptance of off-grid energy solutions.
Europe
Europe accounts for 27.6% of the market in 2024, supported by stringent environmental regulations, strong sustainability culture, and rapid adoption of solar-powered consumer and outdoor gadgets. Countries such as Germany, the U.K., and the Netherlands show high penetration of solar lighting, garden systems, and smart surveillance devices. Growth is further fueled by increasing electricity costs, which make energy-independent gadgets financially appealing. Expanding applications in mobility, camping, and recreational activities strengthen regional demand. Strong emphasis on carbon neutrality initiatives and rapid expansion of smart home ecosystems sustains Europe’s strong position in the global market.
Asia-Pacific
Asia-Pacific holds 29.8% market share in 2024, emerging as the fastest-growing region due to large-scale manufacturing capabilities, rising disposable incomes, and expanding rural electrification initiatives. China, India, Japan, and South Korea drive rapid adoption across residential and commercial sectors, especially in portable solar chargers, lanterns, and surveillance systems. Government-led solar programs and subsidies significantly encourage household adoption. Outdoor and recreational gadget demand continues to rise as tourism and adventure activities grow. Strong cost competitiveness and expanding e-commerce penetration make Asia-Pacific a key growth engine for global solar-powered gadget consumption.
Latin America
Latin America captures 6.1% of the market in 2024, with growth supported by increasing demand for solar-powered lighting, chargers, and security devices in regions with unstable grid supply. Brazil, Mexico, and Chile lead adoption due to expanding renewable energy initiatives and improving awareness of portable solar technologies. Rural communities increasingly rely on solar gadgets for daily utility and safety. Rising outdoor and camping culture, along with growing commercial use cases such as solar signage and surveillance, contributes to market expansion. However, price sensitivity and limited retail infrastructure moderately constrain widespread adoption.
Middle East & Africa
The Middle East & Africa region represents 5.1% market share in 2024, supported by abundant sunlight availability and growing reliance on solar-powered gadgets for off-grid applications. Countries such as the UAE, Saudi Arabia, South Africa, and Kenya increasingly adopt solar lighting, portable chargers, and security systems due to high electricity tariffs or limited rural electrification. Government-backed renewable energy programs enhance market visibility. Demand rises sharply in rural Africa for essential solar tools, improving communication and safety. Despite strong potential, affordability challenges and limited local distribution networks restrain faster penetration.
Market Segmentations
By Gadget Type
- Consumer Electronics
- Home And Garden
- Outdoor and Recreational
- Others (Automotive and transport etc.)
By End User
- Residential
- Commercial
By Distribution Channel
- Direct sales
- Indirect sales
By Geography
- North America
- U.S.
- Canada
- Mexico
- Europe
- Germany
- France
- U.K.
- Italy
- Spain
- Rest of Europe
- Asia Pacific
- China
- Japan
- India
- South Korea
- South-east Asia
- Rest of Asia Pacific
- Latin America
- Brazil
- Argentina
- Rest of Latin America
- Middle East & Africa
- GCC Countries
- South Africa
- Rest of the Middle East and Africa
Competitive Landscape
The Solar Powered Gadgets market features a diverse and rapidly evolving competitive landscape, with companies focusing on innovation, efficiency improvements, and portfolio expansion to strengthen their market presence. Key players such as Garmin, GoSun, Gemma Lighting, Hikvision Digital Technology, INVT Solar Technology, LS VISION Technology, Pvilion, Solar Solutions AG, Soleos, and Sun Surveillance actively invest in advanced photovoltaic materials, battery technologies, and smart integrations to enhance product performance. Many brands emphasize durability, portability, and energy independence to cater to residential, commercial, and outdoor application needs. Strategic partnerships, product launches, and global distribution expansions remain central to gaining market traction. E-commerce channels and direct-to-consumer models also elevate competition, enabling broader customer reach and faster adoption. As sustainability trends intensify, companies increasingly differentiate through eco-friendly designs, multifunctional features, and IoT-enabled solar gadgets, positioning the market for steady technological advancement and heightened competitive activity.
Key Player Analysis
- Sun Surveillance
- Gemma Lighting
- Soleos
- Garmin
- GoSun
- LS VISION Technology
- Pvilion
- Hikvision Digital Technology
- Solar Solutions AG
- INVT Solar Technology
Recent Developments
- In December 2025, TOYO Co., Ltd. acquired the remaining 24.99% membership interest in its U.S. subsidiary TOYO Solar LLC, making it a wholly owned subsidiary strengthening its foothold in the U.S. solar-module manufacturing supply chain.
- In May 2024, Hikvision introduced a new range of solar-powered security solutions designed for remote and standalone sites. The portfolio spans from cost-effective 4 MP Solar Kits equipped with ColorVu technology to high-end 8 MP models featuring License Plate Recognition, enabling enhanced protection across varied environments, including rural farms and urban parking areas.
- In February 2023, GoSun launched its innovative solar-powered backpack tailored for travelers, hikers, and day packers. The backpack provides ample storage for GoSun devices and essential off-grid gear while generating and storing solar energy for later use. It also functions as an emergency-ready survival bag.
Report Coverage
The research report offers an in-depth analysis based on Gadget Type, End User, Distribution Channel and Geography. It details leading market players, providing an overview of their business, product offerings, investments, revenue streams, and key applications. Additionally, the report includes insights into the competitive environment, SWOT analysis, current market trends, as well as the primary drivers and constraints. Furthermore, it discusses various factors that have driven market expansion in recent years. The report also explores market dynamics, regulatory scenarios, and technological advancements that are shaping the industry. It assesses the impact of external factors and global economic changes on market growth. Lastly, it provides strategic recommendations for new entrants and established companies to navigate the complexities of the market.
Future Outlook
- The market will experience sustained growth as consumers increasingly prefer renewable, portable, and off-grid energy solutions.
- Advancements in high-efficiency solar cells and durable energy storage systems will enable more powerful and compact gadget designs.
- Integration of IoT, AI, and smart connectivity features will expand applications across residential, commercial, and outdoor environments.
- Outdoor recreation, adventure tourism, and emergency preparedness will continue to drive strong demand for solar-powered portable devices.
- Commercial adoption will rise as businesses deploy solar surveillance, signage, and operational tools to reduce energy costs.
- Flexible, lightweight, and wearable solar materials will open new product opportunities in health, fitness, and mobility sectors.
- E-commerce expansion and direct-to-consumer sales models will accelerate market penetration worldwide.
- Increased climate awareness and sustainability regulations will further encourage solar gadget adoption across all regions.
- Hybrid charging technologies combining solar, kinetic, and wireless power will enhance device versatility.
- Emerging markets will offer strong growth potential as electrification improves and affordability increases
Request a Free Sample
Fill in your details and we'll send you a free sample report.
- Sample data tables & charts
- Research methodology
Need a Custom Version of This Report?
Tailor the scope, geography, or segments to your exact requirements.
- Custom geography or segment scope
- Direct access to our analyst team
Frequently Asked Questions
What is the current market size for Solar Powered Gadgets market, and what is its projected size in 2032?
At what Compound Annual Growth Rate is the Solar Powered Gadgets market projected to grow between 2024 and 2032?
Which Solar Powered Gadgets market segment held the largest share in 2024?
What are the primary factors fueling the growth of the Solar Powered Gadgets market?
Who are the leading companies in the Solar Powered Gadgets market?
Which region commanded the largest share of the Solar Powered Gadgets market in 2024?
Table of Content
Chapter 1. Report Introduction
- 1.1 Report Description & Purpose
- 1.1.1 Report Title & Market Definition
- 1.1.2 Unique Selling Propositions (USP) & Key Differentiators
- 1.1.3 Value Proposition for Stakeholders
- 1.2 Research Objectives
- 1.2.1 Market Sizing Objectives (Volume & Revenue) (Volume Where Applicable)
- 1.2.2 Segmentation Objectives
- 1.2.3 Competitive Intelligence Objectives
- 1.2.4 Forecast & Scenario Objectives
- 1.3 Report Scope
- 1.3.1 Solar Powered Gadgets Scope – Segments & Subsegments Covered
- 1.3.2 Geographic Scope – Regions & Countries Covered
- 1.3.3 Historical Period, Base Year & Forecast Period (2024; forecast to 2032)
- 1.3.4 Inclusions & Exclusions
- 1.4 Industry Classification & Applicable Codes
- 1.5 Currency, Measurement Units & Valuation Basis
- 1.6 Target Stakeholders
- 1.7 Limitations & Assumptions
Chapter 2. Executive Summary
- 2.1 Global Solar Powered Gadgets Market Snapshot
- 2.1.1 Market Size – Historical (2024) & Forecast (2024-2032) (2024: USD 90,635.56 million → 2032: USD 216,519.78 million)
- 2.1.2 Volume & Revenue – Global Totals (Volume Where Applicable)
- 2.1.3 Key Market Highlights – Top Five Facts
- 2.2 Solar Powered Gadgets Market Segmentation Snapshot
- 2.2.1 Market Split by Region – 2024 vs. 2032
- 2.3 Competitive Snapshot
- 2.3.1 Top 10 Players by Revenue Share – 2024
- 2.3.2 Top 10 Players by Volume Share – 2024 (Volume Where Applicable)
- 2.3.3 Recent Strategic Developments (18-Month Summary)
- 2.4 Key Investment Highlights & Strategic Conclusions
Chapter 3. Solar Powered Gadgets Market Dynamics & Industry Analysis
- 3.1 Market Overview & Context
- 3.1.1 Solar Powered Gadgets Market Position in the Broader Industry Value Chain
- 3.1.2 Demand Structure & Purchasing Dynamics
- 3.1.3 Market Maturity & Development Stage by Region
- 3.2 Solar Powered Gadgets Market Drivers
- 3.3 Solar Powered Gadgets Market Restraints & Challenges
- 3.4 Solar Powered Gadgets Market Opportunities
- 3.5 Porter's Five Forces Analysis
- 3.5.1 Threat of New Entrants
- 3.5.2 Bargaining Power of Suppliers
- 3.5.3 Bargaining Power of Buyers
- 3.5.4 Threat of Substitutes
- 3.5.5 Competitive Rivalry – Intensity Assessment
- 3.6 Solar Powered Gadgets Value Chain Analysis
- 3.6.1 Upstream – Key Inputs, Resources & Suppliers
- 3.6.1.1 Key Input/Resource 1
- 3.6.1.2 Key Input/Resource 2
- 3.6.1.3 Key Input/Resource 3
- 3.6.2 Midstream – Core Operations & Value Creation
- 3.6.2.1 Operating Model & Process Overview
- 3.6.2.2 Key Operating Locations & Capabilities by Company
- 3.6.3 Downstream – Market Channels & End Users
- 3.6.3.1 Direct Sales & Customer Engagement Channels
- 3.6.3.2 Indirect Sales, Intermediaries & Partner Channels
- 3.6.4 Value Chain Profitability Analysis
- 3.6.1 Upstream – Key Inputs, Resources & Suppliers
- 3.7 PESTEL Analysis
- 3.7.1 Political Factors
- 3.7.2 Economic Factors
- 3.7.3 Social Factors
- 3.7.4 Technological Factors
- 3.7.5 Environmental Factors
- 3.7.6 Legal Factors
- 3.8 Solar Powered Gadgets Supply Chain Analysis
- 3.8.1 Critical Input & Resource Availability Risk Assessment
- 3.8.2 Supplier & Operational Concentration Risk (Geographic Exposure)
- 3.8.3 Supply & Service Disruption Impact Analysis
- 3.9 Regulatory & Policy Landscape
Note: The regulatory and policy landscape section covers regulations based on their applicability to the market, Solar Powered Gadgets category, geography, and scope of the study. Only regulatory frameworks with a material impact on operations, compliance, trade, sustainability, or market access are analyzed in detail.
Chapter 4. Key Investment Pockets & Opportunity Analysis
- 4.1 Solar Powered Gadgets Market Attractiveness Analysis
- 4.1.1 By Region – Investment Attractiveness Matrix (Market Size × CAGR)
- 4.2 Absolute Revenue Growth Opportunity
- 4.2.1 By Region – Absolute Revenue Growth Through 2032
- 4.3 Incremental Demand Opportunity
- 4.3.1 By Region – Incremental Demand Through 2032
- 4.3.2 Segment – Incremental Demand
- 4.4 Emerging Submarket Opportunity Deep Dive (Subject to Applicability)
- 4.5 Priority Market Opportunity Scorecards
- 4.5.1 United States
- 4.5.2 Europe
- 4.5.3 Asia
- 4.5.4 Middle East & Africa
Note: Priority market opportunity scorecards reflect the geographic scope and strategic relevance of the study. Listed markets are indicative and may be adapted to the industry.
Chapter 5. Solar Powered Gadgets Cross-Border Trade & Market Access Analysis
- 5.1 International Trade & Cross-Border Activity Overview
- 5.1.1 Global Export Value by Country (2024)
- 5.1.2 Global Export Volume by Country (2024) (Volume Where Applicable)
- 5.1.3 Global Import Value by Country (2024)
- 5.1.4 Global Import Volume by Country (2024) (Volume Where Applicable)
- 5.1.5 Net Trade Balance by Country (2024)
- 5.2 Export Analysis – Segment
- 5.2.1 Category 1 (Applicable Classification Code)
- 5.2.2 Category 2 (Applicable Classification Code)
- 5.2.3 Category 3 (Applicable Classification Code)
- 5.2.4 Category 4 (Applicable Classification Code)
- 5.2.5 Category 5 (Applicable Classification Code)
- 5.3 Import Analysis – Segment
- 5.3.1 Category 1 (Applicable Classification Code)
- 5.3.2 Category 2 (Applicable Classification Code)
- 5.3.3 Category 3 (Applicable Classification Code)
- 5.3.4 Category 4 (Applicable Classification Code)
- 5.3.5 Category 5 (Applicable Classification Code)
- 5.4 Cross-Border Pricing & Transaction Benchmarks
- 5.4.1 Export Pricing – Segment & Country
- 5.4.2 Import Pricing – Segment & Source Country
- 5.4.3 Price Trends (2024)
- 5.5 Key Cross-Border Trade & Delivery Routes
- 5.5.1 Cross-Border Trade/Delivery Route 1
- 5.5.2 Cross-Border Trade/Delivery Route 2
- 5.5.3 Cross-Border Trade/Delivery Route 3
- 5.5.4 Cross-Border Trade/Delivery Route 4
- 5.5.5 Cross-Border Trade/Delivery Route 5
- 5.6 Trade Policy & Market Access Impact Assessment
- 5.6.1 Tariff & Non-Tariff Barriers
- 5.6.2 Regional Trade & Economic Integration Frameworks
- 5.6.3 Bilateral & Multilateral Trade Agreements
- 5.6.4 Cross-Border Operating, Licensing & Localization Requirements
Note: This chapter applies where cross-border trade or delivery is relevant to Solar Powered Gadgets. Goods, services, and digital offerings are assessed using applicable classifications and transaction measures. Import-export volumes, trade balances, and route analyses are included only where meaningful to the market.
Chapter 6. Competitive Landscape & Company Benchmarking
- 6.1 Solar Powered Gadgets Market Concentration & Structure
- 6.1.1 Herfindahl-Hirschman Index (HHI) – vs. 2024
- 6.1.2 Leading, Mid-Sized & Emerging Player Structure
- 6.1.3 Global, Regional & Local Player Dynamics
- 6.2 Solar Powered Gadgets Market Share Analysis – 2024
- 6.2.1 Global Revenue Share by Company
- 6.2.2 Global Volume Share by Company (Volume Where Applicable)
- 6.2.3 Regional Revenue Share
- 6.2.4 Market Share Evolution ( vs. 2024)
- 6.2.5 Company Market Share by Key Segment
- 6.2.6 Company Market Share by Customer Group
- 6.3 Operating Scale, Capacity & Infrastructure Analysis
- 6.3.1 Global Operating Scale & Supply Capacity
- 6.3.2 Resource Utilization & Operating Efficiency
- 6.3.3 Output, Service Delivery & Activity Metrics
- 6.3.4 Operating Footprint & Infrastructure Map
- 6.3.5 Planned Operational & Capacity Expansion
- 6.4 Solar Powered Gadgets Competitive Benchmarking Matrix
- 6.4.1 Revenue, Growth, Profitability & Operating Metric Comparison
- 6.4.2 Channel Revenue Mix
- 6.4.3 Geographic Revenue Exposure
- 6.4.4 R&D Intensity
- 6.4.5 Sustainability Maturity
- 6.5 Strategic Developments in Solar Powered Gadgets (Last 24 Months)
- 6.5.1 Mergers, Acquisitions & Divestments
- 6.5.2 New Products, Services & Solutions in Solar Powered Gadgets
- 6.5.3 Operational & Infrastructure Expansions
- 6.5.4 Strategic Alliances, Joint Ventures & Partnerships
- 6.5.5 Distribution Expansion & Market Entry
- 6.5.6 Sustainability & ESG Initiatives
- 6.6 Competitive Strategy Mapping
- 6.6.1 Leader, Challenger, Follower & Niche Classification
- 6.6.2 Pricing Strategy Comparison
- 6.6.3 Channel Strategy Matrix
Note: Strategic developments are included based on their materiality and the availability of reliable information.
Chapter 7. Global Solar Powered Gadgets Market – By Sales & Delivery Channel
- 7.1 Segment Overview
- 7.1.1 Volume & Revenue Split by Channel (2024 & 2032) (Volume Where Applicable)
- 7.1.2 Channel Mix Evolution (2024-2032)
Chapter 8. Regional Market Analysis – Global Overview
- 8.1 Global Regional Overview
- 8.1.1 Regional Volume Share (Volume Where Applicable)
- 8.1.2 Regional Revenue Share
- 8.1.3 Regional Volume by Region (Volume Where Applicable)
- 8.1.4 Regional Revenue by Region
- 8.1.5 Regional Forecast Through 2032
- 8.2 Cross-Regional Segment Analysis
- 8.2.1 By Sales & Delivery Channel
- 8.2.2 By Competitive Positioning & Price Tier
Chapter 9. North America Solar Powered Gadgets Market
- 9.1 United States
- 9.2 Canada
- 9.3 Mexico
Chapter 10. Europe Solar Powered Gadgets Market
- 10.1 Germany
- 10.2 France
- 10.3 Italy
- 10.4 United Kingdom
- 10.5 Spain
- 10.6 Poland
- 10.7 Russia
- 10.8 Netherlands
- 10.9 Belgium
- 10.10 Sweden
- 10.11 Denmark
- 10.12 Norway
- 10.13 Rest of Europe
Chapter 11. Asia Pacific Solar Powered Gadgets Market
- 11.1 China
- 11.2 India
- 11.3 Japan
- 11.4 South Korea
- 11.5 Thailand
- 11.6 Indonesia
- 11.7 Vietnam
- 11.8 Malaysia
- 11.9 Australia
- 11.10 Rest of Asia Pacific
Chapter 12. Latin America Solar Powered Gadgets Market
- 12.1 Brazil
- 12.2 Argentina
- 12.3 Colombia
- 12.4 Chile
- 12.5 Rest of Latin America
Chapter 13. Middle East Solar Powered Gadgets Market
- 13.1 Saudi Arabia
- 13.2 United Arab Emirates
- 13.3 Turkey
- 13.4 Israel
- 13.5 Iran
- 13.6 Rest of the Middle East
Chapter 14. Africa Solar Powered Gadgets Market
- 14.1 South Africa
- 14.2 Egypt
- 14.3 Nigeria
- 14.4 Morocco
- 14.5 Rest of Africa
Chapter 15. Solar Powered Gadgets Company Profiles
- 15.1 [Company 01]
- 15.1.1 Company Overview
- 15.1.2 Key Management Personnel
- 15.1.3 Products & Services Portfolio
- 15.1.4 Financial Performance
- 15.1.5 Key Market Focus & Geographic Presence
- 15.1.6 Recent Developments & Strategic Initiatives
Note: The company profile list is preliminary and may change based on research findings, market developments, data availability, and client requirements.
Chapter 16. Appendices
- Appendix A – List of Abbreviations & Acronyms
- Appendix B – Industry Classification Code Reference – Full Series
- Appendix C – Supply, Output & Operating Capacity Data Tables
- Appendix D – End-Use & Demand Base Tables
- Appendix E – Demand, Adoption & Usage Assumptions
- Appendix F – Pricing & Revenue Metric Reference Tables
- Appendix G – Company Operations & Infrastructure Database
- Appendix H – Cross-Border Trade & Activity Data Tables (Where Applicable)
- Appendix I – Regulatory Summary Tables
- Appendix J – Primary Research Participant List (Anonymized)
- Appendix K – Primary Research Questionnaire Framework
- Appendix L – Data Sources & Bibliography
- Appendix M – Market Size Divergence & Source Comparison
Chapter 17. Research Methodology
- 17.1 Research Framework & Philosophy
- 17.2 Secondary Research – Sources, Hierarchy & Data Extraction
- 17.3 Data Modeling – Bottom-Up & Top-Down Market Sizing
- 17.4 Primary Research – Stakeholder Framework, LOI & Sample Sizes
- 17.5 Forecast Methodology – Regression, Scenario & Sensitivity Analysis
- 17.6 Quality Control – Four-Layer Validation Framework
- 17.7 Limitations & Standard Assumptions
- 17.8 Disclaimer
