
Market Overview
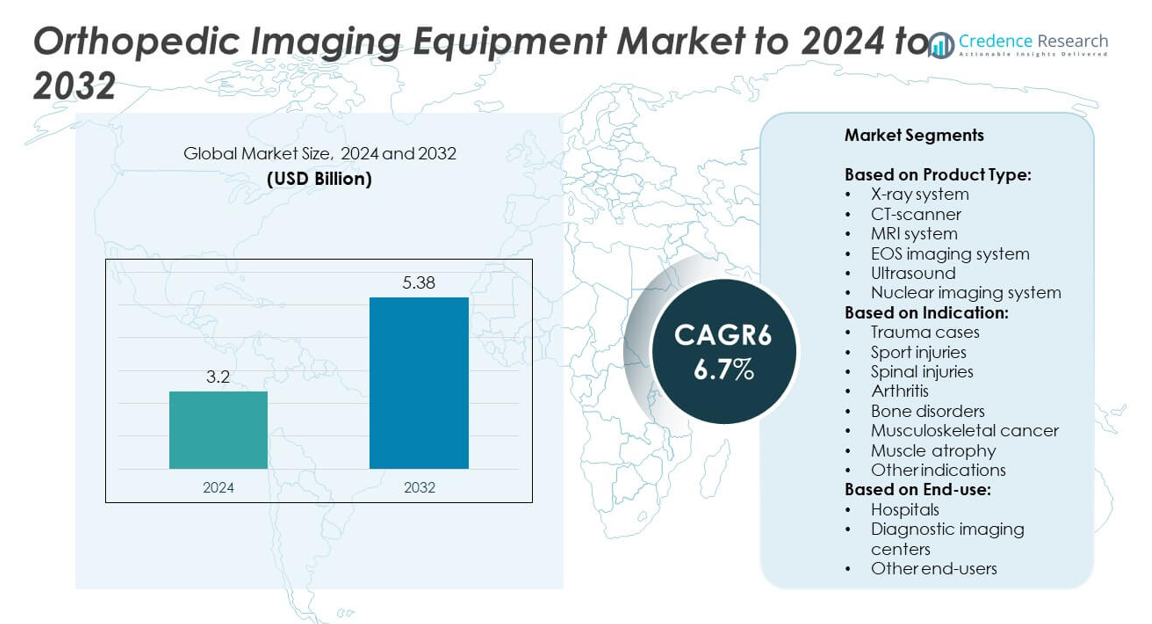
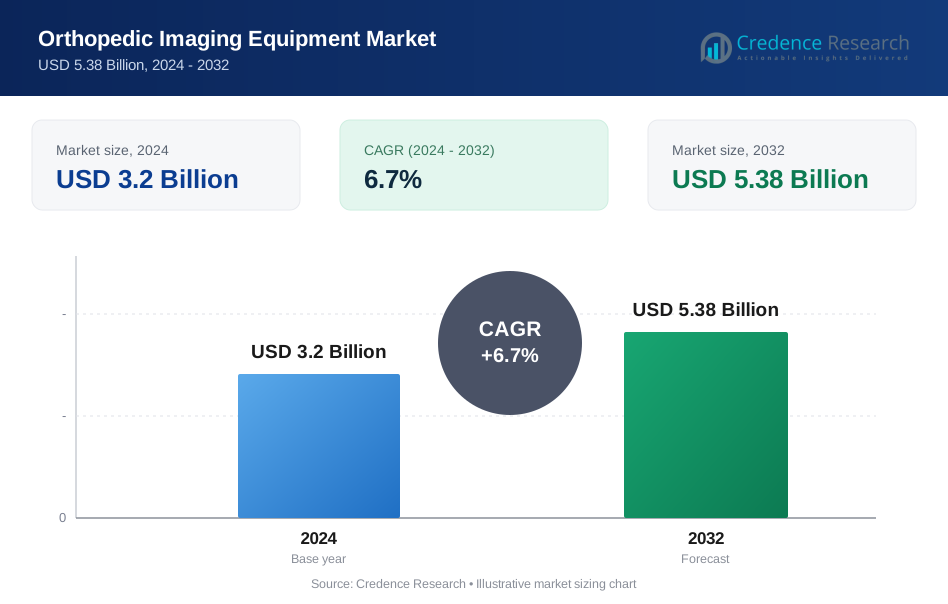
Orthopedic Imaging Equipment Market size was valued USD 3.2 Billion in 2024 and is anticipated to reach USD 5.38 Billion by 2032, at a CAGR of 6.7% during the forecast period.
| REPORT ATTRIBUTE | DETAILS |
|---|---|
| Historical Period | 2020-2023 |
| Base Year | 2024 |
| Forecast Period | 2025-2032 |
| Orthopedic Imaging Equipment Market Size 2024 | USD 3.2 Billion |
| Orthopedic Imaging Equipment Market, CAGR | 6.7% |
| Orthopedic Imaging Equipment Market Size 2032 | USD 5.38 Billion |
The orthopedic imaging equipment market is shaped by leading players such as Siemens Healthineers AG, GE HealthCare Technologies Inc., Canon Inc., FUJIFILM Holdings Corporation, Koninklijke Philips NV, Hologic, Inc., Carestream Health, Shimadzu Corporation, Shenzhen Mindray Bio-Medical Electronics Co., Ltd., EOS imaging, and Esaote SPA. These companies focus on advancing technologies like AI-based diagnostics, low-dose radiation imaging, and portable systems to strengthen their market positions. Regionally, North America led the market with over 35% share in 2024, supported by robust healthcare infrastructure, high patient inflow, and favorable reimbursement policies, while Europe and Asia Pacific followed as significant contributors.
Market Insights
- The orthopedic imaging equipment market was valued at USD 3.2 Billion in 2024 and is projected to reach USD 5.38 Billion by 2032, growing at a CAGR of 6.7%.
- Growth is driven by rising cases of musculoskeletal disorders, sports injuries, and trauma, along with the adoption of advanced imaging technologies in hospitals and diagnostic centers.
- Key trends include increasing integration of AI for faster diagnostics, rising demand for portable imaging systems, and growing preference for low-dose radiation solutions to enhance patient safety.
- The competitive landscape is marked by strong global players focusing on innovation, partnerships, and expansion into emerging markets, with strategies centered on advanced MRI, CT, and digital X-ray solutions.
- North America led the market with over 35% share in 2024, followed by Europe at 28% and Asia Pacific at 22%, while Latin America and the Middle East & Africa accounted for 8% and 7% respectively.
cr_cta type="download_free_sample"]
Market Segmentation Analysis:
By Product Type
X-ray systems dominated the orthopedic imaging equipment market in 2024 with more than 35% share. Their leadership stems from affordability, wide availability, and ability to deliver fast diagnostic results for trauma and fracture assessment. Continuous technological upgrades, such as digital radiography and 3D imaging integration, are boosting adoption across hospitals and clinics. MRI systems follow closely, driven by high accuracy in detecting soft tissue injuries and spinal disorders. EOS imaging is expanding gradually, supported by low-dose radiation benefits in pediatric and scoliosis cases.
- For instance, In its fiscal year 2024 Sustainability Report, Siemens Healthineers announced that it had achieved 2.6 billion patient touchpoints worldwide during that fiscal year. In the same report, the company also set a target of reaching 3.3 billion patient touchpoints by 2030.
By Indication
Trauma cases accounted for the largest share of over 30% in 2024. Rising road accidents and workplace injuries significantly drive demand for rapid diagnostic imaging, particularly X-ray and CT scanners, which deliver instant results. Sports injuries are another fast-growing sub-segment, fueled by increasing athletic activities and advanced imaging adoption for ligament and joint evaluations. Arthritis imaging is expanding with the aging population, while musculoskeletal cancer diagnosis relies on MRI and nuclear imaging advancements. The demand across indications reflects the broad scope of orthopedic imaging applications.
- For instance, Philips Healthcare manufactures the Ingenia Elition X MRI system, which is a high-performance 3.0T MRI.
By End-use
Hospitals held the leading position with a market share exceeding 45% in 2024. Their dominance is driven by high patient inflow, advanced infrastructure, and availability of multiple imaging modalities under one roof. Large hospitals increasingly invest in MRI and CT scanners to support trauma, arthritis, and cancer diagnostics. Diagnostic imaging centers are expanding steadily due to rising outpatient demand and preference for cost-effective, specialized imaging services. Other end-users, such as specialty orthopedic clinics and research institutions, contribute smaller but consistent growth supported by targeted imaging needs.
Key Growth Drivers
Rising Prevalence of Musculoskeletal Disorders
The growing burden of musculoskeletal conditions, including arthritis, osteoporosis, and spinal disorders, is a primary driver for orthopedic imaging equipment. An aging global population, coupled with lifestyle-related issues such as obesity and reduced physical activity, increases demand for accurate diagnostic imaging. Hospitals and diagnostic centers rely heavily on X-ray and MRI systems to provide early detection and effective treatment planning. This consistent rise in patient volume continues to strengthen the adoption of advanced imaging solutions, establishing it as a key growth driver for the market.
- For instance, Mayo Clinic operates advanced MRI systems, including 3T and 7T scanners, across its U.S. facilities. The clinic is a leader in the clinical use of 7T MRI technology for neurological conditions, and has a research partnership with Siemens Healthineers, including the installation of advanced systems like a 7T scanner at its Arizona campus in 2024.
Technological Advancements in Imaging Systems
The orthopedic imaging equipment market benefits significantly from continuous advancements in technology. Innovations such as low-dose EOS imaging, high-resolution MRI, and AI-enabled diagnostic tools are improving efficiency and diagnostic precision. These developments reduce patient exposure to radiation, enhance workflow efficiency, and support early-stage disease identification. The integration of artificial intelligence in image analysis is especially transformative, aiding physicians in detecting subtle abnormalities. Such advancements are driving increased adoption across hospitals and imaging centers, making this a major key growth driver shaping future market demand.
- For instance, Philips’ SmartSpeed Precise AI MRI software received FDA 510(k) clearance in July 2025.
Expanding Sports and Trauma Cases
The rising number of sports-related injuries and trauma cases from accidents strongly contributes to demand for orthopedic imaging. X-ray and CT systems remain the first choice for emergency diagnostics due to their speed and reliability. Growing investments in sports infrastructure, combined with increasing participation in professional and recreational sports, are also fueling demand for high-performance imaging systems. In trauma care, fast and accurate imaging is vital for timely interventions, further strengthening the role of advanced modalities. This makes expanding sports and trauma cases a vital growth driver in the market.
Key Trends & Opportunities
Integration of Artificial Intelligence and Machine Learning
Artificial intelligence and machine learning integration are transforming orthopedic imaging by improving accuracy, reducing reporting time, and enhancing workflow efficiency. AI algorithms enable precise image reconstruction and automate fracture detection, reducing diagnostic errors. This trend is gaining momentum across hospitals and diagnostic imaging centers as healthcare providers seek faster, more reliable solutions. Opportunities are strong for companies investing in AI-driven platforms, as they help improve patient outcomes and reduce overall healthcare costs. This growing adoption positions AI integration as a key trend and opportunity in the market.
- For instance, In molecular imaging, Siemens integrates AI tools on its Biograph PET/CT scanners, enabling lung segmentation in ~45 seconds.
Rising Demand for Outpatient and Ambulatory Imaging
The shift toward outpatient care and ambulatory surgical centers is creating opportunities for compact, cost-effective imaging equipment. Patients increasingly prefer diagnostic imaging outside hospital settings due to convenience and lower costs. Portable X-ray and ultrasound devices are particularly in demand, supporting point-of-care diagnostics. This transition is fostering growth for manufacturers focusing on flexible, mobile imaging solutions. The expansion of outpatient imaging services, particularly in developed and emerging economies, highlights a key trend and opportunity driving market expansion beyond traditional hospital environments.
- For instance, Canon Medical’s INSTINX workflow automation uses Anatomical Landmark Detection (ALD) on 240 landmark scans (40 head + 200 body) and achieves 97% accuracy within ±1 cm of target positions.
Key Challenges
High Equipment and Maintenance Costs
One of the major challenges in the orthopedic imaging equipment market is the high cost of advanced systems. MRI and CT scanners require significant upfront investment, along with ongoing maintenance and upgrades, limiting adoption among smaller healthcare providers. Budget constraints in developing regions further restrict access to cutting-edge imaging solutions. Additionally, the cost burden often falls on patients in markets with limited reimbursement policies. These financial barriers hinder wider penetration of advanced systems, making high equipment and maintenance costs a critical challenge in market growth.
Shortage of Skilled Radiology Professionals
The effective use of advanced orthopedic imaging equipment requires trained radiologists and technicians. However, many regions face a shortage of skilled professionals capable of operating sophisticated imaging modalities and interpreting complex results. This shortage leads to delayed diagnosis, underutilization of high-end equipment, and increased workload on existing staff. Training and retaining radiology professionals remain difficult, especially in emerging markets. The lack of skilled human resources poses a key challenge for expanding the adoption and effective utilization of orthopedic imaging technologies across healthcare settings.
Regional Analysis
North America
North America accounted for over 35% share of the orthopedic imaging equipment market in 2024. The region’s dominance is supported by strong healthcare infrastructure, high adoption of advanced imaging technologies, and a large patient base with musculoskeletal disorders. The U.S. leads the regional market due to significant investments in diagnostic imaging centers and hospitals. Rising sports-related injuries and trauma cases further strengthen demand for X-ray and MRI systems. Favorable reimbursement policies and continuous innovation by key players also drive market growth, ensuring North America maintains a leading position throughout the forecast period.
Europe
Europe held around 28% share of the orthopedic imaging equipment market in 2024. The region benefits from advanced healthcare systems, strong focus on research, and increasing prevalence of arthritis and osteoporosis. Germany, the U.K., and France are major contributors, with hospitals investing heavily in MRI and CT scanners. Growing emphasis on radiation-free imaging such as EOS technology is also gaining traction across European healthcare facilities. Supportive government initiatives and rising demand for early diagnostic tools continue to drive adoption. The increasing geriatric population across the region further boosts imaging demand, consolidating Europe’s strong market position.
Asia Pacific
Asia Pacific captured nearly 22% of the orthopedic imaging equipment market in 2024. The region’s growth is fueled by rising healthcare expenditure, expanding medical infrastructure, and increasing trauma and sports injuries. China, Japan, and India remain key contributors due to high patient volumes and growing adoption of advanced imaging solutions. Multinational manufacturers are also expanding operations in the region to meet rising demand for affordable systems. The growing burden of arthritis and bone disorders among aging populations further supports adoption. Asia Pacific is expected to record the fastest growth, narrowing the gap with developed regions during the forecast period.
Latin America
Latin America represented approximately 8% share of the orthopedic imaging equipment market in 2024. Brazil and Mexico drive the regional demand due to improving hospital infrastructure and growing patient awareness. Rising incidence of musculoskeletal injuries and increasing access to diagnostic imaging centers are boosting adoption of X-ray and CT systems. However, limited reimbursement frameworks and high costs of advanced modalities pose challenges. Investments by global companies in localized distribution networks are improving equipment availability. With growing demand for affordable imaging and rising government focus on healthcare modernization, the region is gradually expanding its market presence.
Middle East and Africa
The Middle East and Africa accounted for about 7% share of the orthopedic imaging equipment market in 2024. Growth in this region is supported by expanding healthcare facilities, particularly in the Gulf Cooperation Council countries, where investments in advanced diagnostic imaging are rising. South Africa also shows steady demand due to increasing cases of bone disorders and trauma-related injuries. However, limited access to high-end imaging systems in several African nations restricts overall growth. Global companies are focusing on partnerships and low-cost solutions to improve access, ensuring gradual adoption of orthopedic imaging technologies across the region.
Market Segmentations:
By Product Type:
- X-ray system
- CT-scanner
- MRI system
- EOS imaging system
- Ultrasound
- Nuclear imaging system
By Indication:
- Trauma cases
- Sport injuries
- Spinal injuries
- Arthritis
- Bone disorders
- Musculoskeletal cancer
- Muscle atrophy
- Other indications
By End-use:
- Hospitals
- Diagnostic imaging centers
- Other end-users
By Geography:
North America- U.S.
- Canada
- Mexico
- UK
- France
- Germany
- Italy
- Spain
- Russia
- Rest of Europe
- China
- Japan
- South Korea
- India
- Australia
- Southeast Asia
- Rest of Asia Pacific
- Brazil
- Argentina
- Rest of Latin America
- GCC Countries
- Israel
- Turkey
- Rest of Middle East
- South Africa
- Egypt
- Rest of Africa
Competitive Landscape
Siemens Healthineers AG, Carestream Health, Shimadzu Corporation, FUJIFILM Holdings Corporation, Hologic, Inc., Shenzhen Mindray Bio-Medical Electronics Co., Ltd., Canon Inc., Koninklijke Philips NV, EOS imaging, Esaote SPA, and GE HealthCare Technologies Inc. are the leading players shaping the orthopedic imaging equipment market. The competitive landscape is defined by continuous innovation, strategic partnerships, and expansion into emerging markets. Companies are focusing on advanced imaging technologies such as low-dose radiation systems, high-resolution MRI, and AI-integrated diagnostic platforms to enhance accuracy and efficiency. Growing demand for portable and digital solutions is encouraging manufacturers to invest in product diversification and cost-effective systems. In addition, expanding global distribution networks and increasing collaborations with hospitals and diagnostic centers are strengthening market presence. With rising musculoskeletal cases and growing emphasis on early diagnosis, competition remains intense, pushing players to differentiate through technological advancements, customer-focused service models, and expanded healthcare accessibility.
Key Player Analysis
- Siemens Healthineers AG
- Carestream Health
- Shimadzu Corporation
- FUJIFILM Holdings Corporation
- Hologic, Inc.
- Shenzhen Mindray Bio-Medical Electronics Co., Ltd.
- Canon Inc.
- Koninklijke Philips NV
- EOS imaging
- Esaote SPA
- GE HealthCare Technologies Inc.
Recent Developments
- In 2023, GE HealthCare reached an agreement to acquire Caption Health, an AI healthcare provider developing applications to aid ultrasound scans.
- In 2023, Siemens Healthineers introduced a new production facility in India for manufacturing MRI machines, strengthening its global reach for advanced imaging technologies.
- In 2023, Carestream launched its DRX-Rise Mobile X-ray System, a cost-effective solution designed to help healthcare facilities transition to digital imaging for orthopedic applications.
Report Coverage
The research report offers an in-depth analysis based on Product Type, Indication, End-Use and Geography. It details leading market players, providing an overview of their business, product offerings, investments, revenue streams, and key applications. Additionally, the report includes insights into the competitive environment, SWOT analysis, current market trends, as well as the primary drivers and constraints. Furthermore, it discusses various factors that have driven market expansion in recent years. The report also explores market dynamics, regulatory scenarios, and technological advancements that are shaping the industry. It assesses the impact of external factors and global economic changes on market growth. Lastly, it provides strategic recommendations for new entrants and established companies to navigate the complexities of the market.
Future Outlook
- The market will grow steadily with rising prevalence of musculoskeletal disorders worldwide.
- Adoption of AI-driven imaging solutions will improve diagnostic accuracy and workflow efficiency.
- Hospitals will remain the primary end-use segment due to strong infrastructure and patient inflow.
- Diagnostic imaging centers will expand as outpatient demand for cost-effective services increases.
- X-ray systems will maintain dominance, while MRI and CT scanners gain momentum in advanced diagnostics.
- Portable and point-of-care imaging equipment will see rising demand in outpatient and emergency care.
- Aging populations will drive consistent demand for arthritis and osteoporosis imaging solutions.
- Asia Pacific will record the fastest growth with expanding healthcare investments and infrastructure.
- High equipment and maintenance costs will continue to challenge adoption in emerging markets.
- Integration of low-dose imaging technologies will enhance patient safety and regulatory compliance.
Request a Free Sample
Fill in your details and we'll send you a free sample report.
- Sample data tables & charts
- Research methodology
Need a Custom Version of This Report?
Tailor the scope, geography, or segments to your exact requirements.
- Custom geography or segment scope
- Direct access to our analyst team
Frequently Asked Questions
What is the current market size for Orthopedic Imaging Equipment Market, and what is its projected size in 2032?
At what Compound Annual Growth Rate is the Orthopedic Imaging Equipment Market projected to grow between 2025 and 2032?
Which Orthopedic Imaging Equipment Market segment held the largest share in 2024?
What are the primary factors fueling the growth of the Orthopedic Imaging Equipment Market?
Who are the leading companies in the Orthopedic Imaging Equipment Market?
Table of Content
Chapter 1. Report Introduction
- 1.1 Report Description & Purpose
- 1.1.1 Report Title & Market Definition
- 1.1.2 Unique Selling Propositions (USP) & Key Differentiators
- 1.1.3 Value Proposition for Stakeholders
- 1.2 Research Objectives
- 1.2.1 Market Sizing Objectives (Volume & Revenue)
- 1.2.2 Segmentation Objectives
- 1.2.3 Competitive Intelligence Objectives
- 1.2.4 Forecast & Scenario Objectives
- 1.3 Report Scope
- 1.3.1 Orthopedic Imaging Equipment Scope – Types & Subtypes Covered
- 1.3.2 Geographic Scope – Regions & Countries Covered
- 1.3.3 Historical Period, Base Year & Forecast Period (2024; forecast to 2032)
- 1.3.4 Inclusions & Exclusions
- 1.4 HS Code & Classification Framework
- 1.5 Currency, Units & Pricing Basis
- 1.6 Target Stakeholders
- 1.7 Limitations & Assumptions
Chapter 2. Executive Summary
- 2.1 Global Orthopedic Imaging Equipment Market Snapshot
- 2.1.1 Market Size – Historical (2024) & Forecast (2024-2032) (2024: USD 3.2 Billion → 2032: USD 5.38 Billion)
- 2.1.2 Volume & Revenue – Global Totals
- 2.1.3 Key Market Highlights – Top Five Facts
- 2.2 Orthopedic Imaging Equipment Market Segmentation Snapshot
- 2.2.1 Market Split by Region – 2024 vs. 2032
- 2.3 Competitive Snapshot
- 2.3.1 Top 10 Players by Revenue Share – 2024
- 2.3.2 Top 10 Players by Volume Share – 2024
- 2.3.3 Recent Strategic Developments (18-Month Summary)
- 2.4 Key Investment Highlights & Strategic Conclusions
Chapter 3. Orthopedic Imaging Equipment Market Dynamics & Industry Analysis
- 3.1 Market Overview & Context
- 3.1.1 Orthopedic Imaging Equipment Market Position in the Broader Automotive Value Chain
- 3.1.2 OEM vs. Replacement Market Dynamics
- 3.1.3 Market Maturity & Development Stage by Region
- 3.2 Orthopedic Imaging Equipment Market Drivers
- 3.3 Orthopedic Imaging Equipment Market Restraints & Challenges
- 3.4 Orthopedic Imaging Equipment Market Opportunities
- 3.5 Porter's Five Forces Analysis
- 3.5.1 Threat of New Entrants
- 3.5.2 Bargaining Power of Suppliers
- 3.5.3 Bargaining Power of Buyers
- 3.5.4 Threat of Substitutes
- 3.5.5 Competitive Rivalry – Intensity Assessment
- 3.6 Orthopedic Imaging Equipment Value Chain Analysis
- 3.6.1 Upstream – Raw Material/Input Suppliers
- 3.6.1.1 Raw Material/Input 1
- 3.6.1.2 Raw Material/Input 2
- 3.6.1.3 Raw Material/Input 3
- 3.6.2 Midstream – Production/Manufacturing/Service Delivery
- 3.6.2.1 Production/Process Overview
- 3.6.2.2 Key Facility Locations & Capacity by Manufacturer
- 3.6.3 Downstream – Distribution & End Consumer
- 3.6.3.1 Primary Channel – B2B/OEM
- 3.6.3.2 Secondary Channels – Dealer, Retail, Online, Direct
- 3.6.4 Value Chain Profitability Analysis
- 3.6.1 Upstream – Raw Material/Input Suppliers
- 3.7 PESTEL Analysis
- 3.7.1 Political Factors
- 3.7.2 Economic Factors
- 3.7.3 Social Factors
- 3.7.4 Technological Factors
- 3.7.5 Environmental Factors
- 3.7.6 Legal Factors
- 3.8 Orthopedic Imaging Equipment Supply Chain Analysis
- 3.8.1 Raw Material/Input Supply Risk Assessment
- 3.8.2 Manufacturing Concentration Risk (Geographic Exposure)
- 3.8.3 Trade Disruption Impact Analysis
- 3.9 Regulatory & Policy Landscape
Note: The regulatory and policy landscape section covers regulations based on their applicability to the market, Orthopedic Imaging Equipment category, geography, and scope of the study. Only regulatory frameworks with a material impact on operations, compliance, trade, sustainability, or market access are analyzed in detail.
Chapter 4. Key Investment Pockets & Opportunity Analysis
- 4.1 Orthopedic Imaging Equipment Market Attractiveness Analysis
- 4.1.1 By Region – Investment Attractiveness Matrix (Volume × CAGR)
- 4.2 Absolute Revenue Growth Opportunity
- 4.2.1 By Region – Absolute USD Growth Through 2032
- 4.3 Incremental Volume Opportunity
- 4.3.1 By Region – Incremental Volume Through 2032
- 4.3.2 Segment – Incremental Volume
- 4.4 Emerging Submarket Opportunity Deep Dive (Subject to Applicability)
- 4.5 Emerging Market Opportunity Scorecards
- 4.5.1 United States
- 4.5.2 Europe
- 4.5.3 Asia
- 4.5.4 Middle East & Africa
Note: Emerging Market Opportunity Scorecards will be included based on relevance and strategic importance. Regions listed are indicative and may vary depending on data availability and market dynamics.
Chapter 5. Orthopedic Imaging Equipment Import-Export Analysis & Trade Flows
- 5.1 Global Trade Overview
- 5.1.1 Global Export Value by Country (2024)
- 5.1.2 Global Export Volume by Country (2024)
- 5.1.3 Global Import Value by Country (2024)
- 5.1.4 Global Import Volume by Country (2024)
- 5.1.5 Net Trade Balance by Country (2024)
- 5.2 Export Analysis – Segment
- 5.2.1 Type 1 (HS Code)
- 5.2.2 Type 2 (HS Code)
- 5.2.3 Type 3 (HS Code)
- 5.2.4 Type 4 (HS Code)
- 5.2.5 Type 5 (HS Code)
- 5.3 Import Analysis – Segment
- 5.3.1 Type 1 (HS Code)
- 5.3.2 Type 2 (HS Code)
- 5.3.3 Type 3 (HS Code)
- 5.3.4 Type 4 (HS Code)
- 5.3.5 Type 5 (HS Code)
- 5.4 Average Unit Trade Prices
- 5.4.1 Average Export Price – Segment & Country
- 5.4.2 Average Import Price – Segment & Source Country
- 5.4.3 Price Trends (2024)
- 5.5 Key Trade Route Analysis
- 5.5.1 Trade Route 1
- 5.5.2 Trade Route 2
- 5.5.3 Trade Route 3
- 5.5.4 Trade Route 4
- 5.5.5 Trade Route 5
- 5.6 Trade Policy Impact Assessment
- 5.6.1 US Anti-Dumping & Section 301 Tariffs
- 5.6.2 EU Customs Union Impact
- 5.6.3 Major Free Trade Agreements
- 5.6.4 USMCA Rules of Origin
Note: Trade policy analysis will be included only where relevant to the Orthopedic Imaging Equipment market.
Chapter 6. Competitive Landscape & Company Benchmarking
- 6.1 Orthopedic Imaging Equipment Market Concentration & Structure
- 6.1.1 Herfindahl-Hirschman Index (HHI) – vs. 2024
- 6.1.2 Tier 1, Tier 2 & Tier 3 Market Structure
- 6.1.3 Global, Regional & Local Player Dynamics
- 6.2 Orthopedic Imaging Equipment Market Share Analysis – 2024
- 6.2.1 Global Revenue Share by Company
- 6.2.2 Global Volume Share by Company
- 6.2.3 Regional Revenue Share
- 6.2.4 Market Share Evolution ( vs. 2024)
- 6.2.5 OEM Segment Share by Company
- 6.2.6 Replacement Segment Share by Company
- 6.3 Production/Delivery Capacity & Facility Analysis
- 6.3.1 Global Installed Capacity
- 6.3.2 Capacity Utilization Rates
- 6.3.3 Production/Output Volume
- 6.3.4 Facility Locations & Capacity Map
- 6.3.5 Planned Capacity Additions
- 6.4 Orthopedic Imaging Equipment Competitive Benchmarking Matrix
- 6.4.1 Revenue, Volume, CAGR & Profitability Comparison
- 6.4.2 Channel Revenue Mix
- 6.4.3 Geographic Revenue Exposure
- 6.4.4 R&D Intensity
- 6.4.5 Sustainability Maturity
- 6.5 Strategic Developments in Orthopedic Imaging Equipment (Last 24 Months)
- 6.5.1 Mergers, Acquisitions & Divestments
- 6.5.2 New Orthopedic Imaging Equipment Launches
- 6.5.3 Facility Expansions
- 6.5.4 Strategic Alliances, Joint Ventures & Partnerships
- 6.5.5 Distribution Expansion & Market Entry
- 6.5.6 Sustainability & ESG Initiatives
- 6.6 Competitive Strategy Mapping
- 6.6.1 Leader, Challenger, Follower & Niche Classification
- 6.6.2 Pricing Strategy Comparison
- 6.6.3 Channel Strategy Matrix
Note: Strategic developments are included based on their materiality and the availability of reliable information.
Chapter 7. Global Orthopedic Imaging Equipment Market – By Distribution Channel
- 7.1 Segment Overview
- 7.1.1 Volume & Revenue Split by Channel (2024 & 2032)
- 7.1.2 Channel Mix Evolution (2024-2032)
Chapter 8. Regional Market Analysis – Global Overview
- 8.1 Global Regional Overview
- 8.1.1 Regional Volume Share
- 8.1.2 Regional Revenue Share
- 8.1.3 Regional Volume by Region
- 8.1.4 Regional Revenue by Region
- 8.1.5 Regional Forecast Through 2032
- 8.2 Cross-Regional Segment Analysis
- 8.2.1 By Distribution Channel
- 8.2.2 By Brand/Price Tier
Chapter 9. North America Orthopedic Imaging Equipment Market
- 9.1 United States
- 9.2 Canada
- 9.3 Mexico
Chapter 10. Europe Orthopedic Imaging Equipment Market
- 10.1 Germany
- 10.2 France
- 10.3 Italy
- 10.4 United Kingdom
- 10.5 Spain
- 10.6 Poland
- 10.7 Russia
- 10.8 Netherlands
- 10.9 Belgium
- 10.10 Sweden
- 10.11 Denmark
- 10.12 Norway
- 10.13 Rest of Europe
Chapter 11. Asia Pacific Orthopedic Imaging Equipment Market
- 11.1 China
- 11.2 India
- 11.3 Japan
- 11.4 South Korea
- 11.5 Thailand
- 11.6 Indonesia
- 11.7 Vietnam
- 11.8 Malaysia
- 11.9 Australia
- 11.10 Rest of Asia Pacific
Chapter 12. Latin America Orthopedic Imaging Equipment Market
- 12.1 Brazil
- 12.2 Argentina
- 12.3 Colombia
- 12.4 Chile
- 12.5 Rest of Latin America
Chapter 13. Middle East Orthopedic Imaging Equipment Market
- 13.1 Saudi Arabia
- 13.2 United Arab Emirates
- 13.3 Turkey
- 13.4 Israel
- 13.5 Iran
- 13.6 Rest of the Middle East
Chapter 14. Africa Orthopedic Imaging Equipment Market
- 14.1 South Africa
- 14.2 Egypt
- 14.3 Nigeria
- 14.4 Morocco
- 14.5 Rest of Africa
Chapter 15. Orthopedic Imaging Equipment Company Profiles
- 15.1 [Company 01]
- 15.1.1 Company Overview
- 15.1.2 Key Management Personnel
- 15.1.3 Products & Services Portfolio
- 15.1.4 Financial Performance
- 15.1.5 Key Market Focus & Geographic Presence
- 15.1.6 Recent Developments & Strategic Initiatives
Note: The company profile list is preliminary and may change based on research findings, market developments, data availability, and client requirements.
Chapter 16. Appendices
- Appendix A – List of Abbreviations & Acronyms
- Appendix B – Industry Classification Code Reference – Full Series
- Appendix C – Production & Capacity Data Tables
- Appendix D – End-Use & Demand Base Tables
- Appendix E – Consumption & Replacement Rate Assumptions
- Appendix F – ASP Reference Tables
- Appendix G – Manufacturing & Facility Database
- Appendix H – Import-Export Data Tables
- Appendix I – Regulatory Summary Tables
- Appendix J – Primary Research Participant List (Anonymized)
- Appendix K – Primary Research Questionnaire Framework
- Appendix L – Data Sources & Bibliography
- Appendix M – Market Size Divergence & Source Comparison
Chapter 17. Research Methodology
- 17.1 Research Framework & Philosophy
- 17.2 Secondary Research – Sources, Hierarchy & Data Extraction
- 17.3 Data Modeling – Bottom-Up & Top-Down Market Sizing
- 17.4 Primary Research – Stakeholder Framework, LOI & Sample Sizes
- 17.5 Forecast Methodology – Regression, Scenario & Sensitivity Analysis
- 17.6 Quality Control – Four-Layer Validation Framework
- 17.7 Limitations & Standard Assumptions
- 17.8 Disclaimer
