Market Overview
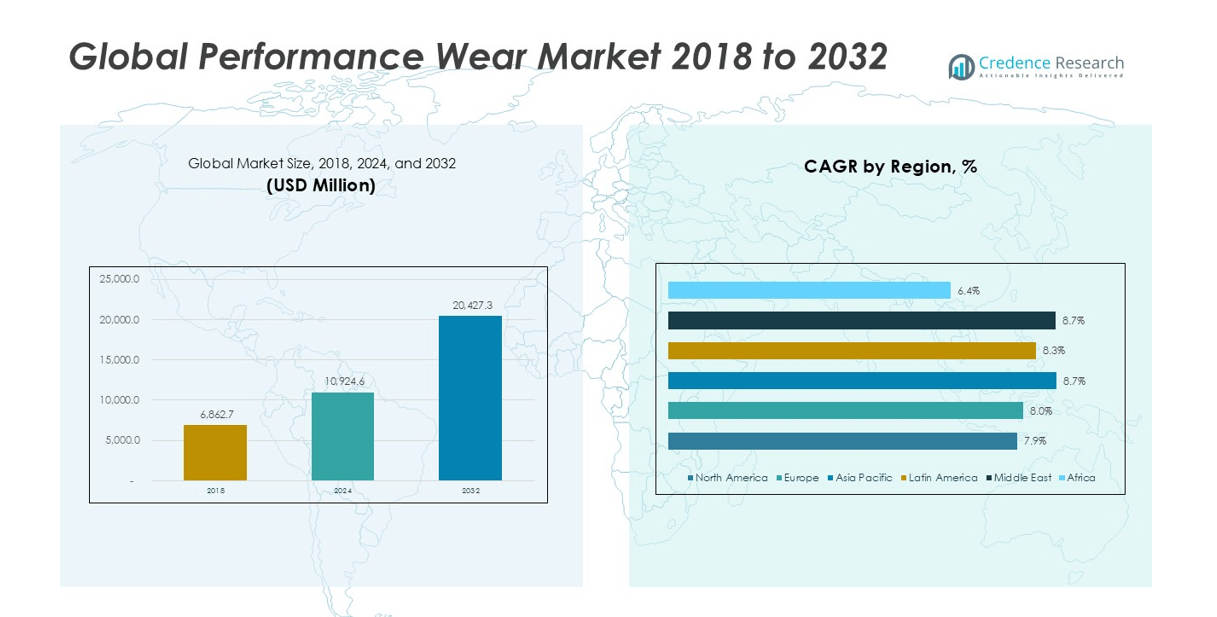
Global Performance Wear market size was valued at USD 6,862.7 million in 2018 to USD 10,924.6 million in 2024 and is anticipated to reach USD 20,427.3 million by 2032, at a CAGR of 8.17% during the forecast period.
| REPORT ATTRIBUTE |
DETAILS |
| Historical Period |
2020-2023 |
| Base Year |
2024 |
| Forecast Period |
2025-2032 |
| Performance Wear Market Size 2024 |
USD 10,924.6 million |
| Performance Wear Market, CAGR |
8.17% |
| Performance Wear Market Size 2032 |
USD 20,427.3 million |
The Global Performance Wear market features a mix of established manufacturers and niche specialists. Key players include Milliken & Company, Vald’or Apparel, Konno Inc., KTC Limited, Guilford (LEAR Corporation), Task Performance Development, WSI Sportswear, VF Image Wear, Heini Sports Inc., and GYMFUSE LIMITED. These companies compete through fabric innovation, product durability, and application-specific designs. Regionally, North America leads with a 33.6% market share, driven by strong athleisure adoption and high spending capacity. Europe follows with 26.5%, supported by sports culture and sustainability focus. Asia Pacific holds 24.0% share, reflecting rapid urbanization and fitness participation. Players align regional strategies with consumer preferences to strengthen market positioning.
Market Insights
- The Global Performance Wear market grew from USD 6,862.7 million in 2018 to USD 10,924.6 million in 2024 and is projected to reach USD 20,427.3 million by 2032, registering a CAGR of 8.17% during the forecast period.
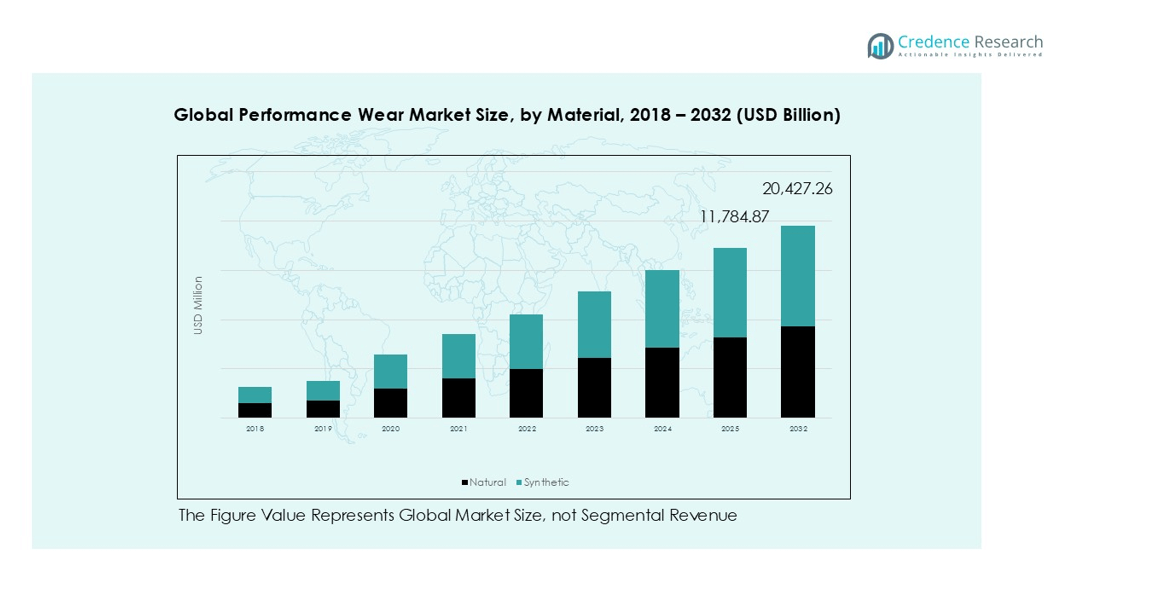
- Rising fitness awareness and athleisure adoption drive demand across daily wear and sports use. Consumers prefer comfort, stretch, and moisture control fabrics. Synthetic materials dominate with around 55–60% segment share due to durability and performance benefits.
- Brands focus on fabric innovation, sustainability, and seamless construction. Recycled fibers and inclusive sizing gain traction. Direct-to-consumer channels and online platforms support faster product launches and higher customer engagement.
- Competition remains fragmented with global and regional players. Firms compete on material technology, pricing, and brand positioning. Partnerships and frequent product refreshes help maintain visibility and loyalty.
- North America leads with 33.6% regional share, followed by Europe at 26.5% and Asia Pacific at 24.0%. Sports and recreation remains the largest application segment with about 60–65% share.
Access crucial information at unmatched prices!
Request your sample report today & start making informed decisions powered by Credence Research Inc.!
Download Sample
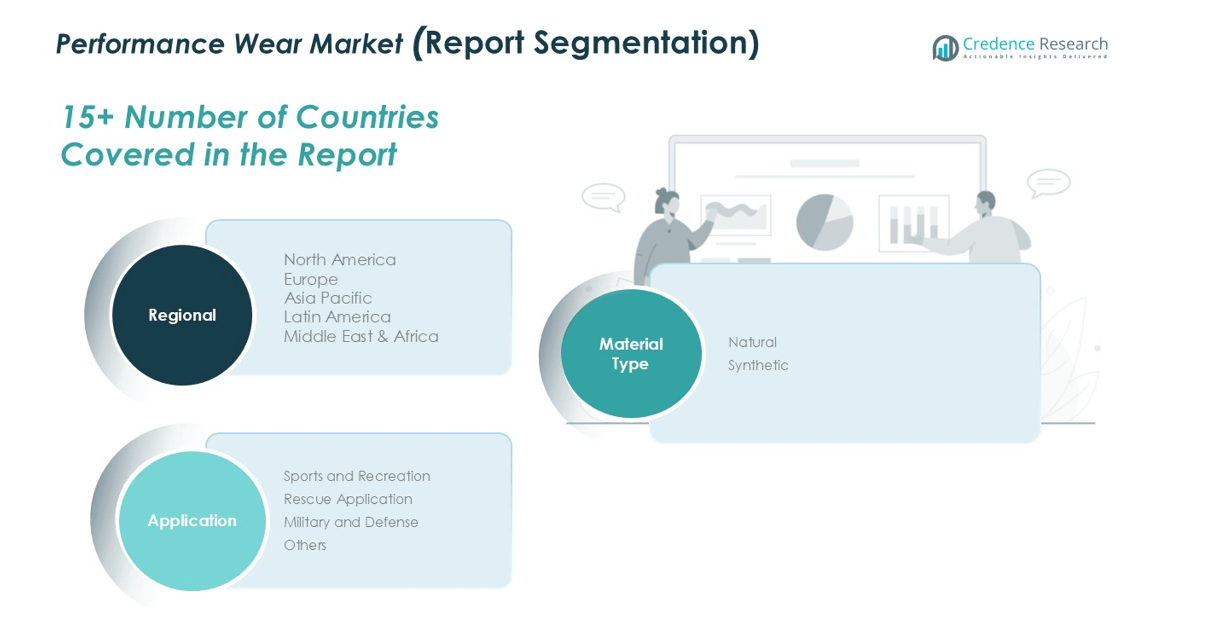
Market Segmentation Analysis:
By Material Type
Synthetic materials form the dominant sub-segment, holding an estimated 55–60% market share. Polyester and nylon lead due to durability, stretch recovery, and fast-drying performance. Brands favor synthetic fabrics for moisture control and shape retention during intense activity. Large-scale production also supports competitive pricing and wide availability. Seamless construction and compression designs rely heavily on synthetic blends. Natural materials, mainly cotton and wool, serve comfort-focused use cases. These fibers attract users seeking softness and breathability. Growth in this sub-segment links to casual wear and low-impact activities.
- For instance, Nike uses recycled polyester yarns with filament strength above 6.0 grams per denier in performance apparel.
By Application
Sports and recreation represents the leading application, accounting for nearly 60–65% market share. High participation in fitness, running, and outdoor sports drives repeat purchases. Athleisure trends expand use beyond workouts into daily wear. Product variety across tops, bottoms, and base layers sustains volume demand. Rescue, military, and defense applications form a smaller but stable segment. These uses demand abrasion resistance, thermal control, and durability. Government procurement supports steady volumes. Other applications include industrial and adventure wear, which grow through niche sports and regional climate needs.
- For instance, Adidas manufactures performance apparel using AEROREADY fabrics, a moisture-management technology that wicks sweat away from the skin to keep athletes cool and dry during various physical activities, including high-intensity workouts and long runs.
Key Growth Drivers
Athleisure Lifestyle and Everyday Comfort Demand
Consumers wear performance apparel beyond gyms and fields. The Global Performance Wear market benefits from this daily-use shift. Brands design lighter fits that suit work, travel, and errands. Buyers prefer stretch, sweat control, and easy-care fabrics. Retailers expand assortments across tops, leggings, bras, and base layers. Social media also pushes “outfit” culture around active looks. Fitness apps and community sports raise repeat purchase cycles. People replace worn items faster than casual clothing. Premium labels raise value through better cuts and durability. Mid-tier brands win share with broad sizing and frequent drops. This mix sustains volume growth across age groups. The category also pulls new shoppers from fashion basics.
- For instance, Lululemon designs and rigorously tests its Luxtreme fabric for durability, ensuring it maintains its shape, four-way stretch, and performance properties over many washes and extensive use.
Innovation In Fabrics and Performance Features
Technical textiles raise product value and repeat buying. The Global Performance Wear market grows with faster material upgrades. Brands use moisture-wicking knits and heat-release structures. Designers add anti-odor finishes and soft-touch blends. Seamless builds improve comfort and reduce chafing. Compression zones support muscles during high-intensity routines. Weather-ready layers help runners and outdoor users. Lighter insulation supports cold use without bulk. UV protection and quick-dry shells expand warm-climate demand. Brands also improve durability in high-friction areas. Better features support higher price points for core users. Innovation helps brands defend margins in crowded shelves.
- For instance, Columbia’s Omni-Shade fabrics block UVA and UVB rays with UPF 50 protection.
Channel Expansion and Direct-To-Consumer Reach
Digital channels widen access and speed new launches. The Global Performance Wear market gains from DTC sites and marketplaces. Brands use data to plan sizes and colors better. Faster feedback improves designs and lowers return waste. Influencer drops create short demand spikes and quick sell-through. Mobile-first shopping supports impulse buys and reorders. Subscription models for basics add steady revenue. Stores also shift layouts toward performance zones and try-on ease. Loyalty programs convert new users into repeat customers. International shipping opens demand in emerging urban centers. Brands localize fits for climate and body needs. Wider reach supports growth even when store traffic slows.
Key Trends & Opportunities
Sustainable Materials and Verified Supply Chains
Sustainability moves from message to buying filter. The Global Performance Wear market sees rising demand for proof, not claims. Brands add recycled polyester and bio-based blends. They also explore natural fibers for comfort segments. Traceability tools help track mills, dye houses, and cut sites. Certifications and audits reduce risk for big retailers. Cleaner dye methods lower water and chemical use. Repair, resale, and take-back programs extend product life. This trend creates room for premium pricing with clear value. Brands can win trust with strong labeling and testing. Suppliers that meet strict standards gain long-term contracts. This area offers strong opportunity for differentiation.
- For instance, Adidas uses Primeblue yarn made from Parley Ocean Plastic, with each jersey containing up to 11 recycled plastic bottles.
Women’s Performance and Inclusive Sizing Expansion
Women’s training and outdoor participation keeps rising. The Global Performance Wear market captures this shift with targeted lines. Brands design better support for high-impact movement. They also improve coverage, breathability, and pocket utility. Inclusive sizing broadens the addressable base quickly. Fit tools and virtual try-on reduce size anxiety. Community events and coaching programs build brand loyalty. Modest activewear also expands in many regions. Work-from-home routines keep demand high for comfort-led performance pieces. This segment supports higher frequency purchases across seasons. Brands that solve fit and support win repeat orders. Retailers can allocate more shelf space with confidence.
Smart And Adaptive Performance Wear for New Use Cases
Connected fitness pushes interest in smarter apparel. The Global Performance Wear market can add value through tech features. Brands test sensor-ready seams and washable modules. Temperature-regulating textiles support hot gyms and outdoor heat. Phase-change finishes help manage body comfort swings. Reflective and safety features gain demand for night runners. Protective performance wear grows in rescue and defense uses. Uniform upgrades also drive steady contract volumes. Personalization options, like custom length, reduce returns. This trend creates partnership chances with device and material firms. Brands can price higher when features solve real problems. New use cases expand beyond sports into work settings.
Key Challenges
Price Pressure and Intense Brand Competition
Many brands chase the same activewear buyer. The Global Performance Wear market faces heavy discounting in peak seasons. Large players use scale to cut costs and underprice rivals. Fast-fashion copies shorten style life and raise churn. Retailers demand promotions to keep traffic steady. Higher marketing spend also reduces profit per unit. Small brands struggle to fund innovation and inventory depth. Buyers compare prices across apps in seconds. Free returns increase costs when fit varies. Premium labels must defend value with clear performance claims. Mid-tier labels must balance quality and affordability. Competition keeps margins tight across channels.
Supply Chain Volatility and Compliance Risk
Raw material swings disrupt planning and pricing. The Global Performance Wear market depends on petro-based fibers and chemicals. Energy and freight costs can jump without warning. Lead times rise when mills face capacity limits. Quality issues also appear with rushed production. Brands must meet stricter labor and sourcing standards. Audits, documentation, and traceability add cost and time. Green claims face scrutiny from regulators and watchdogs. A weak claim can damage trust quickly. Counterfeits also dilute brand equity in online channels. Brands need stronger enforcement and smarter packaging security. These risks slow launches and raise operating burden.
Regional Analysis
North America
North America held the largest market share of about 33.6% in 2024, reflecting strong consumer demand. The market size reached USD 3,664.72 million in 2024, rising from USD 2,341.54 million in 2018. The region is expected to grow at a CAGR of 7.9% through 2032. High fitness participation supports steady apparel replacement cycles. Athleisure adoption remains strong across work and leisure use. Premium brands perform well due to higher spending power. E-commerce penetration improves access and product discovery. Innovation in fabric performance supports value growth.
Europe
Europe accounted for nearly 26.5% market share in 2024, ranking second globally. The regional market expanded from USD 1,834.39 million in 2018 to USD 2,890.64 million in 2024. It is projected to grow at a CAGR of 8.0% over the forecast period. Strong sports culture supports demand across running and outdoor activities. Sustainability awareness shapes buying decisions. Consumers favor certified and traceable materials. Urban lifestyles drive athleisure adoption. Brand loyalty remains high across established labels. Eastern Europe adds incremental volume growth.
Asia Pacific
Asia Pacific captured about 24.0% market share in 2024, showing rapid expansion. The market size increased from USD 1,593.51 million in 2018 to USD 2,620.02 million in 2024. The region is forecast to grow at a CAGR of 8.7%, among the highest globally. Rising urbanization boosts fitness participation. Young consumers adopt performance wear for daily use. Local brands gain share through competitive pricing. Online channels expand fast across major economies. Sports infrastructure investment supports long-term demand. Income growth sustains premium category uptake.
Latin America
Latin America held an estimated 10.3% market share in 2024. The market expanded from USD 699.99 million in 2018 to USD 1,120.86 million in 2024. It is projected to grow at a CAGR of 8.3% during the forecast period. Outdoor sports popularity supports demand. Fitness awareness improves across urban populations. Mid-priced brands dominate sales volumes. Local manufacturing helps manage costs. E-commerce adoption continues to rise. International brands expand through partnerships. Economic recovery trends support gradual spending growth.
Middle East
The Middle East represented about 4.5% market share in 2024. Market size rose from USD 297.84 million in 2018 to USD 489.58 million in 2024. The region is expected to grow at a strong CAGR of 8.7%. Demand grows from lifestyle sports and gyms. Hot climate drives need for breathable fabrics. Premium international brands hold strong appeal. Retail expansion supports visibility and access. Government wellness initiatives encourage active lifestyles. Tourism also supports performance apparel sales.
Africa
Africa accounted for roughly 1.3% market share in 2024, remaining a smaller market. The market grew from USD 95.39 million in 2018 to USD 138.74 million in 2024. Growth is projected at a CAGR of 6.4% through 2032. Urban fitness adoption supports base demand. Price sensitivity shapes product mix. Mass-market brands dominate sales. Sports programs drive youth participation. Distribution remains uneven across countries. Long-term growth links to income and retail development.
Market Segmentations:
By Material Type
By Application
- Sports and Recreation
- Rescue Application
- Military and Defense
- Others
By Geography
- North America
- Europe
- Germany
- France
- U.K.
- Italy
- Spain
- Rest of Europe
- Asia Pacific
- China
- Japan
- India
- South Korea
- South-east Asia
- Rest of Asia Pacific
- Latin America
- Brazil
- Argentina
- Rest of Latin America
- Middle East & Africa
- GCC Countries
- South Africa
- Rest of the Middle East and Africa
Competitive Landscape
The competitive landscape of the Global Performance Wear market remains highly fragmented, with a mix of global brands and regional manufacturers. Leading players compete through material innovation, fit engineering, and product durability. Companies invest in advanced fabric technologies to improve moisture control, stretch, and thermal comfort. Brand strength and design consistency support premium positioning in mature markets. Many players expand direct-to-consumer channels to protect margins and gather customer data. Partnerships with fitness communities and sports organizations improve visibility and loyalty. Regional firms compete on pricing and localized designs. Frequent product launches and limited collections drive repeat purchases. Sustainability credentials also shape competition. Firms adopt recycled materials and transparent sourcing. Overall competition stays intense, with innovation, brand trust, and supply efficiency driving long-term advantage.
Shape Your Report to Specific Countries or Regions & Enjoy 30% Off!
Key Player Analysis
- Milliken & Company
- Vald’or Apparel
- Konno Inc.
- KTC Limited
- Guilford (LEAR Corporation)
- Task Performance Development
- WSI Sportswear
- VF Image Wear
- Heini Sports Inc.
- GYMFUSE LIMITED
Recent Developments
- In November 2025, Under Armour and Stephen Curry announced separation of Curry Brand from Under Armour, enabling UA to refocus on its core performance wear business.
- In October 2025, PUMA announced early renewal of its long‑term partnership with HYROX World Series of Fitness Racing through 2030, positioning itself as exclusive title partner and supplying official performance wear and shoes.
- In July 2025, Goldwin’s new sub-label Goldwin 0 released its first performance wear collection: moisture-wicking T-shirts with circular ventilation, water-repellent ripstop shorts, compression half tights, and a redesigned lightweight backpack with ventilation holes. The design is body-mapped (using heat mapping to optimize areas of ventilation & sun exposure) and involves sustainable materials (recycled plastics, protein fibre fabrics, etc.).
- In March 2025, Under Armour became the official footwear and glove partner of the NFL, strengthening its involvement in American football performance apparel
Report Coverage
The research report offers an in-depth analysis based on Material Type, Application and Geography. It details leading market players, providing an overview of their business, product offerings, investments, revenue streams, and key applications. Additionally, the report includes insights into the competitive environment, SWOT analysis, current market trends, as well as the primary drivers and constraints. Furthermore, it discusses various factors that have driven market expansion in recent years. The report also explores market dynamics, regulatory scenarios, and technological advancements that are shaping the industry. It assesses the impact of external factors and global economic changes on market growth. Lastly, it provides strategic recommendations for new entrants and established companies to navigate the complexities of the market.
Future Outlook
- Demand will rise as fitness and wellness become part of daily routines.
- Athleisure use will continue to blur lines between sports and casual wear.
- Synthetic fabrics will retain dominance due to durability and performance benefits.
- Sustainable materials will gain wider acceptance across mass and premium lines.
- Women’s performance wear will grow faster with better fit and support designs.
- Asia Pacific will show the strongest regional growth momentum.
- Direct-to-consumer channels will expand brand reach and margin control.
- Smart and adaptive apparel features will see gradual commercial adoption.
- Competition will intensify, pushing faster product cycles and innovation.
- Brands with strong supply efficiency and trust will secure long-term advantage.


