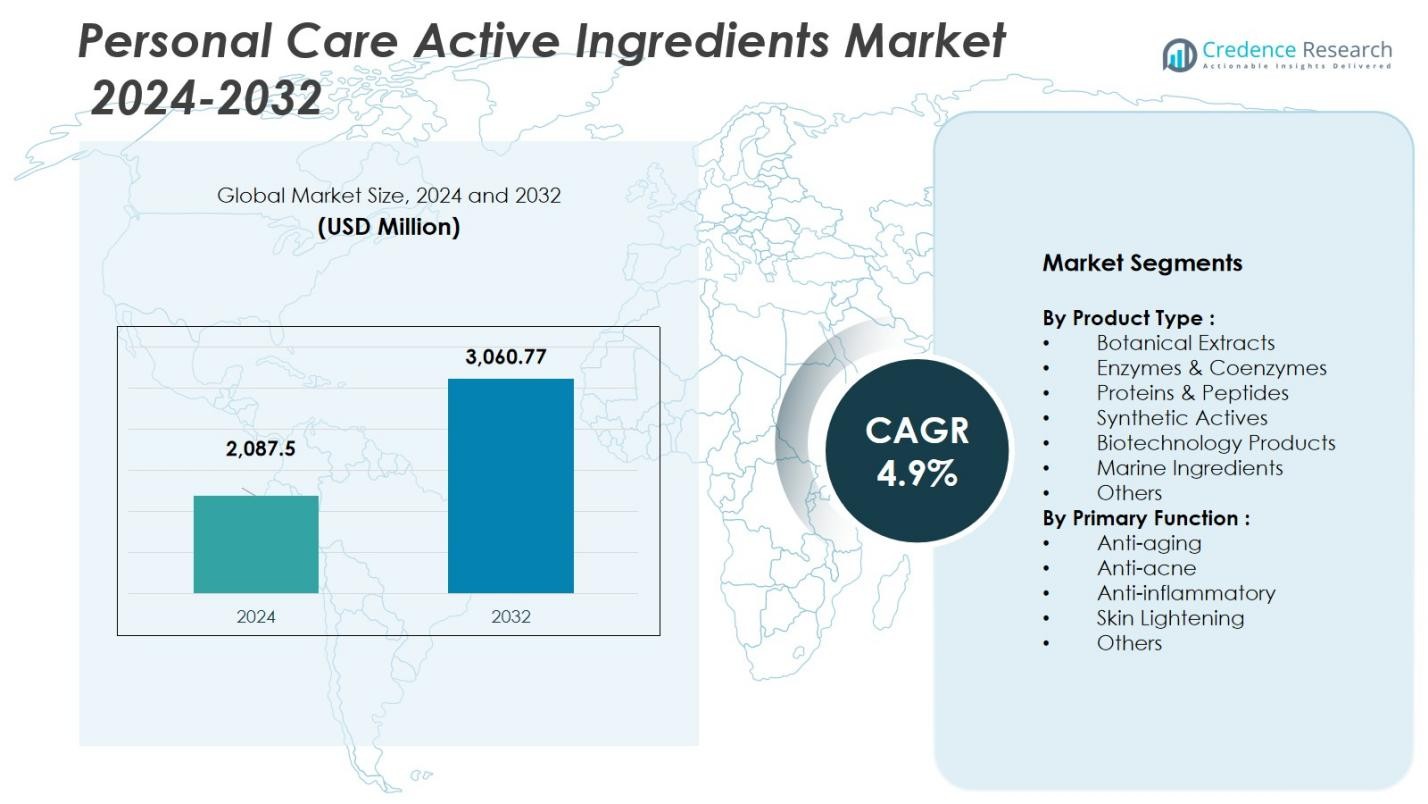
Home » Industrial Goods » Personal Care Active Ingredients Market

Personal Care Active Ingredients Market By Ingredient type (Rheology Control Agents, Emollients, UV Absorbers, Surfactants ), By Application (Skin Care, Men, Hair Care)- Growth, Future Prospects & Competitive Analysis, 2022 – 2030

Price: $4999

Published: | Report ID: 20851 | Report Format : PDF

Key Highlights of the Report

The global personal care active ingredients market is segmented by ingredient type, application, and region. Surfactants category is widely used, while skin care category is a widely utilized segment. Asia Pacific is leading the market growth.

Growing consumer demand for natural and organic goods, driven by growing consumer awareness of environmental and health issues, rising disposable income, and shifting lifestyle preferences, which encourage increased spending on personal care products, are two factors driving the market for active personal care ingredients. The strict safety requirements and regulations set by regulatory organizations, which might limit the introduction of new ingredients and impede market expansion, are one market limitation.

Nonetheless, the global personal care active ingredients market has Two opportunities for the personal care active ingredients market: the growing demand for anti-aging products and the increasing popularity of personalized skincare routines. The aging population and the desire for a youthful appearance create a significant market for anti-aging ingredients. At the same time, the trend toward personalized skincare allows for the development of customized active ingredients to cater to individual needs and preferences.

Design Element 2

Access crucial information at unmatched prices!

Request your free sample report today & start making informed decisions powered by Credence Research!

Download Free Sample
CTA Design Element 3

Market Overview

The global personal care active ingredients market has grown steadily in recent years. It is expected to grow at a CAGR of 5.5% between 2023 and 2030. The market was valued at USD 1.7 Billion in 2022 and is expected to reach USD 2.4 Billion in 2030.

What Are The Main Drivers Of The Global Personal Care Active Ingredients Market?

Consumers are looking for natural and organic substitutes as they become more aware of the components used in personal care products. This desire is driving the market for active compounds produced from natural sources.

What Are The Major Challenges Faced By The Global Personal Care Active Ingredients Market?

Regulatory organizations set regulations and safety requirements for the personal care business. Manufacturers may find it difficult to comply with these laws because they must simultaneously guarantee the security and effectiveness of their active components.

What Are The Growth Opportunities In The Global Personal Care Active Ingredients Market?

Natural and organic personal care products are becoming increasingly popular with consumers. This trend allows producers to develop and commercialize active components from natural sources to satisfy the desire for natural and sustainable beauty products.

Personal Care Active Ingredients Market

Executive Summary

Overview of the Global Personal Care Active Ingredients Market

The demand for natural & organic products, growing knowledge of the advantages of anti-aging chemicals, and shifting lifestyle preferences are all driving the considerable expansion of the global market for personal care active ingredients. Intense competition, strict restrictions, and sustainability issues define the market. However, there are many opportunities for expansion, including the increased interest in natural and organic products, the acceptance of customized skincare, and the growing importance of anti-aging treatments. Innovating products and advancing technology both have a significant impact on the market. As consumers look for efficient and long-lasting solutions for their personal care needs, the industry is poised for further expansion.

Market Definition

Active ingredients for personal care are compounds in creating products to offer particular advantages and functions. These components are essential for improving personal care goods’ performance and effectiveness, such as cosmetics, skincare, haircare, and dental care. Antioxidants, moisturizers, emollients, UV absorbers, surfactants, emulsifiers, antimicrobials, hair fixative polymers, conditioning polymers, and many more compounds can be active ingredients in personal care products. These compounds are carefully chosen and added to formulations to produce the intended results, including, but not limited to, hydration, anti-aging, UV protection, cleansing, and style.

Market Insights

  • The global demand for personal care active ingredients was valued at USD 1.7 Billion in 2022 and is expected to reach USD 2.4 Billion in 2030, growing at a CAGR of 5.5% between 2023 and 2030.
  • Surfactants are the market leader in material and hold over 8% of the market’s value is 2022, while emulsifiers are anticipated to show the quickest CAGR over the forecast period,
  • The skin care segment governs the global demand for personal care active ingredients, holding a massive share of over 30% in 2022, and is expected to grow at a rapid CAGR.
  • Asia Pacific is fuelling the growth of the personal care active ingredients industry with over one-third share in 2022. North America and Europe collectively accounted for just under 40% share in 2022. Europe held over 22% share in 2022.
  • Due to its substantial population, rising disposable income, and expanding demand for personal care products, the Asia Pacific region now dominates the market for personal care active ingredients.
  • The increased consumer desire for natural and organic goods, driven by growing awareness of health and environmental concerns, drives the market for active personal care ingredients. The strict safety requirements and regulations set by regulatory organizations, which might limit the introduction of new ingredients and impede market expansion, are one market limitation.

Segmentation by Ingredient Type

  • Surfactants are the leading segment by material and held over 8% share in value in 2022.
  • The emulsifiers segment will likely exhibit the fastest CAGR during the forecast period.

Segmentation by Application

  • The skin care segment governs the demand for personal care active ingredients globally, holding a massive share of over 30% in 2022, and is also expected to grow at a rapid CAGR.
  • The hair care segment contributes to the rest of the demand for personal care active ingredients.

Segmentation by Region

  • Asia Pacific is fueling the growth of the personal care active ingredients industry with over one-third share in 2022.
  • North America and Europe collectively account for just under 40% share in 2022, with Europe holding over 22% share in the same year.
  • The rest of the World, including Latin America, The Middle East, and Africa, contributes the remainder to the demand for personal care active ingredients.

The rising consumer demand for organic and natural products drives the personal care active ingredients market. Consumers are looking for natural and organic substitutes as they become more aware of the components used in personal care products. This desire is driving the market for active compounds produced from natural sources.

The US’s personal care active ingredients market is quite competitive and well-developed. Demand for innovative and high-quality personal care products drives the market, which has a sizable consumer base and high disposable income. Well-known international corporations and smaller, niche players who serve certain customer demands use the market. The main focus is the development of active compounds with numerous advantages, such as anti-aging, moisturizing, and sun protection. The market is also impacted by consumers’ increasing preference for natural and organic goods, which has sparked the development of sustainable and plant-based active ingredients.

Due to China’s enormous population and rising standard of living, the market for personal care active ingredients is expanding quickly. Both domestic and foreign firms use the market, emphasizing creating active ingredients that address Chinese customers’ particular requirements and taste preferences. Demand for natural ingredients, skin-brightening agents, and anti-aging cosmetics drives the industry. The demand for products with clean and sustainable formulations among Chinese consumers is also rising, which has prompted the development of eco-friendly and plant-based active ingredients. Companies spend on research and development to keep ahead in this fast-paced sector since it is fiercely competitive.

The growing customer desire for natural and organic products drives the market for personal care active ingredients. As consumers become more aware of the ingredients used in personal care products, they are searching for natural and organic alternatives. This demand is driving the market for active chemicals made from natural sources.

Natural & organic products are becoming increasingly popular among consumers.

One of the primary reasons driving the personal care active ingredients market is increased customer desire for natural and organic goods. Consumers are looking for alternatives that don’t contain dangerous chemicals or artificial additions as they become more concerned about the components in their personal care items. Consumer preferences are changing due to a growing understanding of environmental and health issues.

Natural components such as plant extracts, essential oils, and botanicals are increasingly appealing to consumers. They are looking for active chemicals that are as effective as their synthetic counterparts but without the possibility of severe side effects. The desire for natural and organic personal care products has boosted the discovery and usage of active compounds derived from natural sources.

Rising Disposable Income and Changing Lifestyle Preferences

The market for active personal care ingredients is also significantly influenced by customers’ shifting lifestyle preferences and increased disposable income. Consumers have greater purchasing power and are prepared to spend money on personal care items that provide better advantages and experiences as economies and incomes develop.

Consumers seek upscale, high-quality personal care products that deliver noticeable benefits as their disposable money increases. They are prepared to spend money on goods that target certain skin issues, have anti-aging advantages, and enhance general well-being. This has increased the demand for cutting-edge, potent active substances that can produce the necessary effects.

Furthermore, the industry has expanded as a result of shifting lifestyle tastes. Consumers are increasingly concerned with maintaining their health, wellness, and youthful appearance. Due to this, demand for personal care items beyond simple washing and moisturizing has increased. Demand is strong for active substances that provide anti-aging effects, UV protection, hydration, and other specialized benefits.

Safety Standards Enforced By Regulatory Agencies

The strict requirements and safety standards enforced by regulatory agencies are one barrier to the market for active ingredients in personal care products. These rules are in place to guarantee the effectiveness and safety of personal care products. Still, they can also present difficulties for producers and restrain market expansion.

Extensive testing and paperwork are needed to comply with these rules, which can be expensive and time-consuming. The approval procedure for novel substances can often be drawn out and difficult. These limitations may restrict the availability of cutting-edge active ingredients on the market, making it challenging for producers to meet customer needs and maintain competitiveness.

Growing Market for Anti-Aging Ingredients

The expanding market for anti-aging compounds represents a substantial opportunity in the personal care active ingredients sector. Due to the aging population and the growing desire for youthful and healthy-looking skin, there is a strong need for active substances that can address aging symptoms including wrinkles, fine lines, and sagging skin.

Manufacturers now have a chance to create and provide cutting-edge anti-aging ingredients that can deliver efficient and noticeable outcomes. For their anti-aging qualities, ingredients like retinol, hyaluronic acid, peptides, and antioxidants are in high demand. Manufacturers can take advantage of this opportunity by spending money on research and development to produce cutting-edge, scientifically validated active ingredients that meet customer demand for anti-aging products.

Customization and Personalized Skincare

The trend toward customized and tailored skincare is another big opportunity for active personal care ingredients. Customers seek goods that suit their skin conditions, preferences, and lifestyles.

Manufacturers now have the chance to create adaptable active components that can be included in unique skincare compositions. Manufacturers can empower customers to design their skincare routines and products by providing a variety of active ingredients that address various skin issues.

Using active chemicals that work with different delivery systems, including serums, creams, and masks, is another trend in personalization. Manufacturers can take advantage of this opportunity by creating adaptable active ingredients that are simple to include in various product formats, enabling customers to customize their skincare routines and achieve the best results.

Competitive Landscape

Key Players

The global personal care active ingredients market is highly competitive, with several key players. Some of the major players in the market and their market share are as follows:

  • Ashland Global Holdings Inc
  • BASF SE
  • Berkshire Hathaway Inc.
  • Clariant
  • Croda International Plc
  • Dow Inc
  • Evonik Industries
  • J.M. Huber Corporation
  • KCC Corporation
  • Solvay S.A.

Intense competition among the major players defines the competitive landscape of the personal care active ingredients industry.

International corporations and smaller specialized firms are competing for market share by providing unique and superior active ingredients. In this cutthroat industry, retaining customer loyalty, differentiating products, and pricing tactics are essential.

To quadruple the production of Uvinul A Plus, a component used for UVA (UV longest wavelength) protection, BASF SE installed a new production line at the Kaohsiung facility in Taiwan in August 2020. It is a component of many sun and skin care formulas. The production line was introduced to fulfill the growing demand from customers in the Asia Pacific region.

The acquisition of the personal care division of Schülke & Mayr GmbH by Ashland was finalized in April 2021.

Summary of Key Findings

  • Regarding material, surfactants are the market leader and will account for over 8% of market revenue by 2022, while emulsifiers are expected to grow fastest.
  • The skin care category is predicted to dominate the global market for active personal care ingredients, accounting for over 30% in 2022.
  • With a greater than one-third market share in 2022, Asia Pacific is the region driving the growth of the personal care active ingredients market. In 2022, the combined share of North America and Europe was a little under 40%. In 2022, Europe owned a share of over 22%.

Shape Your Report to Specific Countries or Regions & Enjoy 30% Off!

Future Outlook

  • The market for active compounds in personal care products has bright prospects.
  • The market is expected to expand significantly due to increased consumer demand for natural and organic items, as well as a growing interest in anti-aging therapies and customised skincare.
  • Technological development and product innovation will continue to fuel new and enhanced active ingredients.
  • The demand for superior and efficient personal care products will also be fueled by consumers’ changing lifestyle preferences and increased disposable income, providing numerous market growth opportunities.

Segmentation

  • By Ingredient type
    • Rheology Control Agents
    • Emollients
    • UV Absorbers
    • Surfactants
    • Emulsifiers
    • Antimicrobials
    • Hair Fixative Polymers
    • Conditioning Polymers
    • Cyclomethicone
    • Polyquaterniums
    • Hydrolyzates
    • Others
  • By Application
    • Skin Care
    • Men
    • Hair Care
    • Toiletries
    • Makeup
    • Fragrances
    • Oral Care
  • By Region

o North America

  • US.
  • Canada
  • Mexico

o Europe

  • Germany
  • France
  • U.K.
  • Italy
  • Spain
  • Rest of Europe

o Asia Pacific

  • China
  • Japan
  • India
  • South Korea
  • South-east Asia
  • Rest of Asia Pacific

o Latin America

  • Brazil
  • Argentina
  • Rest of Latin America

o Middle East & Africa

  • GCC Countries
  • South Africa
  • Rest of Middle East and Africa

1. Preface
1.1. Report Description
1.1.1. Purpose of the Report
1.1.2. Target Audience
1.1.3. USP and Key Offerings
1.2. Research Scope
1.3. Research Methodology
1.3.1. Phase I – Secondary Research
1.3.2. Phase II – Data Modelling
1.3.2.1. Company Share Analysis Model
1.3.2.2. Revenue Based Modelling
1.3.3. Phase III – Primary Research
1.3.4. Research Limitations
1.3.5. Assumptions
1.4. Market Introduction
1.5. Market Research Scope

2. Executive Summary
2.1. Market Snapshot: Global Personal Care Active Ingredients Market
2.2. Global Personal Care Active Ingredients Market, By Ingredient Type
2.3. Global Personal Care Active Ingredients Market, By Application
2.4. Global Personal Care Active Ingredients Market, By Region

3. Market Dynamics & Factors Analysis
3.1. Introduction
3.1.1. Global Personal Care Active Ingredients Market Value, 2017-2030, (US$ Mn)
3.1.2. Y-o-Y Growth Trend Analysis
3.2. Market Dynamics
3.2.1. Market Drivers
3.2.2. Market Restraints
3.2.3. Market Opportunities
3.2.4. Major Industry Challenges
3.3. Growth and Development Patterns
3.4. Investment Feasibility Analysis
3.5. Market Opportunity Analysis
3.5.1. Ingredient Type
3.5.2. Application
3.5.3. Geography

4. Premium Insights
4.1. STAR (Situation, Task, Action, Results) Analysis
4.2. Porter’s Five Forces Analysis
4.2.1. Threat of New Entrants
4.2.2. Bargaining Power of Buyers/Consumers
4.2.3. Bargaining Power of Suppliers
4.2.4. Threat of Substitute Ingredient Types
4.2.5. Intensity of Competitive Rivalry
4.3. Key Market Trends
4.3.1. Demand Side Trends
4.3.2. Supply Side Trends
4.4. Value Chain Analysis
4.5. Ingredient Type Analysis
4.6. Analysis and Recommendations
4.7. Marketing Strategy Analysis
4.7.1. Direct Marketing
4.7.2. Indirect Marketing
4.7.3. Marketing Channel Development Trend

5. Market Positioning of Key Players, 2022
5.1. Company market share of key players, 2022
5.2. Competitive Benchmarking
5.3. Market Positioning of Key Vendors
5.4. Geographical Presence Analysis
5.5. Major Strategies Adopted by Key Players
5.5.1. Key Strategies Analysis
5.5.2. Mergers and Acquisitions
5.5.3. Partnerships
5.5.4. Product Launch
5.5.5. Geographical Expansion
5.5.6. Others

6. Economic Impact Analysis
6.1. Recession Impact
6.1.1. North America
6.1.2. Europe
6.1.3. Asia Pacific
6.1.4. Latin America
6.1.5. Middle East and Africa
6.2. Ukraine-Russia War Impact
6.2.1. North America
6.2.2. Europe
6.2.3. Asia Pacific
6.2.4. Latin America
6.2.5. Middle East and Africa
6.3. COVID-19 Impact Analysis
6.3.1. North America
6.3.2. Europe
6.3.3. Asia Pacific
6.3.4. Latin America
6.3.5. Middle East and Africa

7. Global Personal Care Active Ingredients Market, By Ingredient Type
7.1. Global Personal Care Active Ingredients Market Overview, by Ingredient Type
7.1.1. Global Personal Care Active Ingredients Market Revenue Share, By Ingredient Type, 2022 Vs 2030 (in %)
7.2. Rheology Control Agents
7.2.1. Global Personal Care Active Ingredients Market, By Region, 2017-2030 (US$ Mn)
7.3. Emollients
7.3.1. Global Personal Care Active Ingredients Market, By Region, 2017-2030 (US$ Mn)
7.4. UV Absorbers
7.4.1. Global Personal Care Active Ingredients Market, By Region, 2017-2030 (US$ Mn)
7.5. Surfactants
7.5.1. Global Personal Care Active Ingredients Market, By Region, 2017-2030 (US$ Mn)
7.6. Emulsifiers
7.6.1. Global Personal Care Active Ingredients Market, By Region, 2017-2030 (US$ Mn)
7.7. Antimicrobials
7.7.1. Global Personal Care Active Ingredients Market, By Region, 2017-2030 (US$ Mn)
7.8. Hair Fixative Polymers
7.8.1. Global Personal Care Active Ingredients Market, By Region, 2017-2030 (US$ Mn)
7.9. Conditioning Polymers
7.9.1. Global Personal Care Active Ingredients Market, By Region, 2017-2030 (US$ Mn)
7.10. Cyclomethicone
7.10.1. Global Personal Care Active Ingredients Market, By Region, 2017-2030 (US$ Mn)
7.11. Polyquaterniums
7.11.1. Global Personal Care Active Ingredients Market, By Region, 2017-2030 (US$ Mn)
7.12. Hydrolyzates
7.12.1. Global Personal Care Active Ingredients Market, By Region, 2017-2030 (US$ Mn)
7.13. Others
7.13.1. Global Personal Care Active Ingredients Market, By Region, 2017-2030 (US$ Mn)

8. Global Personal Care Active Ingredients Market, By Application
8.1. Global Personal Care Active Ingredients Market Overview, by Application
8.1.1. Global Personal Care Active Ingredients Market, By Application, 2022 vs 2030 (in %)
8.2. Skin Care
8.2.1. Global Personal Care Active Ingredients Market, By Region, 2017-2030 (US$ Mn)
8.3. Men
8.3.1. Global Personal Care Active Ingredients Market, By Region, 2017-2030 (US$ Mn)
8.4. Hair Care
8.4.1. Global Personal Care Active Ingredients Market, By Region, 2017-2030 (US$ Mn)
8.5. Toiletries
8.5.1. Global Personal Care Active Ingredients Market, By Region, 2017-2030 (US$ Mn)
8.6. Makeup
8.6.1. Global Personal Care Active Ingredients Market, By Region, 2017-2030 (US$ Mn)
8.7. Fragrances
8.7.1. Global Personal Care Active Ingredients Market, By Region, 2017-2030 (US$ Mn)
8.8. Oral Care
8.8.1. Global Personal Care Active Ingredients Market, By Region, 2017-2030 (US$ Mn)

9. Global Personal Care Active Ingredients Market, By Region
9.1. Global Personal Care Active Ingredients Market Overview, by Region
9.1.1. Global Personal Care Active Ingredients Market, By Region, 2022 vs 2030 (in%)
9.2. Ingredient Type
9.2.1. Global Personal Care Active Ingredients Market, By Ingredient Type, 2017-2030 (US$ Mn)
9.3. Application
9.3.1. Global Personal Care Active Ingredients Market, By Application, 2017-2030 (US$ Mn)

10. North America Personal Care Active Ingredients Market Analysis
10.1. North America Personal Care Active Ingredients Market, by Ingredient Type, 2017-2030(US$ Mn)
10.1.1. Overview
10.1.2. SRC Analysis
10.2. North America Personal Care Active Ingredients Market, by Application, 2017-2030(US$ Mn)
10.2.1. Overview
10.2.2. SRC Analysis
10.3. North America Personal Care Active Ingredients Market, by Country, 2017-2030 (US$ Mn)
10.3.1. North America Personal Care Active Ingredients Market, by Country, 2022 Vs 2030 (in%)
10.3.2. U.S.
10.3.2.1. U.S. Personal Care Active Ingredients Market Estimates and Forecast, 2017-2030 (US$ Mn)
10.3.2.2. U.S. Personal Care Active Ingredients, By Ingredient Type, 2017-2030 (US$ Mn)
10.3.2.3. U.S. Personal Care Active Ingredients, By Application, 2017-2030 (US$ Mn)
10.3.3. Canada
10.3.3.1. Canada Personal Care Active Ingredients Market Estimates and Forecast, 2017-2030 (US$ Mn)
10.3.3.2. Canada Personal Care Active Ingredients, By Ingredient Type, 2017-2030 (US$ Mn)
10.3.3.3. Canada Personal Care Active Ingredients, By Application, 2017-2030 (US$ Mn
10.3.4. Mexico
10.3.4.1. Mexico Personal Care Active Ingredients Market Estimates and Forecast, 2017-2030 (US$ Mn)
10.3.4.2. Mexico Personal Care Active Ingredients, By Ingredient Type, 2017-2030 (US$ Mn)
10.3.4.3. Mexico Personal Care Active Ingredients, By Application, 2017-2030 (US$ Mn)

11. Europe Personal Care Active Ingredients Market Analysis
11.1. Europe Personal Care Active Ingredients Market, by Ingredient Type, 2017-2030(US$ Mn)
11.1.1. Overview
11.1.2. SRC Analysis
11.2. Europe Personal Care Active Ingredients Market, by Application, 2017-2030(US$ Mn)
11.2.1. Overview
11.2.2. SRC Analysis
11.3. Europe Personal Care Active Ingredients Market, by Country, 2017-2030 (US$ Mn)
11.3.1. Europe Personal Care Active Ingredients Market, by Country, 2022 Vs 2030 (in%)
11.3.2. Germany
11.3.2.1. Germany Personal Care Active Ingredients Market Estimates and Forecast, 2017-2030 (US$ Mn)
11.3.2.2. Germany Personal Care Active Ingredients, By Ingredient Type, 2017-2030 (US$ Mn)
11.3.2.3. Germany Personal Care Active Ingredients, By Application, 2017-2030 (US$ Mn)
11.3.3. France
11.3.3.1. France Personal Care Active Ingredients Market Estimates and Forecast, 2017-2030 (US$ Mn)
11.3.3.2. France Personal Care Active Ingredients, By Ingredient Type, 2017-2030 (US$ Mn)
11.3.3.3. France Personal Care Active Ingredients, By Application, 2017-2030 (US$ Mn)
11.3.4. UK
11.3.4.1. UK Personal Care Active Ingredients Market Estimates and Forecast, 2017-2030 (US$ Mn)
11.3.4.2. UK Personal Care Active Ingredients, By Ingredient Type, 2017-2030 (US$ Mn)
11.3.4.3. UK Personal Care Active Ingredients, By Application, 2017-2030 (US$ Mn)
11.3.5. Italy
11.3.5.1. Italy Personal Care Active Ingredients Market Estimates and Forecast, 2017-2030 (US$ Mn)
11.3.5.2. Italy Personal Care Active Ingredients, By Ingredient Type, 2017-2030 (US$ Mn)
11.3.5.3. Italy Personal Care Active Ingredients, By Application, 2017-2030 (US$ Mn)
11.3.6. Spain
11.3.6.1. Spain Personal Care Active Ingredients Market Estimates and Forecast, 2017-2030 (US$ Mn)
11.3.6.2. Spain Personal Care Active Ingredients, By Ingredient Type, 2017-2030 (US$ Mn)
11.3.6.3. Spain Personal Care Active Ingredients, By Application, 2017-2030 (US$ Mn)
11.3.7. Rest of Europe
11.3.7.1. Rest of Europe Personal Care Active Ingredients Market Estimates and Forecast, 2017-2030 (US$ Mn)
11.3.7.2. Rest of Europe Personal Care Active Ingredients, By Ingredient Type, 2017-2030 (US$ Mn)
11.3.7.3. Rest of Europe Personal Care Active Ingredients, By Application, 2017-2030 (US$ Mn)

12. Asia Pacific Personal Care Active Ingredients Market Analysis
12.1. Asia Pacific Personal Care Active Ingredients Market, by Ingredient Type, 2017-2030(US$ Mn)
12.1.1. Overview
12.1.2. SRC Analysis
12.2. Asia Pacific Personal Care Active Ingredients Market, by Application, 2017-2030(US$ Mn)
12.2.1. Overview
12.2.2. SRC Analysis
12.3. Asia Pacific Personal Care Active Ingredients Market, by Country, 2017-2030 (US$ Mn)
12.3.1. Asia Pacific Personal Care Active Ingredients Market, by Country, 2022 Vs 2030 (in%)
12.3.2. China
12.3.2.1. China Personal Care Active Ingredients Market Estimates and Forecast, 2017-2030 (US$ Mn)
12.3.2.2. China Personal Care Active Ingredients, By Ingredient Type, 2017-2030 (US$ Mn)
12.3.2.3. China Personal Care Active Ingredients, By Application, 2017-2030 (US$ Mn)
12.3.3. Japan
12.3.3.1. Japan Personal Care Active Ingredients Market Estimates and Forecast, 2017-2030 (US$ Mn)
12.3.3.2. Japan Personal Care Active Ingredients, By Ingredient Type, 2017-2030 (US$ Mn)
12.3.3.3. Japan Personal Care Active Ingredients, By Application, 2017-2030 (US$ Mn)
12.3.4. India
12.3.4.1. India Personal Care Active Ingredients Market Estimates and Forecast, 2017-2030 (US$ Mn)
12.3.4.2. India Personal Care Active Ingredients, By Ingredient Type, 2017-2030 (US$ Mn)
12.3.4.3. India Personal Care Active Ingredients, By Application, 2017-2030 (US$ Mn)
12.3.5. South Korea
12.3.5.1. South Korea Personal Care Active Ingredients Market Estimates and Forecast, 2017-2030 (US$ Mn)
12.3.5.2. South Korea Personal Care Active Ingredients, By Ingredient Type, 2017-2030 (US$ Mn)
12.3.5.3. South Korea Personal Care Active Ingredients, By Application, 2017-2030 (US$ Mn)
12.3.6. South-East Asia
12.3.6.1. South-East Asia Personal Care Active Ingredients Market Estimates and Forecast, 2017-2030 (US$ Mn)
12.3.6.2. South-East Asia Personal Care Active Ingredients, By Ingredient Type, 2017-2030 (US$ Mn)
12.3.6.3. South-East Asia Personal Care Active Ingredients, By Application, 2017-2030 (US$ Mn)
12.3.7. Rest of Asia Pacific
12.3.7.1. Rest of Asia Pacific Personal Care Active Ingredients Market Estimates and Forecast, 2017-2030 (US$ Mn)
12.3.7.2. Rest of Asia Pacific Personal Care Active Ingredients, By Ingredient Type, 2017-2030 (US$ Mn)
12.3.7.3. Rest of Asia Pacific Personal Care Active Ingredients, By Application, 2017-2030 (US$ Mn)

13. Latin America Personal Care Active Ingredients Market Analysis
13.1. Latin America Personal Care Active Ingredients Market, by Ingredient Type, 2017-2030(US$ Mn)
13.1.1. Overview
13.1.2. SRC Analysis
13.2. Latin America Personal Care Active Ingredients Market, by Application, 2017-2030(US$ Mn)
13.2.1. Overview
13.2.2. SRC Analysis
13.3. Latin America Personal Care Active Ingredients Market, by Country, 2017-2030 (US$ Mn)
13.3.1. Latin America Personal Care Active Ingredients Market, by Country, 2022 Vs 2030 (in%)
13.3.2. Brazil
13.3.2.1. Brazil Personal Care Active Ingredients Market Estimates and Forecast, 2017-2030 (US$ Mn)
13.3.2.2. Brazil Personal Care Active Ingredients, By Ingredient Type, 2017-2030 (US$ Mn)
13.3.2.3. Brazil Personal Care Active Ingredients, By Application, 2017-2030 (US$ Mn)
13.3.3. Argentina
13.3.3.1. Argentina Personal Care Active Ingredients Market Estimates and Forecast, 2017-2030 (US$ Mn)
13.3.3.2. Argentina Personal Care Active Ingredients, By Ingredient Type, 2017-2030 (US$ Mn)
13.3.3.3. Argentina Personal Care Active Ingredients, By Application, 2017-2030 (US$ Mn)
13.3.4. Rest of Latin America
13.3.4.1. Rest of Latin America Personal Care Active Ingredients Market Estimates and Forecast, 2017-2030 (US$ Mn)
13.3.4.2. Rest of Latin America Personal Care Active Ingredients, By Ingredient Type, 2017-2030 (US$ Mn)
13.3.4.3. Rest of Latin America Personal Care Active Ingredients, By Application, 2017-2030 (US$ Mn)

14. Middle East and Africa Personal Care Active Ingredients Market Analysis
14.1. Middle East and Africa Personal Care Active Ingredients Market, by Ingredient Type, 2017-2030(US$ Mn)
14.1.1. Overview
14.1.2. SRC Analysis
14.2. Middle East and Africa Personal Care Active Ingredients Market, by Application, 2017-2030(US$ Mn)
14.2.1. Overview
14.2.2. SRC Analysis
14.3. Middle East and Africa Personal Care Active Ingredients Market, by Country, 2017-2030 (US$ Mn)
14.3.1. Middle East and Africa Personal Care Active Ingredients Market, by Country, 2022 Vs 2030 (in%)
14.3.2. GCC Countries
14.3.2.1. GCC Countries Personal Care Active Ingredients Market Estimates and Forecast, 2017-2030 (US$ Mn)
14.3.2.2. GCC Countries Personal Care Active Ingredients, By Ingredient Type, 2017-2030 (US$ Mn)
14.3.2.3. GCC Countries Personal Care Active Ingredients, By Application, 2017-2030 (US$ Mn)
14.3.3. South Africa
14.3.3.1. South Africa Personal Care Active Ingredients Market Estimates and Forecast, 2017-2030 (US$ Mn)
14.3.3.2. South Africa Personal Care Active Ingredients, By Ingredient Type, 2017-2030 (US$ Mn)
14.3.3.3. South Africa Personal Care Active Ingredients, By Application, 2017-2030 (US$ Mn)
14.3.4. Rest of Middle East and Africa
14.3.4.1. Rest of Middle East and Africa Personal Care Active Ingredients Market Estimates and Forecast, 2017-2030 (US$ Mn)
14.3.4.2. Rest of Middle East and Africa Personal Care Active Ingredients, By Ingredient Type, 2017-2030 (US$ Mn)
14.3.4.3. Rest of Middle East and Africa Personal Care Active Ingredients, By Application, 2017-2030 (US$ Mn)

15. Company Profiles
15.1. Ashland Global Holdings Inc
15.1.1. Company Overview
15.1.2. Products/Services Portfolio
15.1.3. Geographical Presence
15.1.4. Financial Summary
15.1.4.1. Market Revenue and Net Profit (2019-2022)
15.1.4.2. Business Segment Revenue Analysis
15.1.4.3. Geographical Revenue Analysis
15.2. BASF SE
15.3. Berkshire Hathaway Inc.
15.4. Clariant
15.5. Croda International Plc
15.6. Dow Inc
15.7. Evonik Industries
15.8. J.M. Huber Corporation
15.9. KCC Corporation
15.10. Solvay S.A.

List of Figures

FIG. 1 Global Personal Care Active Ingredients Market: Research Methodology
FIG. 2 Market Size Estimation – Top Down & Bottom up Approach
FIG. 3 Global Personal Care Active Ingredients Market Segmentation
FIG. 4 Global Personal Care Active Ingredients Market, by Ingredient Type, 2022 (US$ Mn)
FIG. 5 Global Personal Care Active Ingredients Market, by Application, 2022 (US$ Mn)
FIG. 6 Global Personal Care Active Ingredients Market, by Geography, 2022 (US$ Mn)
FIG. 7 Attractive Investment Proposition, by Ingredient Type, 2022
FIG. 8 Attractive Investment Proposition, by Application, 2022
FIG. 9 Attractive Investment Proposition, by Geography, 2022
FIG. 10 Global Market Share Analysis of Key Personal Care Active Ingredients Market Manufacturers, 2022
FIG. 11 Global Market Positioning of Key Personal Care Active Ingredients Market Manufacturers, 2022
FIG. 12 Global Personal Care Active Ingredients Market Value Contribution, By Ingredient Type, 2022 & 2030 (Value %)
FIG. 13 Global Personal Care Active Ingredients Market, by Rheology Control Agents, Value, 2017-2030 (US$ Mn)
FIG. 14 Global Personal Care Active Ingredients Market, by Emollients, Value, 2017-2030 (US$ Mn)
FIG. 15 Global Personal Care Active Ingredients Market, by UV Absorbers, Value, 2017-2030 (US$ Mn)
FIG. 16 Global Personal Care Active Ingredients Market, by Surfactants, Value, 2017-2030 (US$ Mn)
FIG. 17 Global Personal Care Active Ingredients Market, by Emulsifiers, Value, 2017-2030 (US$ Mn)
FIG. 18 Global Personal Care Active Ingredients Market, by Antimicrobials, Value, 2017-2030 (US$ Mn)
FIG. 19 Global Personal Care Active Ingredients Market, by Hair Fixative Polymers, Value, 2017-2030 (US$ Mn)
FIG. 20 Global Personal Care Active Ingredients Market, by Conditioning Polymers, Value, 2017-2030 (US$ Mn)
FIG. 21 Global Personal Care Active Ingredients Market, by Cyclomethicone, Value, 2017-2030 (US$ Mn)
FIG. 22 Global Personal Care Active Ingredients Market, by Polyquaterniums, Value, 2017-2030 (US$ Mn)
FIG. 23 Global Personal Care Active Ingredients Market, by Hydrolyzates, Value, 2017-2030 (US$ Mn)
FIG. 24 Global Personal Care Active Ingredients Market, by Others, Value, 2017-2030 (US$ Mn)
FIG. 25 Global Personal Care Active Ingredients Market Value Contribution, By Application, 2022 & 2030 (Value %)
FIG. 26 Global Personal Care Active Ingredients Market, by Skin Care, Value, 2017-2030 (US$ Mn)
FIG. 27 Global Personal Care Active Ingredients Market, by Men, 2017-2030 (US$ Mn)
FIG. 28 Global Personal Care Active Ingredients Market, by Hair Care, 2017-2030 (US$ Mn)
FIG. 29 Global Personal Care Active Ingredients Market, by Toiletries, 2017-2030 (US$ Mn)
FIG. 30 Global Personal Care Active Ingredients Market, by Makeup, 2017-2030 (US$ Mn)
FIG. 31 Global Personal Care Active Ingredients Market, by Fragrances, 2017-2030 (US$ Mn)
FIG. 32 Global Personal Care Active Ingredients Market, by Oral Care, 2017-2030 (US$ Mn)
FIG. 33 North America Personal Care Active Ingredients Market, 2017-2030 (US$ Mn)
FIG. 34 U.S. Personal Care Active Ingredients Market, 2017-2030 (US$ Mn)
FIG. 35 Canada Personal Care Active Ingredients Market, 2017-2030 (US$ Mn)
FIG. 36 Europe Personal Care Active Ingredients Market, 2017-2030 (US$ Mn)
FIG. 37 Germany Personal Care Active Ingredients Market, 2017-2030 (US$ Mn)
FIG. 38 France Personal Care Active Ingredients Market, 2017-2030 (US$ Mn)
FIG. 39 U.K. Personal Care Active Ingredients Market, 2017-2030 (US$ Mn)
FIG. 40 Italy Personal Care Active Ingredients Market, 2017-2030 (US$ Mn)
FIG. 41 Spain Personal Care Active Ingredients Market, 2017-2030 (US$ Mn)
FIG. 42 Rest of Europe Personal Care Active Ingredients Market, 2017-2030 (US$ Mn)
FIG. 43 Asia Pacific Personal Care Active Ingredients Market, 2017-2030 (US$ Mn)
FIG. 44 China Personal Care Active Ingredients Market, 2017-2030 (US$ Mn)
FIG. 45 Japan Personal Care Active Ingredients Market, 2017-2030 (US$ Mn)
FIG. 46 India Personal Care Active Ingredients Market, 2017-2030 (US$ Mn)
FIG. 47 South Korea Personal Care Active Ingredients Market, 2017-2030 (US$ Mn)
FIG. 48 South-East Asia Personal Care Active Ingredients Market, 2017-2030 (US$ Mn)
FIG. 49 Rest of Asia Pacific Personal Care Active Ingredients Market, 2017-2030 (US$ Mn)
FIG. 50 Latin America Personal Care Active Ingredients Market, 2017-2030 (US$ Mn)
FIG. 51 Brazil Personal Care Active Ingredients Market, 2017-2030 (US$ Mn)
FIG. 52 Mexico Personal Care Active Ingredients Market, 2017-2030 (US$ Mn)
FIG. 53 Rest of Latin America Personal Care Active Ingredients Market, 2017-2030 (US$ Mn)
FIG. 54 Middle East & Africa Personal Care Active Ingredients Market, 2017-2030 (US$ Mn)
FIG. 55 GCC Countries Personal Care Active Ingredients Market, 2017-2030 (US$ Mn)
FIG. 56 South Africa Personal Care Active Ingredients Market, 2017-2030 (US$ Mn)
FIG. 57 Rest of Middle East and Africa Personal Care Active Ingredients Market, 2017-2030 (US$ Mn)


List of Tables

TABLE 1 Market Snapshot: Global Personal Care Active Ingredients Market
TABLE 2 Global Personal Care Active Ingredients Market: Market Drivers Impact Analysis
TABLE 3 Global Personal Care Active Ingredients Market: Market Restraints Impact Analysis
TABLE 4 Global Personal Care Active Ingredients Market, by Competitive Benchmarking, 2022
TABLE 5 Global Personal Care Active Ingredients Market, by Geographical Presence Analysis, 2022
TABLE 6 Global Personal Care Active Ingredients Market, by Key Strategies Analysis, 2022
TABLE 7 Global Personal Care Active Ingredients Market, by Ingredient Type, By Region, 2017-2022 (US$ Mn)
TABLE 8 Global Personal Care Active Ingredients Market, by Ingredient Type, By Region, 2023-2030 (US$ Mn)
TABLE 9 Global Personal Care Active Ingredients Market, by Rheology Control Agents, By Region, 2017-2022 (US$ Mn)
TABLE 10 Global Personal Care Active Ingredients Market, by Rheology Control Agents, By Region, 2023-2030 (US$ Mn)
TABLE 11 Global Personal Care Active Ingredients Market, by Emollients, By Region, 2017-2022 (US$ Mn)
TABLE 12 Global Personal Care Active Ingredients Market, by Emollients, By Region, 2023-2030 (US$ Mn)
TABLE 13 Global Personal Care Active Ingredients Market, by UV Absorbers, By Region, 2017-2022 (US$ Mn)
TABLE 14 Global Personal Care Active Ingredients Market, by UV Absorbers, By Region, 2023-2030 (US$ Mn)
TABLE 15 Global Personal Care Active Ingredients Market, by Surfactants, By Region, 2017-2022 (US$ Mn)
TABLE 16 Global Personal Care Active Ingredients Market, by Surfactants, By Region, 2023-2030 (US$ Mn)
TABLE 17 Global Personal Care Active Ingredients Market, by Emulsifiers, By Region, 2017-2022 (US$ Mn)
TABLE 18 Global Personal Care Active Ingredients Market, by Emulsifiers, By Region, 2023-2030 (US$ Mn)
TABLE 19 Global Personal Care Active Ingredients Market, by Antimicrobials, By Region, 2017-2022 (US$ Mn)
TABLE 20 Global Personal Care Active Ingredients Market, by Antimicrobials, By Region, 2023-2030 (US$ Mn)
TABLE 21 Global Personal Care Active Ingredients Market, by Hair Fixative Polymers, By Region, 2017-2022 (US$ Mn)
TABLE 22 Global Personal Care Active Ingredients Market, by Hair Fixative Polymers, By Region, 2023-2030 (US$ Mn)
TABLE 23 Global Personal Care Active Ingredients Market, by Conditioning Polymers, By Region, 2017-2022 (US$ Mn)
TABLE 24 Global Personal Care Active Ingredients Market, by Conditioning Polymers, By Region, 2023-2030 (US$ Mn)
TABLE 25 Global Personal Care Active Ingredients Market, by Cyclomethicone, By Region, 2017-2022 (US$ Mn)
TABLE 26 Global Personal Care Active Ingredients Market, by Cyclomethicone, By Region, 2023-2030 (US$ Mn)
TABLE 27 Global Personal Care Active Ingredients Market, by Polyquaterniums, By Region, 2017-2022 (US$ Mn)
TABLE 28 Global Personal Care Active Ingredients Market, by Polyquaterniums, By Region, 2023-2030 (US$ Mn)
TABLE 29 Global Personal Care Active Ingredients Market, by Hydrolyzates, By Region, 2017-2022 (US$ Mn)
TABLE 30 Global Personal Care Active Ingredients Market, by Hydrolyzates, By Region, 2023-2030 (US$ Mn)
TABLE 31 Global Personal Care Active Ingredients Market, by Skin Care, By Region, 2017-2022 (US$ Mn)
TABLE 32 Global Personal Care Active Ingredients Market, by Skin Care, By Region, 2023-2030 (US$ Mn)
TABLE 33 Global Personal Care Active Ingredients Market, by Men, By Region, 2017-2022 (US$ Mn)
TABLE 34 Global Personal Care Active Ingredients Market, by Men, By Region, 2023-2030 (US$ Mn)
TABLE 35 Global Personal Care Active Ingredients Market, by Hair Care, By Region, 2017-2022 (US$ Mn)
TABLE 36 Global Personal Care Active Ingredients Market, by Hair Care, By Region, 2023-2030 (US$ Mn)
TABLE 37 Global Personal Care Active Ingredients Market, by Toiletries, By Region, 2017-2022 (US$ Mn)
TABLE 38 Global Personal Care Active Ingredients Market, by Toiletries, By Region, 2023-2030 (US$ Mn)
TABLE 39 Global Personal Care Active Ingredients Market, by Makeup, By Region, 2017-2022 (US$ Mn)
TABLE 40 Global Personal Care Active Ingredients Market, by Makeup, By Region, 2023-2030 (US$ Mn)
TABLE 41 Global Personal Care Active Ingredients Market, by Fragrances, By Region, 2017-2022 (US$ Mn)
TABLE 42 Global Personal Care Active Ingredients Market, by Fragrances, By Region, 2023-2030 (US$ Mn)
TABLE 43 Global Personal Care Active Ingredients Market, by Oral Care, By Region, 2017-2022 (US$ Mn)
TABLE 44 Global Personal Care Active Ingredients Market, by Oral Care, By Region, 2023-2030 (US$ Mn)
TABLE 45 Global Personal Care Active Ingredients Market, by Region, 2017-2022 (US$ Mn)
TABLE 46 Global Personal Care Active Ingredients Market, by Region, 2023-2030 (US$ Mn)
TABLE 47 North America Personal Care Active Ingredients Market, by Ingredient Type, 2017-2022 (US$ Mn)
TABLE 48 North America Personal Care Active Ingredients Market, by Ingredient Type, 2023-2030 (US$ Mn)
TABLE 49 North America Personal Care Active Ingredients Market, by Application, 2017-2022 (US$ Mn)
TABLE 50 North America Personal Care Active Ingredients Market, by Application, 2023-2030 (US$ Mn)
TABLE 51 North America Personal Care Active Ingredients Market, by Country, 2017-2022 (US$ Mn)
TABLE 52 North America Personal Care Active Ingredients Market, by Country, 2023-2030 (US$ Mn)
TABLE 53 United States Personal Care Active Ingredients Market, by Ingredient Type, 2017-2022 (US$ Mn)
TABLE 54 United States Personal Care Active Ingredients Market, by Ingredient Type, 2023-2030 (US$ Mn)
TABLE 55 United States Personal Care Active Ingredients Market, by Application, 2017-2022 (US$ Mn)
TABLE 56 United States Personal Care Active Ingredients Market, by Application, 2023-2030 (US$ Mn)
TABLE 57 Canada Personal Care Active Ingredients Market, by Ingredient Type, 2017-2022 (US$ Mn)
TABLE 58 Canada Personal Care Active Ingredients Market, by Ingredient Type, 2023-2030 (US$ Mn)
TABLE 59 Canada Personal Care Active Ingredients Market, by Application, 2017-2022 (US$ Mn)
TABLE 60 Canada Personal Care Active Ingredients Market, by Application, 2023-2030 (US$ Mn)
TABLE 61 Mexico Personal Care Active Ingredients Market, by Ingredient Type, 2017-2022 (US$ Mn)
TABLE 62 Mexico Personal Care Active Ingredients Market, by Ingredient Type, 2023-2030 (US$ Mn)
TABLE 63 Mexico Personal Care Active Ingredients Market, by Application, 2017-2022 (US$ Mn)
TABLE 64 Mexico Personal Care Active Ingredients Market, by Application, 2023-2030 (US$ Mn)
TABLE 65 Europe Personal Care Active Ingredients Market, by Ingredient Type, 2017-2022 (US$ Mn)
TABLE 66 Europe Personal Care Active Ingredients Market, by Ingredient Type, 2023-2030 (US$ Mn)
TABLE 67 Europe Personal Care Active Ingredients Market, by Application, 2017-2022 (US$ Mn)
TABLE 68 Europe Personal Care Active Ingredients Market, by Application, 2023-2030 (US$ Mn)
TABLE 69 Europe Personal Care Active Ingredients Market, by Country, 2017-2022 (US$ Mn)
TABLE 70 Europe Personal Care Active Ingredients Market, by Country, 2023-2030 (US$ Mn)
TABLE 71 Germany Personal Care Active Ingredients Market, by Ingredient Type, 2017-2022 (US$ Mn)
TABLE 72 Germany Personal Care Active Ingredients Market, by Ingredient Type, 2023-2030 (US$ Mn)
TABLE 73 Germany Personal Care Active Ingredients Market, by Application, 2017-2022 (US$ Mn)
TABLE 74 Germany Personal Care Active Ingredients Market, by Application, 2023-2030 (US$ Mn)
TABLE 75 France Personal Care Active Ingredients Market, by Ingredient Type, 2017-2022 (US$ Mn)
TABLE 76 France Personal Care Active Ingredients Market, by Ingredient Type, 2023-2030 (US$ Mn)
TABLE 77 France Personal Care Active Ingredients Market, by Application, 2017-2022 (US$ Mn)
TABLE 78 France Personal Care Active Ingredients Market, by Application, 2023-2030 (US$ Mn)
TABLE 79 United Kingdom Personal Care Active Ingredients Market, by Ingredient Type, 2017-2022 (US$ Mn)
TABLE 80 United Kingdom Personal Care Active Ingredients Market, by Ingredient Type, 2023-2030 (US$ Mn)
TABLE 81 United Kingdom Personal Care Active Ingredients Market, by Application, 2017-2022 (US$ Mn)
TABLE 82 United Kingdom Personal Care Active Ingredients Market, by Application, 2023-2030 (US$ Mn)
TABLE 83 Italy Personal Care Active Ingredients Market, by Ingredient Type, 2017-2022 (US$ Mn)
TABLE 84 Italy Personal Care Active Ingredients Market, by Ingredient Type, 2023-2030 (US$ Mn)
TABLE 85 Italy Personal Care Active Ingredients Market, by Application, 2017-2022 (US$ Mn)
TABLE 86 Italy Personal Care Active Ingredients Market, by Application, 2023-2030 (US$ Mn)
TABLE 87 Spain Personal Care Active Ingredients Market, by Ingredient Type, 2017-2022 (US$ Mn)
TABLE 88 Spain Personal Care Active Ingredients Market, by Ingredient Type, 2023-2030 (US$ Mn)
TABLE 89 Spain Personal Care Active Ingredients Market, by Application, 2017-2022 (US$ Mn)
TABLE 90 Spain Personal Care Active Ingredients Market, by Application, 2023-2030 (US$ Mn)
TABLE 91 Rest of Europe Personal Care Active Ingredients Market, by Ingredient Type, 2017-2022 (US$ Mn)
TABLE 92 Rest of Europe Personal Care Active Ingredients Market, by Ingredient Type, 2023-2030 (US$ Mn)
TABLE 93 Rest of Europe Personal Care Active Ingredients Market, by Application, 2017-2022 (US$ Mn)
TABLE 94 Rest of Europe Personal Care Active Ingredients Market, by Application, 2023-2030 (US$ Mn)
TABLE 95 Asia Pacific Personal Care Active Ingredients Market, by Ingredient Type, 2017-2022 (US$ Mn)
TABLE 96 Asia Pacific Personal Care Active Ingredients Market, by Ingredient Type, 2023-2030 (US$ Mn)
TABLE 97 Asia Pacific Personal Care Active Ingredients Market, by Application, 2017-2022 (US$ Mn)
TABLE 98 Asia Pacific Personal Care Active Ingredients Market, by Application, 2023-2030 (US$ Mn)
TABLE 99 China Personal Care Active Ingredients Market, by Ingredient Type, 2017-2022 (US$ Mn)
TABLE 100 China Personal Care Active Ingredients Market, by Ingredient Type, 2023-2030 (US$ Mn)
TABLE 101 China Personal Care Active Ingredients Market, by Application, 2017-2022 (US$ Mn)
TABLE 102 China Personal Care Active Ingredients Market, by Application, 2023-2030 (US$ Mn)
TABLE 103 Japan Personal Care Active Ingredients Market, by Ingredient Type, 2017-2022 (US$ Mn)
TABLE 104 Japan Personal Care Active Ingredients Market, by Ingredient Type, 2023-2030 (US$ Mn)
TABLE 105 Japan Personal Care Active Ingredients Market, by Application, 2017-2022 (US$ Mn)
TABLE 106 Japan Personal Care Active Ingredients Market, by Application, 2023-2030 (US$ Mn)
TABLE 107 India Personal Care Active Ingredients Market, by Ingredient Type, 2017-2022 (US$ Mn)
TABLE 108 India Personal Care Active Ingredients Market, by Ingredient Type, 2023-2030 (US$ Mn)
TABLE 109 India Personal Care Active Ingredients Market, by Application, 2017-2022 (US$ Mn)
TABLE 110 India Personal Care Active Ingredients Market, by Application, 2023-2030 (US$ Mn)
TABLE 111 South Korea Personal Care Active Ingredients Market, by Ingredient Type, 2017-2022 (US$ Mn)
TABLE 112 South Korea Personal Care Active Ingredients Market, by Ingredient Type, 2023-2030 (US$ Mn)
TABLE 113 South Korea Personal Care Active Ingredients Market, by Application, 2017-2022 (US$ Mn)
TABLE 114 South Korea Personal Care Active Ingredients Market, by Application, 2023-2030 (US$ Mn)
TABLE 115 South-East Asia Personal Care Active Ingredients Market, by Ingredient Type, 2017-2022 (US$ Mn)
TABLE 116 South-East Asia Personal Care Active Ingredients Market, by Ingredient Type, 2023-2030 (US$ Mn)
TABLE 117 South-East Asia Personal Care Active Ingredients Market, by Application, 2017-2022 (US$ Mn)
TABLE 118 South-East Asia Personal Care Active Ingredients Market, by Application, 2023-2030 (US$ Mn)
TABLE 119 Rest of Asia Pacific Personal Care Active Ingredients Market, by Ingredient Type, 2017-2022 (US$ Mn)
TABLE 120 Rest of Asia Pacific Personal Care Active Ingredients Market, by Ingredient Type, 2023-2030 (US$ Mn)
TABLE 121 Rest of Asia Pacific Personal Care Active Ingredients Market, by Application, 2017-2022 (US$ Mn)
TABLE 122 Rest of Asia Pacific Personal Care Active Ingredients Market, by Application, 2023-2030 (US$ Mn)
TABLE 123 Latin America Personal Care Active Ingredients Market, by Ingredient Type, 2017-2022 (US$ Mn)
TABLE 124 Latin America Personal Care Active Ingredients Market, by Ingredient Type, 2023-2030 (US$ Mn)
TABLE 125 Latin America Personal Care Active Ingredients Market, by Application, 2017-2022 (US$ Mn)
TABLE 126 Latin America Personal Care Active Ingredients Market, by Application, 2023-2030 (US$ Mn)
TABLE 127 Brazil Personal Care Active Ingredients Market, by Ingredient Type, 2017-2022 (US$ Mn)
TABLE 128 Brazil Personal Care Active Ingredients Market, by Ingredient Type, 2023-2030 (US$ Mn)
TABLE 129 Brazil Personal Care Active Ingredients Market, by Application, 2017-2022 (US$ Mn)
TABLE 130 Brazil Personal Care Active Ingredients Market, by Application, 2023-2030 (US$ Mn)
TABLE 131 Argentina Personal Care Active Ingredients Market, by Ingredient Type, 2017-2022 (US$ Mn)
TABLE 132 Argentina Personal Care Active Ingredients Market, by Ingredient Type, 2023-2030 (US$ Mn)
TABLE 133 Argentina Personal Care Active Ingredients Market, by Application, 2017-2022 (US$ Mn)
TABLE 134 Argentina Personal Care Active Ingredients Market, by Application, 2023-2030 (US$ Mn)
TABLE 135 Rest of Latin America Personal Care Active Ingredients Market, by Ingredient Type, 2017-2022 (US$ Mn)
TABLE 136 Rest of Latin America Personal Care Active Ingredients Market, by Ingredient Type, 2023-2030 (US$ Mn)
TABLE 137 Rest of Latin America Personal Care Active Ingredients Market, by Application, 2017-2022 (US$ Mn)
TABLE 138 Rest of Latin America Personal Care Active Ingredients Market, by Application, 2023-2030 (US$ Mn)
TABLE 139 Middle East and Africa Personal Care Active Ingredients Market, by Ingredient Type, 2017-2022 (US$ Mn)
TABLE 140 Middle East and Africa Personal Care Active Ingredients Market, by Ingredient Type, 2023-2030 (US$ Mn)
TABLE 141 Middle East and Africa Personal Care Active Ingredients Market, by Application, 2017-2022 (US$ Mn)
TABLE 142 Middle East and Africa Personal Care Active Ingredients Market, by Application, 2023-2030 (US$ Mn)
TABLE 143 GCC Countries Personal Care Active Ingredients Market, by Ingredient Type, 2017-2022 (US$ Mn)
TABLE 144 GCC Countries Personal Care Active Ingredients Market, by Ingredient Type, 2023-2030 (US$ Mn)
TABLE 145 GCC Countries Personal Care Active Ingredients Market, by Application, 2017-2022 (US$ Mn)
TABLE 146 GCC Countries Personal Care Active Ingredients Market, by Application, 2023-2030 (US$ Mn)
TABLE 147 South Africa Personal Care Active Ingredients Market, by Ingredient Type, 2017-2022 (US$ Mn)
TABLE 148 South Africa Personal Care Active Ingredients Market, by Ingredient Type, 2023-2030 (US$ Mn)
TABLE 149 South Africa Personal Care Active Ingredients Market, by Application, 2017-2022 (US$ Mn)
TABLE 150 South Africa Personal Care Active Ingredients Market, by Application, 2023-2030 (US$ Mn)
TABLE 151 Rest of Middle East and Africa Personal Care Active Ingredients Market, by Ingredient Type, 2017-2022 (US$ Mn)
TABLE 152 Rest of Middle East and Africa Personal Care Active Ingredients Market, by Ingredient Type, 2023-2030 (US$ Mn)
TABLE 153 Rest of Middle East and Africa Personal Care Active Ingredients Market, by Application, 2017-2022 (US$ Mn)
TABLE 154 Rest of Middle East and Africa Personal Care Active Ingredients Market, by Application, 2023-2030 (US$ Mn)

Frequently Asked Questions

What is the current size of the global personal care active ingredients market?

The global personal care active ingredients market was valued at USD 1.7 Billion in 2022.

What is the expected growth rate of the personal care active ingredients market between 2023 and 2030?

The personal care active ingredients market is expected to grow at a CAGR of 5.5% between 2023 and 2030, reaching USD 2.4 Billion in 2030.

Which segment is leading the market share in terms of ingredient type?

Surfactants are the leading segment by ingredient type, holding over 8% share in value in 2022.

Which application ingredient type segment governs the demand for personal care active ingredients worldwide?

Skin care governs the global demand for personal care active ingredients, holding a massive share of over 30% in 2022.

Which segment is expected to post the highest CAGR during the forecast period?

The hair care equipment segment is expected to post the highest CAGR during the forecast period.

Which region is fueling the growth of the personal care active ingredients industry?

Asia Pacific is fueling the growth of the personal care active ingredients industry, with an over one-third share in 2022.

Who are the major players in the global personal care active ingredients market?

The top players include Ashland Global Holdings Inc, BASF SE, Berkshire Hathaway Inc., Clariant, and Croda International Plc .

What are the major market drivers of the personal care active ingredients industry?

The major market drivers are increasing consumer demand for natural and organic products, growing awareness about the benefits of anti-aging ingredients, and rising disposable income and changing lifestyle preferences.

What are the major market restraints of the personal care active ingredients industry?

The major market restraints are stringent regulations and safety standards imposed by regulatory bodies and volatile raw material prices.

What are the major market opportunities of the personal care active ingredients industry?

The growing market for anti-aging ingredients, customization, personalized skincare, and increasing demand for natural and organic products.

Singapore Forklift Truck Market

Published:
Report ID: 35494

Industrial Process Variable Instruments Market

Published:
Report ID: 33417

Electrical Enclosure Market

Published:
Report ID: 5609

Rice Milling Machinery Market

Published:
Report ID: 31803

Vacuum Coating Equipment Market

Published:
Report ID: 23234

Rotary Dryer Market

Published:
Report ID: 23173

Rolling Bed Dryer Market

Published:
Report ID: 23152

Fluidized Bed Dryer Market

Published:
Report ID: 22956

Hexagon Head Set Screws Market

Published:
Report ID: 19289

Peltier Cooled Incubator Market

Published:
Report ID: 21117

Fill-Finish Manufacturing Equipment Market

Published:
Report ID: 20349

Flat Washers Market

Published:
Report ID: 20332

Purchase Options

$2999
Delivery Format: Excel.
$4999
Designed for the individual purchaser.
$6999
Users located at a single corporate site or regional office.
$7999
Allowed for unlimited sharing globally within one company.
Smallform of Sample request

Have a question?

User Profile

Don’t settle for less – trust Mitul to help you find the best solution.

Report delivery within 24 to 48 hours

– Other Info –

What people say?-

User Review

I am very impressed with the information in this report. The author clearly did their research when they came up with this product and it has already given me a lot of ideas.

Jana Schmidt
CEDAR CX Technologies

– Connect with us –

Phone

+91 6232 49 3207


support

24/7 Research Support


sales@credenceresearch.com

– Research Methodology –

Going beyond the basics: advanced techniques in research methodology

– Trusted By –

Pepshi, LG, Nestle
Motorola, Honeywell, Johnson and johnson
LG Chem, SIEMENS, Pfizer
Unilever, Samsonite, QIAGEN