
Market Overview
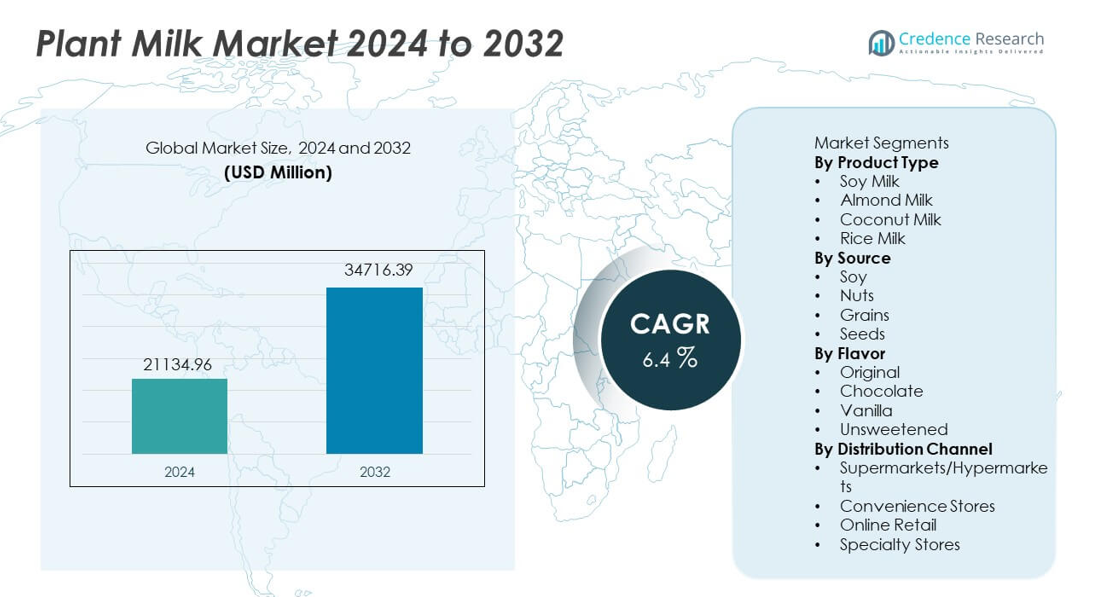
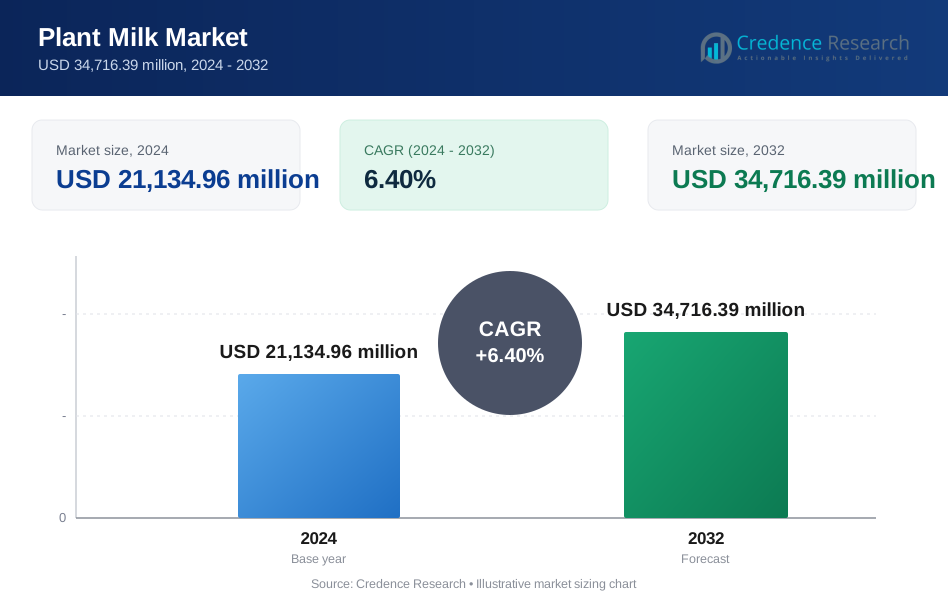
The Plant Milk market was valued at USD 21,134.96 million in 2024 and is projected to reach USD 34,716.39 million by 2032, expanding at a CAGR of 6.4% during the forecast period.
| REPORT ATTRIBUTE | DETAILS |
|---|---|
| Historical Period | 2020-2023 |
| Base Year | 2024 |
| Forecast Period | 2025-2032 |
| Plant Milk Market Size 2024 | USD 21,134.96 million |
| Plant Milk Market, CAGR | 6.4% |
| Plant Milk Market Size 2032 | USD 34,716.39 million |
Top players in the Plant Milk market include Danone, Oatly, Blue Diamond Growers, Califia Farms, Alpro, Silk, Ripple Foods, Elmhurst, So Delicious, and Pacific Foods, each expanding their reach through fortified recipes, clean-label positioning, and broader distribution networks. These brands invest in sustainable sourcing, low-sugar formulations, and barista-grade variants to meet changing taste preferences and dairy-free lifestyles. North America leads the market with 39% share, driven by strong lactose-free adoption and high demand for oat and almond milk, while Europe holds 32% share supported by clean-label consumption and sustainability awareness.
Market Insights
- The Plant Milk market reached USD 21,134.96 million in 2024 and will reach USD 34,716.39 million by 2032, growing at a CAGR of 6.4.
- Growth rises as consumers adopt lactose-free diets and vegan lifestyles, with soy milk leading the product segment at 39% share due to strong nutritional benefits and broad retail penetration.
- Trends expand as oat, almond, and barista-style variants gain popularity in cafés and foodservice, supported by rising wellness preferences and sustained global interest in dairy alternatives.
- Competition intensifies as leading brands invest in fortified formulations, sustainable ingredient sourcing, and flavor innovation to strengthen category presence across supermarkets and online channels.
- North America leads with 39% share, followed by Europe at 32%, Asia Pacific at 20%, Latin America at 6%, and Middle East and Africa at 3%, reflecting diverse adoption, flavor preferences, and economic patterns across regions.
Market Segmentation Analysis:
By Product Type
Soy milk leads this segment with 39% share, supported by strong nutritional profiles, high protein content, and wide acceptance as a dairy alternative. Almond milk shows steady growth due to its low-calorie appeal and strong penetration in retail channels. Coconut milk gains traction in Asian and Western markets due to versatile culinary applications. Rice milk remains niche yet expands through increased lactose-free and hypoallergenic demand. Growing vegan adoption and rising health awareness continue to push demand across product types, while regional brands introduce fortified and organic variants that strengthen category reach.
- For instance, Danone reports that Silk Soymilk contains 8 grams of protein per cup, which matches the protein content of dairy milk according to USDA nutritional data.
By Source
Soy dominates the source category with 41% share, driven by strong availability, cost-effectiveness, and recognized nutritional benefits. Nuts gain strong popularity across almond, cashew, and hazelnut sources, supported by premium positioning and taste preferences. Grains experience steady adoption as oat and rice options become mainstream due to creamy texture and allergen-friendly properties. Seed-based milk, including hemp and flax, grows gradually with sustainability-focused buyers. Functional benefits and evolving formulations help strengthen acceptance across all source categories.
- For instance, Oatly reports 2 grams of beta-glucan per 250-milliliter serving, based on EFSA reviewed nutritional statements.
By Flavor
Original flavor holds 46% share, driven by preference for natural taste profiles and suitability for both beverages and cooking. Unsweetened plant milk gains momentum among health-conscious consumers who seek reduced sugar intake. Vanilla flavor finds steady acceptance in coffee and bakery applications, while chocolate-focused products attract younger demographics. Product innovation focuses on low-sugar, fortified formulations and barista-style variants that improve texture and foam performance. Retail chains continue expanding flavor assortments as consumption becomes more lifestyle driven across global markets
Key Growth Drivers
Rising Shift Toward Lactose-Free and Vegan Alternatives
Demand rises as consumers adopt dairy-free diets due to lactose intolerance, vegan lifestyles, and growing awareness of animal welfare. Plant milk products offer low-cholesterol benefits and allergen-friendly alternatives that appeal to health-focused buyers. Retail chains expand shelf presence for soy, almond, and oat variants, increasing visibility across regions. Foodservice outlets adopt plant milk options in coffee and bakery menus, strengthening mainstream penetration. Continued awareness of dairy allergies, environmental impacts, and ethical consumption supports strong long-term growth across global markets.
- For instance, Starbucks confirmed that company-owned stores across various regions, including the U.S., Canada, the UK, China, and parts of Europe, now list almond, soy, and oat milk as permanent menu items, according to its sustainability reporting and recent announcements, with some locations removing the extra charge for these options.
Expansion of Functional and Fortified Plant Milk Products
Growth accelerates as manufacturers introduce fortified plant milk enriched with calcium, vitamins, and plant-based proteins. Consumers seek clean-label beverages that deliver nutritional equivalence to dairy milk. Barista editions improve foaming performance for coffee applications, supporting sales in cafés and beverage outlets. Functional blends featuring omega-3, probiotics, and mineral additives gain traction among wellness buyers. These innovations help reduce nutritional gaps, encouraging broader use among children and adults seeking healthy replacements.
- For instance, Alpro confirms 120 milligrams of calcium per 100 milliliters in its fortified soya drink, documented under EU nutrition claims regulation.
Increasing Preference for Sustainable and Low-Carbon Choices
Demand strengthens as plant milk aligns with sustainability goals, lower greenhouse emissions, and responsible ingredient sourcing. Consumers who seek eco-friendly lifestyles adopt almond, oat, soy, and coconut milk due to reduced environmental impact compared to dairy. Brands highlight sustainable farming, recyclable packaging, and water-efficient production to boost credibility. Rapid growth of sustainability campaigns and environmental awareness among younger demographics supports long-term category expansion.
Key Trends & Opportunities
Rapid Growth of Oat and Seed-Based Variants
Oat milk shows fast adoption due to creamy taste, allergen-friendly composition, and café-ready performance. Seed-based offerings such as hemp and flax expand among sustainability-focused consumers looking for nutrient-rich choices. Manufacturers introduce flavored and barista-style oat variants to enhance foodservice use. This trend supports premium pricing and greater brand differentiation in competitive aisles.
- For instance, Oatly states its flagship oat drink contains a specific amount of beta-glucan per serving, which contributes to the daily amount referenced in EFSA-approved health claims.
Rising Penetration in Foodservice and Coffee Chains
Foodservice adoption expands as cafés, bakeries, and beverage outlets add plant milk options for coffee, smoothies, and desserts. Barista-grade formulations improve texture, dairy-like frothing, and flavor stability. Partnerships with coffee retailers boost trial and accelerate category normalization in daily consumption patterns.
- For instance, Pret A Manger confirms plant-based milk alternatives are available across all UK stores, alongside organic dairy options, under corporate responsibility updates.
Key Challenges
Higher Retail Pricing Compared to Traditional Dairy Milk
Plant milk remains costlier than dairy due to ingredient sourcing, production processes, and limited economies of scale. Price sensitivity slows adoption in budget-conscious markets. Manufacturers strive to lower costs through regional ingredient sourcing and optimized production technologies, but affordability remains a constraint.
Allergen and Ingredient Labeling Complexity
Soy, nuts, and gluten-linked ingredients require strict labeling under regional safety regulations. This creates uncertainty among sensitive consumers and restricts broader household usage. Brands must invest in clear labeling and allergen-free production practices to expand adoption across larger demographics.
Regional Analysis
North America
North America leads the market with 39% share, driven by rising adoption of dairy-free diets, strong vegan movements, and high awareness of lactose intolerance. Retail chains dedicate larger shelf space for plant milk, supported by barista-style variants and fortified offerings. Consumers prefer almond and oat milk due to nutritional positioning and low-calorie claims. Foodservice and coffee chains expand menus with plant-based options, boosting mainstream usage. Marketing campaigns around sustainability and animal welfare also support category growth. Increasing demand across the United States and Canada strengthens long-term regional expansion.
Europe
Europe holds 32% share, supported by strong preference for clean-label and dairy-free beverages across leading markets such as the United Kingdom, Germany, France, and Italy. High lactose intolerance in Southern Europe strengthens demand, while Western Europe drives clean-label innovation. Oat and soy milk remain widely adopted across retail channels, supported by eco-conscious buyers and strong sustainability awareness. Government regulations on dairy labeling and sugar reduction encourage healthier consumption behavior. Premium organic products gain momentum across supermarkets and specialty stores.
Asia Pacific
Asia Pacific accounts for 20% share, fueled by traditional soy consumption and rising lactose intolerance among large populations in China, India, and Japan. Expanding middle-class income and growing café culture increase demand for plant-based beverages. Coconut milk holds strong cultural use in Southeast Asia, while almond and oat products gain popularity among health-conscious youth. E-commerce growth allows premium and imported brands to reach new consumers across urban centers. Government initiatives promoting plant-based diets and wellness further support regional adoption.
Latin America
Latin America captures 6% share, driven by increased awareness of plant-based nutrition and rising adoption in Brazil, Mexico, and Argentina. Consumers shift toward dairy alternatives due to lactose intolerance and interest in low-fat beverages. Supermarkets expand assortments of soy and coconut milk, influenced by tropical ingredient availability and rising wellness trends. Economic conditions impact premium product purchases, but steady interest in healthy beverages supports ongoing demand. Foodservice outlets increasingly introduce plant milk options across urban regions.
Middle East & Africa
Middle East and Africa hold 3% share, supported by growing interest in healthier beverages and rising urban consumption in Gulf countries and South Africa. Lactose intolerance rates encourage steady demand for soy and almond-based alternatives. Premium imports dominate due to limited local production and reliance on international brands. Retail expansion increases visibility in health-focused categories, but affordability challenges slow wider penetration. Education campaigns and sampling initiatives will help drive future growth in emerging markets across the region.
Market Segmentations:
By Product Type
- Soy Milk
- Almond Milk
- Coconut Milk
- Rice Milk
By Source
- Soy
- Nuts
- Grains
- Seeds
By Flavor
- Original
- Chocolate
- Vanilla
- Unsweetened
By Distribution Channel
- Supermarkets/Hypermarkets
- Convenience Stores
- Online Retail
- Specialty Stores
By Geography
- North America
- U.S.
- Canada
- Mexico
- Europe
- Germany
- France
- U.K.
- Italy
- Spain
- Rest of Europe
- Asia Pacific
- China
- Japan
- India
- South Korea
- South-east Asia
- Rest of Asia Pacific
- Latin America
- Brazil
- Argentina
- Rest of Latin America
- Middle East & Africa
- GCC Countries
- South Africa
- Rest of the Middle East and Africa
Competitive Landscape
The competitive landscape features leading companies such as Danone, Oatly, Blue Diamond Growers, Califia Farms, Alpro, Silk, Ripple Foods, Elmhurst, So Delicious, and Pacific Foods, all working to expand their portfolios across various plant-based milk formats. Major players invest in product innovation, fortified formulations, and barista-style variants that support adoption in foodservice channels. Companies strengthen distribution through retail partnerships, e-commerce strategies, and global expansion initiatives. Many brands emphasize sustainable sourcing, recyclable packaging, and ethical ingredient selection to appeal to eco-conscious buyers. Regional players introduce nut-based and grain-based milk at affordable price points, intensifying competition. Premium brands focus on flavor innovation and nutritional equivalence to dairy, while new entrants target niche segments such as organic, unsweetened, and allergen-free plant milk. Growing competition encourages continuous R&D, improved taste profiles, and greater global branding efforts.
Key Player Analysis
- Danone
- Oatly
- Blue Diamond Growers
- Califia Farms
- Alpro
- Silk
- Ripple Foods
- Elmhurst
- So Delicious
- Pacific Foods
Recent Developments
- In November 2025, Danone launched Silk Protein, a range of plant-based milks containing 13 grams of complete protein and 3 grams of fiber per serving, aimed at reinvigorating interest in plant-based dairy while targeting a gap in protein-focused plant-based drinks.
- In February 2024, Califia Farms launched Califia Farms Complete. The product highlights nine essential nutrients and 8 grams of protein per serving from a pea, chickpea, and fava bean blend.
- In January 2024, Oatly launched Unsweetened and Super Basic in the U.S. Unsweetened offers 0g sugar and 40 calories per serving, while Super Basic uses four ingredients
Report Coverage
The research report offers an in-depth analysis based on Product Type, Source, Flavor, Distribution Channel and Geography. It details leading market players, providing an overview of their business, product offerings, investments, revenue streams, and key applications. Additionally, the report includes insights into the competitive environment, SWOT analysis, current market trends, as well as the primary drivers and constraints. Furthermore, it discusses various factors that have driven market expansion in recent years. The report also explores market dynamics, regulatory scenarios, and technological advancements that are shaping the industry. It assesses the impact of external factors and global economic changes on market growth. Lastly, it provides strategic recommendations for new entrants and established companies to navigate the complexities of the market.
Future Outlook
- Demand for dairy-free beverages will rise as lactose intolerance awareness increases.
- Brands will expand barista-grade formulations that improve foaming and texture.
- Functional and fortified plant milk will gain traction across wellness categories.
- Oat and seed-based products will grow due to sustainable sourcing appeal.
- Digital retail platforms will support wider access across international markets.
- Clean-label preferences will drive low-sugar and additive-free product development.
- Foodservice adoption will expand as coffee chains add plant milk options.
- Regional flavor innovation will rise to match local preferences and cuisines.
- Supply chain efficiency will become key as brands aim to reduce production costs.
- Investments in R&D will increase to enhance nutritional equivalence with traditional dairy
Request a Free Sample
Fill in your details and we'll send you a free sample report.
- Sample data tables & charts
- Research methodology
Need a Custom Version of This Report?
Tailor the scope, geography, or segments to your exact requirements.
- Custom geography or segment scope
- Direct access to our analyst team
Frequently Asked Questions
What is the current market size for Plant Milk market, and what is its projected size in 2032?
At what Compound Annual Growth Rate is the Plant Milk market projected to grow between 2025 and 2032?
Which Plant Milk market segment held the largest share in 2024?
What are the primary factors fueling the growth of the Plant Milk market?
Who are the leading companies in the Plant Milk market?
Table of Content
Chapter 1. Report Introduction
- 1.1 Report Description & Purpose
- 1.1.1 Report Title & Market Definition
- 1.1.2 Unique Selling Propositions (USP) & Key Differentiators
- 1.1.3 Value Proposition for Stakeholders
- 1.2 Research Objectives
- 1.2.1 Market Sizing Objectives (Volume & Revenue)
- 1.2.2 Segmentation Objectives
- 1.2.3 Competitive Intelligence Objectives
- 1.2.4 Forecast & Scenario Objectives
- 1.3 Report Scope
- 1.3.1 Plant Milk Scope – Types & Subtypes Covered
- 1.3.2 Geographic Scope – Regions & Countries Covered
- 1.3.3 Historical Period, Base Year & Forecast Period (2024; forecast to 2032)
- 1.3.4 Inclusions & Exclusions
- 1.4 HS Code & Classification Framework
- 1.5 Currency, Units & Pricing Basis
- 1.6 Target Stakeholders
- 1.7 Limitations & Assumptions
Chapter 2. Executive Summary
- 2.1 Global Plant Milk Market Snapshot
- 2.1.1 Market Size – Historical (2024) & Forecast (2024-2032) (2024: USD 21,134.96 million → 2032: USD 34,716.39 million)
- 2.1.2 Volume & Revenue – Global Totals
- 2.1.3 Key Market Highlights – Top Five Facts
- 2.2 Plant Milk Market Segmentation Snapshot
- 2.2.1 Market Split by Region – 2024 vs. 2032
- 2.3 Competitive Snapshot
- 2.3.1 Top 10 Players by Revenue Share – 2024
- 2.3.2 Top 10 Players by Volume Share – 2024
- 2.3.3 Recent Strategic Developments (18-Month Summary)
- 2.4 Key Investment Highlights & Strategic Conclusions
Chapter 3. Plant Milk Market Dynamics & Industry Analysis
- 3.1 Market Overview & Context
- 3.1.1 Plant Milk Market Position in the Broader Automotive Value Chain
- 3.1.2 OEM vs. Replacement Market Dynamics
- 3.1.3 Market Maturity & Development Stage by Region
- 3.2 Plant Milk Market Drivers
- 3.3 Plant Milk Market Restraints & Challenges
- 3.4 Plant Milk Market Opportunities
- 3.5 Porter's Five Forces Analysis
- 3.5.1 Threat of New Entrants
- 3.5.2 Bargaining Power of Suppliers
- 3.5.3 Bargaining Power of Buyers
- 3.5.4 Threat of Substitutes
- 3.5.5 Competitive Rivalry – Intensity Assessment
- 3.6 Plant Milk Value Chain Analysis
- 3.6.1 Upstream – Raw Material/Input Suppliers
- 3.6.1.1 Raw Material/Input 1
- 3.6.1.2 Raw Material/Input 2
- 3.6.1.3 Raw Material/Input 3
- 3.6.2 Midstream – Production/Manufacturing/Service Delivery
- 3.6.2.1 Production/Process Overview
- 3.6.2.2 Key Facility Locations & Capacity by Manufacturer
- 3.6.3 Downstream – Distribution & End Consumer
- 3.6.3.1 Primary Channel – B2B/OEM
- 3.6.3.2 Secondary Channels – Dealer, Retail, Online, Direct
- 3.6.4 Value Chain Profitability Analysis
- 3.6.1 Upstream – Raw Material/Input Suppliers
- 3.7 PESTEL Analysis
- 3.7.1 Political Factors
- 3.7.2 Economic Factors
- 3.7.3 Social Factors
- 3.7.4 Technological Factors
- 3.7.5 Environmental Factors
- 3.7.6 Legal Factors
- 3.8 Plant Milk Supply Chain Analysis
- 3.8.1 Raw Material/Input Supply Risk Assessment
- 3.8.2 Manufacturing Concentration Risk (Geographic Exposure)
- 3.8.3 Trade Disruption Impact Analysis
- 3.9 Regulatory & Policy Landscape
Note: The regulatory and policy landscape section covers regulations based on their applicability to the market, Plant Milk category, geography, and scope of the study. Only regulatory frameworks with a material impact on operations, compliance, trade, sustainability, or market access are analyzed in detail.
Chapter 4. Key Investment Pockets & Opportunity Analysis
- 4.1 Plant Milk Market Attractiveness Analysis
- 4.1.1 By Region – Investment Attractiveness Matrix (Volume × CAGR)
- 4.2 Absolute Revenue Growth Opportunity
- 4.2.1 By Region – Absolute USD Growth Through 2032
- 4.3 Incremental Volume Opportunity
- 4.3.1 By Region – Incremental Volume Through 2032
- 4.3.2 Segment – Incremental Volume
- 4.4 Emerging Submarket Opportunity Deep Dive (Subject to Applicability)
- 4.5 Emerging Market Opportunity Scorecards
- 4.5.1 United States
- 4.5.2 Europe
- 4.5.3 Asia
- 4.5.4 Middle East & Africa
Note: Emerging Market Opportunity Scorecards will be included based on relevance and strategic importance. Regions listed are indicative and may vary depending on data availability and market dynamics.
Chapter 5. Plant Milk Import-Export Analysis & Trade Flows
- 5.1 Global Trade Overview
- 5.1.1 Global Export Value by Country (2024)
- 5.1.2 Global Export Volume by Country (2024)
- 5.1.3 Global Import Value by Country (2024)
- 5.1.4 Global Import Volume by Country (2024)
- 5.1.5 Net Trade Balance by Country (2024)
- 5.2 Export Analysis – Segment
- 5.2.1 Type 1 (HS Code)
- 5.2.2 Type 2 (HS Code)
- 5.2.3 Type 3 (HS Code)
- 5.2.4 Type 4 (HS Code)
- 5.2.5 Type 5 (HS Code)
- 5.3 Import Analysis – Segment
- 5.3.1 Type 1 (HS Code)
- 5.3.2 Type 2 (HS Code)
- 5.3.3 Type 3 (HS Code)
- 5.3.4 Type 4 (HS Code)
- 5.3.5 Type 5 (HS Code)
- 5.4 Average Unit Trade Prices
- 5.4.1 Average Export Price – Segment & Country
- 5.4.2 Average Import Price – Segment & Source Country
- 5.4.3 Price Trends (2024)
- 5.5 Key Trade Route Analysis
- 5.5.1 Trade Route 1
- 5.5.2 Trade Route 2
- 5.5.3 Trade Route 3
- 5.5.4 Trade Route 4
- 5.5.5 Trade Route 5
- 5.6 Trade Policy Impact Assessment
- 5.6.1 US Anti-Dumping & Section 301 Tariffs
- 5.6.2 EU Customs Union Impact
- 5.6.3 Major Free Trade Agreements
- 5.6.4 USMCA Rules of Origin
Note: Trade policy analysis will be included only where relevant to the Plant Milk market.
Chapter 6. Competitive Landscape & Company Benchmarking
- 6.1 Plant Milk Market Concentration & Structure
- 6.1.1 Herfindahl-Hirschman Index (HHI) – vs. 2024
- 6.1.2 Tier 1, Tier 2 & Tier 3 Market Structure
- 6.1.3 Global, Regional & Local Player Dynamics
- 6.2 Plant Milk Market Share Analysis – 2024
- 6.2.1 Global Revenue Share by Company
- 6.2.2 Global Volume Share by Company
- 6.2.3 Regional Revenue Share
- 6.2.4 Market Share Evolution ( vs. 2024)
- 6.2.5 OEM Segment Share by Company
- 6.2.6 Replacement Segment Share by Company
- 6.3 Production/Delivery Capacity & Facility Analysis
- 6.3.1 Global Installed Capacity
- 6.3.2 Capacity Utilization Rates
- 6.3.3 Production/Output Volume
- 6.3.4 Facility Locations & Capacity Map
- 6.3.5 Planned Capacity Additions
- 6.4 Plant Milk Competitive Benchmarking Matrix
- 6.4.1 Revenue, Volume, CAGR & Profitability Comparison
- 6.4.2 Channel Revenue Mix
- 6.4.3 Geographic Revenue Exposure
- 6.4.4 R&D Intensity
- 6.4.5 Sustainability Maturity
- 6.5 Strategic Developments in Plant Milk (Last 24 Months)
- 6.5.1 Mergers, Acquisitions & Divestments
- 6.5.2 New Plant Milk Launches
- 6.5.3 Facility Expansions
- 6.5.4 Strategic Alliances, Joint Ventures & Partnerships
- 6.5.5 Distribution Expansion & Market Entry
- 6.5.6 Sustainability & ESG Initiatives
- 6.6 Competitive Strategy Mapping
- 6.6.1 Leader, Challenger, Follower & Niche Classification
- 6.6.2 Pricing Strategy Comparison
- 6.6.3 Channel Strategy Matrix
Note: Strategic developments are included based on their materiality and the availability of reliable information.
Chapter 7. Global Plant Milk Market – By Distribution Channel
- 7.1 Segment Overview
- 7.1.1 Volume & Revenue Split by Channel (2024 & 2032)
- 7.1.2 Channel Mix Evolution (2024-2032)
Chapter 8. Regional Market Analysis – Global Overview
- 8.1 Global Regional Overview
- 8.1.1 Regional Volume Share
- 8.1.2 Regional Revenue Share
- 8.1.3 Regional Volume by Region
- 8.1.4 Regional Revenue by Region
- 8.1.5 Regional Forecast Through 2032
- 8.2 Cross-Regional Segment Analysis
- 8.2.1 By Distribution Channel
- 8.2.2 By Brand/Price Tier
Chapter 9. North America Plant Milk Market
- 9.1 United States
- 9.2 Canada
- 9.3 Mexico
Chapter 10. Europe Plant Milk Market
- 10.1 Germany
- 10.2 France
- 10.3 Italy
- 10.4 United Kingdom
- 10.5 Spain
- 10.6 Poland
- 10.7 Russia
- 10.8 Netherlands
- 10.9 Belgium
- 10.10 Sweden
- 10.11 Denmark
- 10.12 Norway
- 10.13 Rest of Europe
Chapter 11. Asia Pacific Plant Milk Market
- 11.1 China
- 11.2 India
- 11.3 Japan
- 11.4 South Korea
- 11.5 Thailand
- 11.6 Indonesia
- 11.7 Vietnam
- 11.8 Malaysia
- 11.9 Australia
- 11.10 Rest of Asia Pacific
Chapter 12. Latin America Plant Milk Market
- 12.1 Brazil
- 12.2 Argentina
- 12.3 Colombia
- 12.4 Chile
- 12.5 Rest of Latin America
Chapter 13. Middle East Plant Milk Market
- 13.1 Saudi Arabia
- 13.2 United Arab Emirates
- 13.3 Turkey
- 13.4 Israel
- 13.5 Iran
- 13.6 Rest of the Middle East
Chapter 14. Africa Plant Milk Market
- 14.1 South Africa
- 14.2 Egypt
- 14.3 Nigeria
- 14.4 Morocco
- 14.5 Rest of Africa
Chapter 15. Plant Milk Company Profiles
- 15.1 [Company 01]
- 15.1.1 Company Overview
- 15.1.2 Key Management Personnel
- 15.1.3 Products & Services Portfolio
- 15.1.4 Financial Performance
- 15.1.5 Key Market Focus & Geographic Presence
- 15.1.6 Recent Developments & Strategic Initiatives
Note: The company profile list is preliminary and may change based on research findings, market developments, data availability, and client requirements.
Chapter 16. Appendices
- Appendix A – List of Abbreviations & Acronyms
- Appendix B – Industry Classification Code Reference – Full Series
- Appendix C – Production & Capacity Data Tables
- Appendix D – End-Use & Demand Base Tables
- Appendix E – Consumption & Replacement Rate Assumptions
- Appendix F – ASP Reference Tables
- Appendix G – Manufacturing & Facility Database
- Appendix H – Import-Export Data Tables
- Appendix I – Regulatory Summary Tables
- Appendix J – Primary Research Participant List (Anonymized)
- Appendix K – Primary Research Questionnaire Framework
- Appendix L – Data Sources & Bibliography
- Appendix M – Market Size Divergence & Source Comparison
Chapter 17. Research Methodology
- 17.1 Research Framework & Philosophy
- 17.2 Secondary Research – Sources, Hierarchy & Data Extraction
- 17.3 Data Modeling – Bottom-Up & Top-Down Market Sizing
- 17.4 Primary Research – Stakeholder Framework, LOI & Sample Sizes
- 17.5 Forecast Methodology – Regression, Scenario & Sensitivity Analysis
- 17.6 Quality Control – Four-Layer Validation Framework
- 17.7 Limitations & Standard Assumptions
- 17.8 Disclaimer
