Market Overview
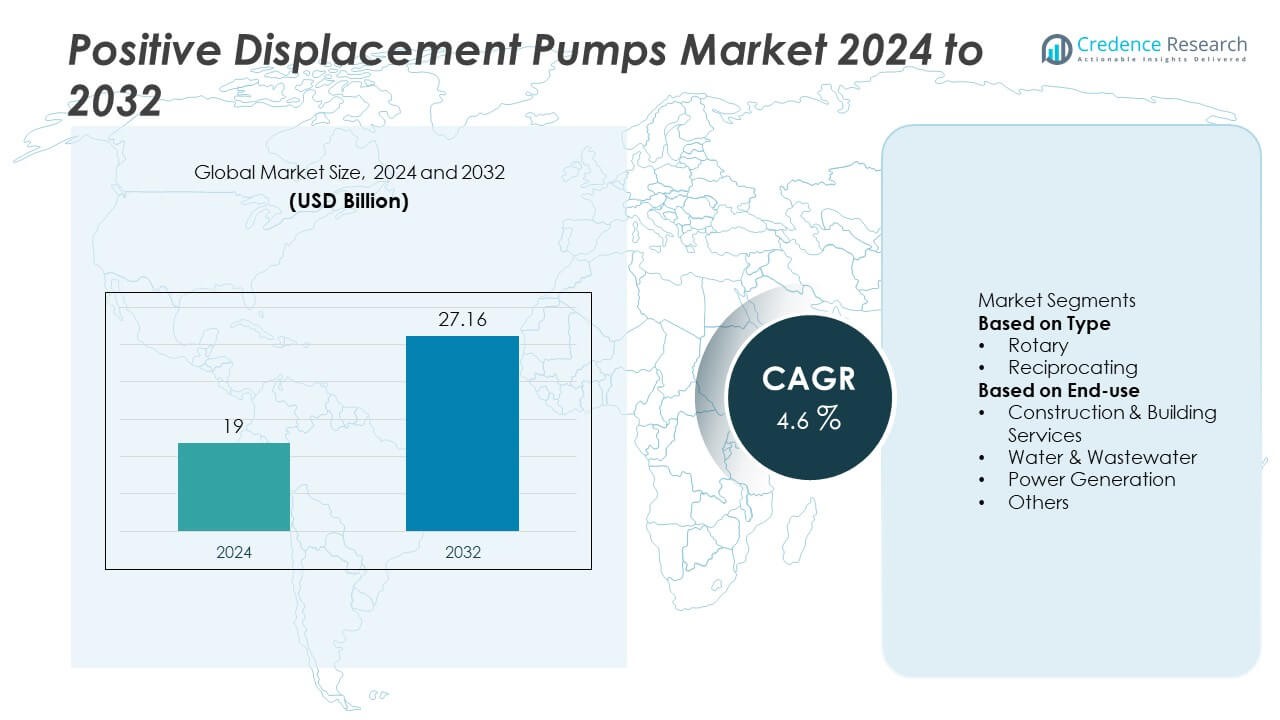
The global Positive Displacement Pumps Market was valued at USD 19 billion in 2024 and is projected to reach USD 27.16 billion by 2032, expanding at a CAGR of 4.6% during the forecast period.
| REPORT ATTRIBUTE |
DETAILS |
| Historical Period |
2020-2023 |
| Base Year |
2024 |
| Forecast Period |
2025-2032 |
| Positive Displacement Pumps Market Size 2024 |
USD 19 Billion |
| Positive Displacement Pumps Market, CAGR |
4.6% |
| Positive Displacement Pumps Market Size 2032 |
USD 27.16 Billion |
The positive displacement pumps market is dominated by leading players such as Grundfos, Schlumberger Limited, SPX Flow, Sulzer Ltd., Viking Pump, Inc., Weir Group PLC, Alfa Laval, Ingersoll Rand, IDEX Corporation, and KSB Group. These companies focus on energy-efficient designs, digital monitoring, and application-specific product innovation to strengthen their market presence. North America leads the global market with a 33.5% share in 2024, driven by robust demand from oil and gas, wastewater, and power generation sectors. Europe follows with 28.7% share, supported by sustainability initiatives and modernization of industrial infrastructure, while Asia-Pacific, holding 26.9% share, emerges as the fastest-growing region due to rapid industrialization and strong investments in water and construction projects.
Access crucial information at unmatched prices!
Request your sample report today & start making informed decisions powered by Credence Research Inc.!
Download Sample
Market Insights
- The global positive displacement pumps market was valued at USD 19 billion in 2024 and is projected to reach USD 27.16 billion by 2032, expanding at a CAGR of 4.6%.
- Rising demand from water and wastewater treatment, oil and gas, and chemical industries is driving market growth, supported by infrastructure development and industrial automation.
- Key trends include adoption of IoT-enabled monitoring systems, energy-efficient designs, and the integration of smart controls to enhance reliability and performance.
- Major players such as Grundfos, Sulzer Ltd., Schlumberger Limited, IDEX Corporation, and Alfa Laval focus on innovation, product expansion, and strategic mergers to strengthen global presence.
- North America leads with 33.5% share, followed by Europe at 28.7% and Asia-Pacific at 26.9%; by type, rotary pumps dominate with 61.4% share, while water and wastewater applications account for 38.2% of total market demand.
Market Segmentation Analysis:
By Type
The rotary segment dominates the positive displacement pumps market with a 61.4% share in 2024. Rotary pumps are widely used due to their ability to handle high-viscosity fluids and deliver consistent flow rates. They are preferred in industries such as oil and gas, chemicals, and food processing for efficient fluid transfer and minimal pulsation. Advancements in screw and gear pump designs have improved energy efficiency and durability, enhancing operational reliability. The reciprocating segment follows, driven by increasing adoption in applications requiring high-pressure delivery and precise flow control, including power generation and water treatment.
- For instance, Fristam Pumps, a leading manufacturer in this segment, has developed high-efficiency screw pumps that offer a 20% reduction in energy consumption compared to previous models, leading to increased operational savings in food processing and pharmaceutical applications.
By End-use
The water and wastewater segment leads the market with around 38.2% share in 2024. Its dominance is attributed to the growing need for efficient fluid handling systems in municipal and industrial water treatment facilities. Rising investments in water infrastructure modernization and environmental compliance have increased the demand for positive displacement pumps capable of handling slurries and viscous materials. The construction and building services sector is also expanding with increasing use of pumps in HVAC systems and pressure boosting applications, while the power generation segment benefits from growing deployment in lubrication and cooling systems.
- For instance, Xylem, a key player in the water treatment sector, provides advanced hydraulic pump solutions for municipal wastewater facilities to handle heavy concentrations of sludge.
Key Growth Drivers
Rising Demand from Water and Wastewater Treatment Plants
Expanding global investments in water and wastewater infrastructure are driving the adoption of positive displacement pumps. These pumps efficiently handle viscous, abrasive, and sludge-like fluids, making them ideal for treatment and recycling applications. Urbanization and stricter environmental regulations have increased demand for reliable pumping systems to manage municipal and industrial wastewater. Governments in developing regions are funding modernization projects to improve water supply and treatment efficiency, which continues to boost pump installations across large-scale facilities and decentralized wastewater systems.
- For instance, Grundfos provides high-efficiency pumping solutions for wastewater treatment that are designed to lower lifecycle costs and enhance efficiency. The company’s pumps are used in various industrial and municipal wastewater applications.
Expanding Use in the Oil, Gas, and Chemical Industries
The oil, gas, and chemical sectors rely heavily on positive displacement pumps for precise metering and transfer of high-viscosity fluids. These pumps ensure stable flow under variable pressures, making them suitable for upstream, midstream, and downstream applications. Increasing energy demand and refinery expansions in Asia-Pacific and the Middle East are creating new opportunities for equipment manufacturers. Additionally, advancements in seal-less and magnetically driven pump designs are improving safety and efficiency in handling hazardous or corrosive fluids.
- For instance, Flowserve, a leading pump manufacturer, offers a range of enhanced magnetic drive pumps used in chemical processing and oil and gas applications, which provide zero-emission performance and significantly reduce the risk of fluid contamination by eliminating traditional mechanical seals.
Growth in Industrial Automation and Energy Efficiency Initiatives
The shift toward smart manufacturing and energy-efficient operations is fueling demand for technologically advanced positive displacement pumps. Integration of variable frequency drives (VFDs), IoT-based monitoring, and predictive maintenance tools helps optimize performance and reduce downtime. Industries are prioritizing low-maintenance, durable pumps to improve overall plant productivity. Global focus on reducing energy consumption and lifecycle costs is driving innovation in pump design, resulting in greater adoption across sectors such as power generation, construction, and food processing.
Key Trends and Opportunities
Integration of Digital Monitoring and Smart Control Systems
Digitalization is transforming pump operations through IoT-enabled monitoring, automation, and data analytics. Smart positive displacement pumps equipped with real-time performance tracking and remote diagnostics enhance operational reliability. Predictive maintenance tools minimize failures and optimize energy usage, reducing maintenance costs. Manufacturers are increasingly collaborating with automation companies to develop connected pump solutions for industrial and municipal use, aligning with Industry 4.0 standards. This trend supports improved process visibility and decision-making for operators across diverse end-use sectors.
- For instance, KSB has integrated IoT technology in its pumps, enabling remote monitoring through its digital service, KSB Guard. This system improves operational efficiency by detecting irregularities and enabling maintenance to be planned based on concrete measurement data, thereby helping to minimize damage and unscheduled downtime.
Increasing Adoption of Eco-Friendly and Energy-Efficient Designs
Sustainability goals are prompting the development of energy-efficient and environmentally friendly pump technologies. Modern designs use advanced materials and precision components to minimize leakage, noise, and energy losses. Growing emphasis on compliance with environmental regulations such as ISO 50001 is encouraging industries to upgrade aging pump systems. Manufacturers are focusing on producing compact, high-efficiency pumps that reduce carbon emissions, supporting both operational and sustainability objectives in industrial and infrastructure projects.
- For instance, Sulzer has developed a line of energy-efficient pumps that utilize high-performance hydraulic designs and modernization services to achieve significant, project-specific energy consumption reductions, sometimes ranging from 3% to 20% or more with new designs.
Key Challenges
High Maintenance and Operational Costs
While positive displacement pumps offer high efficiency, their maintenance and operational costs can be substantial. Frequent wear of seals, valves, and moving parts leads to increased downtime and repair expenses. In sectors handling abrasive or corrosive fluids, maintenance requirements are even higher. The need for specialized technicians and replacement components also adds to total ownership costs. These factors pose challenges for small and medium enterprises seeking cost-effective pumping solutions for continuous operations.
Competition from Centrifugal Pump Technologies
The increasing efficiency and affordability of centrifugal pumps present a competitive challenge to positive displacement pump manufacturers. Centrifugal systems are preferred in applications requiring high flow rates and lower viscosity fluids due to their simpler design and lower maintenance. Continuous improvements in variable-speed drives and energy-efficient impeller technologies have enhanced their performance capabilities. This growing substitution risk, especially in water supply and light industrial sectors, could limit the adoption of positive displacement pumps in certain market segments.
Regional Analysis
North America
North America holds the largest share of the positive displacement pumps market with 33.5% in 2024. The region’s growth is driven by strong demand from oil and gas, wastewater treatment, and food processing industries. The United States leads with large-scale refinery operations and advanced water infrastructure upgrades. Increasing investments in automation and energy-efficient pump systems also strengthen market expansion. The presence of key manufacturers and adoption of smart monitoring technologies further enhance market competitiveness, positioning North America as a key hub for high-performance pump innovation and deployment.
Europe
Europe accounts for 28.7% share of the positive displacement pumps market in 2024, supported by stringent environmental regulations and modernization of water and wastewater networks. The region’s industrial sector is transitioning toward sustainable fluid-handling systems to meet energy efficiency goals. Countries such as Germany, the United Kingdom, and France are leading adoption, driven by advancements in manufacturing and renewable energy projects. Growing demand in chemical processing and construction sectors continues to support steady growth, while government initiatives promoting clean technologies further enhance product innovation across European markets.
Asia-Pacific
Asia-Pacific captures 26.9% share of the global positive displacement pumps market in 2024, emerging as the fastest-growing region. Expansion in manufacturing, construction, and power generation industries drives large-scale deployment. China and India lead with increasing infrastructure investments and wastewater treatment initiatives. Rapid industrialization, urbanization, and strong growth in the food and chemical sectors are boosting demand for efficient and durable pumps. The region’s focus on industrial automation and cost-effective production makes it a key destination for global manufacturers seeking to expand their regional presence.
Latin America
Latin America holds 6.2% share of the positive displacement pumps market in 2024, supported by gradual recovery in industrial and construction activities. Countries such as Brazil and Mexico are driving demand through oil and gas exploration and water management projects. The modernization of municipal water systems and growing investments in mining and chemical processing industries further support regional growth. However, limited capital investment and fluctuating raw material costs pose short-term challenges, though rising infrastructure funding is expected to sustain long-term opportunities across the region.
Middle East and Africa
The Middle East and Africa region accounts for 4.7% share of the positive displacement pumps market in 2024. Growth is led by strong oil and gas operations in Saudi Arabia, the UAE, and Qatar, coupled with expanding water desalination projects. African countries are adopting positive displacement pumps in mining, power generation, and wastewater management. Infrastructure development programs and industrial diversification efforts continue to boost adoption. The increasing focus on energy efficiency and modernization of existing facilities is expected to strengthen market growth in the coming years.
Market Segmentations:
By Type
By End-use
- Construction & Building Services
- Water & Wastewater
- Power Generation
- Others
By Geography
- North America
- Europe
- Germany
- France
- U.K.
- Italy
- Spain
- Rest of Europe
- Asia Pacific
- China
- Japan
- India
- South Korea
- South-east Asia
- Rest of Asia Pacific
- Latin America
- Brazil
- Argentina
- Rest of Latin America
- Middle East & Africa
- GCC Countries
- South Africa
- Rest of the Middle East and Africa
Competitive Landscape
The competitive landscape of the positive displacement pumps market is defined by major players such as Grundfos, Schlumberger Limited, SPX Flow, Sulzer Ltd., Viking Pump, Inc., Weir Group PLC, Alfa Laval, Ingersoll Rand, IDEX Corporation, and KSB Group. These companies focus on innovation, product diversification, and strategic collaborations to strengthen their market presence. Advancements in smart pumping technologies, IoT integration, and energy-efficient designs are key strategies to meet industrial automation and sustainability goals. Manufacturers are also emphasizing customized solutions for applications in water treatment, oil and gas, and chemical processing. Strategic mergers, acquisitions, and capacity expansions help enhance global distribution networks and operational efficiency. Additionally, ongoing investments in digital monitoring systems and predictive maintenance solutions continue to improve reliability and lifecycle performance, reinforcing the market’s shift toward intelligent and sustainable fluid-handling systems across diverse end-use industries.
Shape Your Report to Specific Countries or Regions & Enjoy 30% Off!
Key Player Analysis
- Grundfos
- Schlumberger Limited
- SPX Flow
- Sulzer Ltd.
- Viking Pump, Inc.
- Weir Group PLC
- Alfa Laval
- Ingersoll Rand
- IDEX Corporation
- KSB Group
Recent Developments
- In February 2025, SPX Flow, Inc. announced its APV DW+ positive displacement pump, the next generation of its DW series designed for processing high‑value, high‑viscosity products across food & beverage, personal care and industrial applications.
- In December 2024, IDEX Corporation (via its China business) introduced the PulsaMax® 8480 Series – a leak‑free hydraulically‑balanced diaphragm positive displacement metering pump meeting API 675 standards, aimed at refinery, oil & gas, petrochemical, energy utilities, pharmaceuticals and water treatment applications.
Report Coverage
The research report offers an in-depth analysis based on Type, End-use and Geography. It details leading market players, providing an overview of their business, product offerings, investments, revenue streams, and key applications. Additionally, the report includes insights into the competitive environment, SWOT analysis, current market trends, as well as the primary drivers and constraints. Furthermore, it discusses various factors that have driven market expansion in recent years. The report also explores market dynamics, regulatory scenarios, and technological advancements that are shaping the industry. It assesses the impact of external factors and global economic changes on market growth. Lastly, it provides strategic recommendations for new entrants and established companies to navigate the complexities of the market.
Future Outlook
- Adoption of IoT-enabled smart monitoring systems will enhance pump efficiency and reliability.
- Demand for energy-efficient and low-maintenance pump designs will continue to grow across industries.
- Expansion in water and wastewater treatment infrastructure will drive steady market growth.
- Increasing automation in oil and gas and chemical sectors will boost product deployment.
- Manufacturers will focus on developing eco-friendly and sustainable pumping technologies.
- Digital integration and predictive maintenance tools will improve operational performance.
- Emerging economies will witness rising investments in industrial and municipal pumping systems.
- Technological upgrades will enable precise flow control and reduced energy consumption.
- Strategic mergers and partnerships will strengthen global supply chains and service networks.
- Growing focus on renewable energy and process optimization will create new opportunities for advanced positive displacement pumps.


