
2D Material Transistor Market Overview:
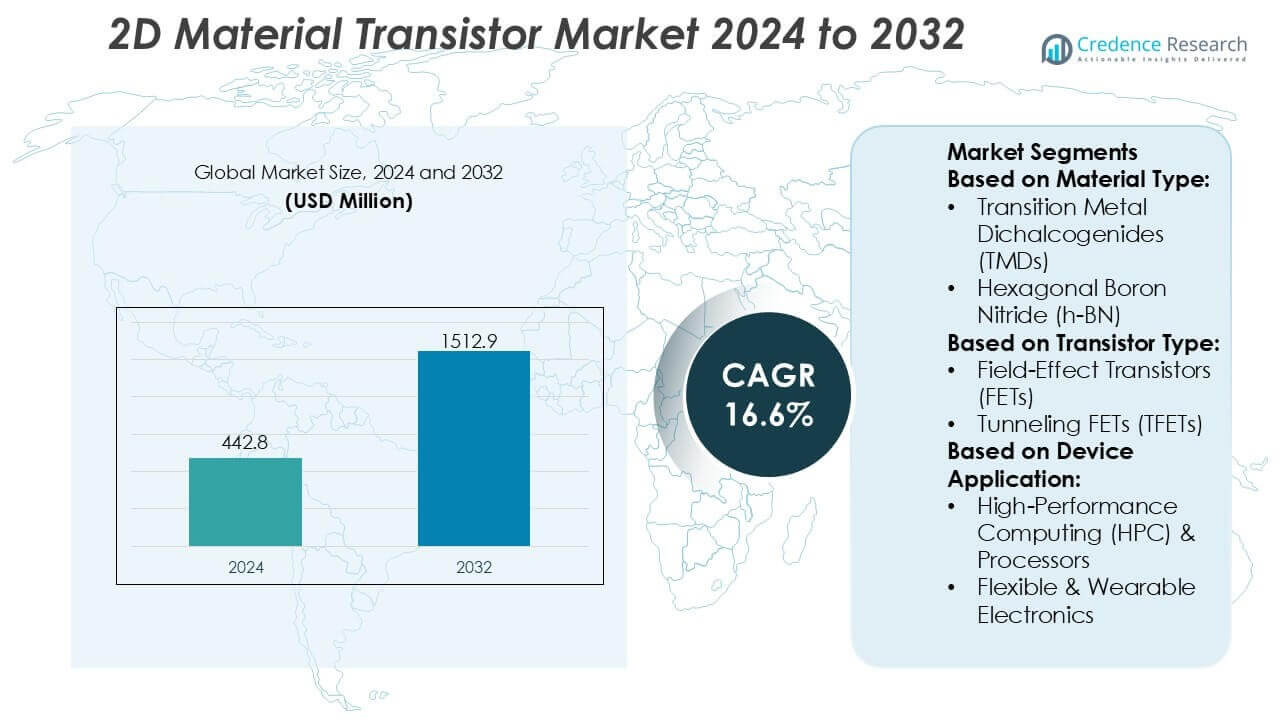
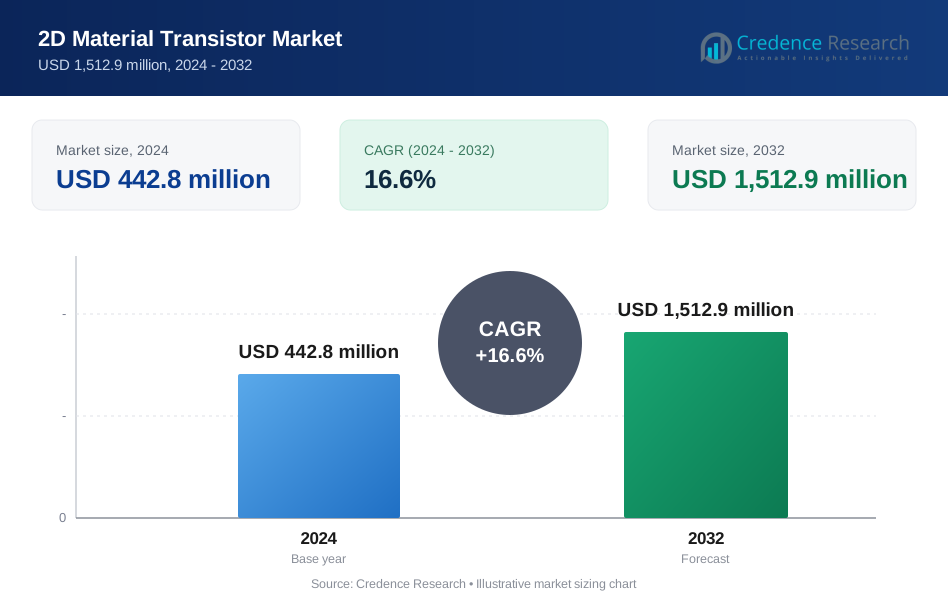
2D Material Transistor Market size was valued USD 442.8 million in 2024 and is anticipated to reach USD 1512.9 million by 2032, at a CAGR of 16.6% during the forecast period.
| REPORT ATTRIBUTE | DETAILS |
|---|---|
| Historical Period | 2020-2023 |
| Base Year | 2024 |
| Forecast Period | 2025-2032 |
| 2D Material Transistor Market Size 2024 | USD 442.8 million |
| 2D Material Transistor Market , CAGR | 16.6% |
| 2D Material Transistor Market Size 2032 | USD 1512.9 million |
2D Material Transistor Market Insights
- Market growth is primarily driven by the need to overcome silicon scaling limitations, with graphene and transition metal dichalcogenides gaining traction for high-speed, low-power logic, memory, and advanced computing applications.
- Key market trends include increasing wafer-scale CVD synthesis, improved interface engineering, and growing alignment of 2D materials with CMOS-compatible manufacturing processes to enable commercial viability.
- The competitive landscape is moderately consolidated, with leading players focusing on material purity, process scalability, strategic R&D collaborations, and intellectual property development to secure long-term positioning.
- Regionally, Asia-Pacific dominates with an exact 42% market share, supported by strong semiconductor fabrication ecosystems, while graphene-based transistors represent the leading material segment due to superior electrical conductivity and maturity in pilot-scale production.
2D Material Transistor Market Segmentation Analysis:
By Material Type
By material type, graphene represents the dominant sub-segment in the 2D material transistor market, holding an estimated 38% market share, driven by its exceptional carrier mobility, high electrical conductivity, and atomic-scale thickness. Graphene’s ability to support ultra-fast electron transport makes it highly suitable for high-frequency and low-power transistor applications. Transition metal dichalcogenides (TMDs), such as MoS₂ and WS₂, follow closely due to their intrinsic bandgaps, which enable better switching performance than graphene. Hexagonal boron nitride (h-BN) is primarily adopted as an insulating and substrate layer, while emerging materials like black phosphorus and MXenes address niche high-sensitivity and anisotropic electronic applications.
- For instance, Versarien plc has reported production of few-layer graphene with sheet resistance below 300 Ω/sq at optical transparency levels above 97%, supporting transistor channels that sustain electron mobility exceeding 10,000 cm²/V·s under laboratory conditions.
By Transistor Type
By transistor type, field-effect transistors (FETs) dominate the market with approximately 42% market share, supported by their compatibility with existing semiconductor architectures and their effectiveness in leveraging the thin-body electrostatics of 2D materials. 2D FETs enable reduced short-channel effects, lower leakage currents, and improved gate control, making them suitable for advanced logic scaling. Tunneling FETs (TFETs) are gaining attention for ultra-low-power electronics due to their steep subthreshold slopes, while FinFETs and multi-gate or nanowire FETs are increasingly explored for enhanced current density and electrostatic control in next-generation nanoscale device designs.
- For instance, ACS Material, LLC supplies monolayer and few-layer graphene and MoS₂ used in research-scale FET fabrication, where devices have demonstrated channel lengths down to 20 nm, gate leakage currents below 10⁻¹² A, and electron mobility values exceeding 3,000 cm²/V·s in graphene-based FET structures.
By Device Application
By device application, high-performance computing (HPC) and processors form the leading sub-segment, accounting for nearly 34% market share, driven by demand for faster switching speeds, reduced power consumption, and continued transistor scaling beyond silicon limits. 2D material transistors support high current density and thermal management requirements essential for advanced processors. Flexible and wearable electronics represent a rapidly expanding segment due to the mechanical flexibility of 2D materials, while sensors, MEMS, optoelectronic devices, and IoT edge electronics benefit from their high sensitivity, low operating voltage, and suitability for miniaturized, energy-efficient system integration.
Key Growth Drivers
Scaling Limits of Conventional Silicon Transistors
The 2D material transistor market benefits strongly from the physical and performance limitations of traditional silicon-based transistors at advanced technology nodes. As channel lengths approach sub-5 nm dimensions, silicon devices suffer from short-channel effects, leakage current, and reduced electrostatic control. Atomically thin 2D materials offer superior gate control, reduced power dissipation, and enhanced carrier mobility, making them viable alternatives for continued device scaling. This capability positions 2D material transistors as critical enablers for next-generation logic, memory, and low-power semiconductor architectures.
- For instance, Sixth Element Materials Technology Co., Ltd. has achieved large-area chemical vapor deposition (CVD) graphene films with lateral wafer sizes exceeding 300 mm, single-layer thickness of approximately 0.34 nm, and room-temperature carrier mobility above 8,000 cm²/V·s, supporting transistor channels with effective electrostatic control at nanometer scales.
Rising Demand for High-Performance and Low-Power Electronics
Increasing demand for high-performance computing, artificial intelligence accelerators, and edge electronics drives adoption of advanced transistor technologies. 2D material transistors support higher switching speeds and lower operating voltages, enabling improved performance-per-watt compared with conventional devices. These advantages are particularly relevant for data centers, mobile processors, and battery-powered systems where energy efficiency is a key design constraint. As system designers prioritize thermal efficiency and power optimization, 2D material-based transistors gain relevance across performance-critical semiconductor applications.
- For instance, Nantero, Inc. has demonstrated carbon-nanotube-based NRAM devices with write and read speeds below 1 ns, operating voltages as low as 1.0 V, and endurance exceeding 10¹² write cycles, while maintaining data retention validated for 10 years at elevated temperatures.
Growth of Flexible and Emerging Electronics Platforms
The expansion of flexible, wearable, and transparent electronics significantly accelerates the adoption of 2D material transistors. Their mechanical flexibility, chemical stability, and ultra-thin form factor allow integration onto plastic and unconventional substrates. This enables new device architectures for foldable displays, biomedical sensors, and next-generation human–machine interfaces. As consumer electronics manufacturers explore form-factor innovation beyond rigid silicon wafers, 2D material transistors provide a scalable path for high-performance electronics in mechanically flexible and lightweight designs.
Key Trends & Opportunities
Advancements in Wafer-Scale Synthesis and Integration
Rapid progress in wafer-scale growth, transfer, and integration techniques represents a major opportunity for the 2D material transistor market. Improvements in chemical vapor deposition, material uniformity, and defect control are reducing barriers to large-area device fabrication. These advancements enhance compatibility with existing semiconductor manufacturing workflows, accelerating the transition from laboratory prototypes to commercial production. As yield and repeatability improve, semiconductor foundries gain confidence in adopting 2D materials for advanced transistor architectures.
- For instance, Graphenea S.A. has achieved monolayer graphene growth on copper substrates with continuous film coverage on wafers up to 300 mm in diameter, a controlled thickness of 0.34 nm, and room-temperature carrier mobility exceeding 6,000 cm²/V·s after transfer.
Expansion into IoT and Edge Computing Applications
The proliferation of IoT devices and edge computing platforms creates new growth avenues for 2D material transistors. These applications prioritize ultra-low power consumption, compact size, and reliable operation under variable conditions. 2D transistors support these requirements through excellent electrostatic control and reduced leakage currents. Their suitability for sensor interfaces, edge processors, and always-on electronics positions them as attractive components in distributed computing ecosystems, where energy efficiency and integration density are critical.
- For instance, NanoXplore Inc. produces xGnP® graphene nanoplatelets with an average thickness of approximately 15 nm and average particle diameters of 5 µm, 15 µm, or 25 µm, and typical surface area ranging from 50–80 m²/g, enabling integration into compact electronic composite structures with enhanced electrical pathways and thermal stability.
Increasing Research Collaboration Between Academia and Industry
Strong collaboration between research institutions, semiconductor companies, and materials suppliers is accelerating innovation in 2D material transistors. Joint development programs focus on device modeling, reliability testing, and process standardization. These partnerships shorten development cycles and improve technology readiness levels. As knowledge transfer from academic research to industrial manufacturing strengthens, commercialization opportunities expand across logic, memory, and specialty semiconductor segments.
Key Challenges
Manufacturing Scalability and Yield Constraints
Despite strong performance advantages, large-scale manufacturing of 2D material transistors remains challenging. Variability in material quality, defect density, and interface stability affects device yield and reproducibility. Transferring atomically thin layers without contamination or damage adds further complexity. These issues increase production costs and slow adoption in high-volume semiconductor manufacturing. Addressing scalability and yield challenges is essential for achieving commercial competitiveness with mature silicon-based transistor technologies.
Reliability, Standardization, and Long-Term Stability Issues
Ensuring long-term device reliability presents a critical challenge for the 2D material transistor market. Factors such as environmental sensitivity, contact resistance, and material degradation under electrical stress can impact performance stability. Additionally, the absence of standardized fabrication processes and testing protocols complicates qualification for commercial applications. Overcoming these reliability and standardization barriers is necessary to build industry confidence and enable widespread deployment of 2D material-based transistor technologies.
Regional Analysis
North America
North America leads the 2D material transistor market with an estimated 38% market share, supported by strong semiconductor R&D ecosystems and early commercialization of advanced transistor architectures. The United States anchors regional demand through heavy investment in graphene and transition metal dichalcogenide (TMD) research across national laboratories, universities, and leading semiconductor firms. Robust funding for AI accelerators, high-performance computing, and defense electronics accelerates pilot-scale manufacturing and prototype integration. In addition, strong venture capital activity and close collaboration between fabless design firms and research foundries reinforce North America’s leadership in translating laboratory breakthroughs into scalable device platforms.
Europe
Europe accounts for approximately 26% of the global 2D material transistor market, driven by a strong research-to-industry pipeline and coordinated public funding initiatives. Countries such as Germany, France, and the Netherlands emphasize nanoelectronics, low-power logic, and beyond-CMOS architectures aligned with sustainability and energy-efficiency goals. The region benefits from advanced research institutes and pilot fabrication lines that support process standardization and material characterization. European semiconductor strategies focused on technological sovereignty further stimulate demand for 2D materials in logic, sensing, and optoelectronics, particularly for automotive electronics and industrial automation applications.
Asia-Pacific
Asia-Pacific holds around 29% market share and represents the fastest-growing regional market for 2D material transistors. Growth is fueled by strong semiconductor manufacturing capabilities in China, South Korea, Taiwan, and Japan, coupled with rising investment in next-generation logic nodes. Regional players активно integrate 2D materials into flexible electronics, displays, and IoT devices, leveraging cost-efficient fabrication and large-scale production infrastructure. Government-backed programs supporting advanced materials and chip self-reliance further accelerate adoption. The region’s strength in volume manufacturing positions Asia-Pacific as a key hub for future commercialization.
Latin America
Latin America represents nearly 4% of the 2D material transistor market, with growth driven primarily by academic research and early-stage industrial adoption. Countries such as Brazil and Mexico focus on applied research in nanoelectronics, sensors, and flexible devices, often in collaboration with international institutions. While large-scale fabrication remains limited, increasing investment in electronics manufacturing, smart infrastructure, and digital transformation supports gradual market expansion. Regional universities and research centers play a critical role in material synthesis and device prototyping, laying the foundation for future integration into local semiconductor and electronics value chains.
Middle East & Africa
The Middle East & Africa region holds approximately 3% market share in the 2D material transistor market, reflecting its early-stage adoption profile. Growth is supported by rising investment in advanced research hubs, particularly in the Gulf countries, focusing on nanoelectronics, sensing technologies, and energy-efficient devices. Strategic initiatives aimed at diversifying economies beyond hydrocarbons encourage funding for advanced materials and semiconductor research. Although commercial fabrication is limited, increasing collaboration with global research institutions and technology providers positions the region for steady long-term participation in emerging 2D transistor applications.
2D Material Transistor Market Segmentations:
By Material Type:
- Transition Metal Dichalcogenides (TMDs)
- Hexagonal Boron Nitride (h-BN)
By Transistor Type:
- Field-Effect Transistors (FETs)
- Tunneling FETs (TFETs)
By Device Application:
- High-Performance Computing (HPC) & Processors
- Flexible & Wearable Electronics
By Geography
- North America
- U.S.
- Canada
- Mexico
- Europe
- Germany
- France
- U.K.
- Italy
- Spain
- Rest of Europe
- Asia Pacific
- China
- Japan
- India
- South Korea
- South-east Asia
- Rest of Asia Pacific
- Latin America
- Brazil
- Argentina
- Rest of Latin America
- Middle East & Africa
- GCC Countries
- South Africa
- Rest of the Middle East and Africa
Competitive Landscape
The competitive landscape of the 2D material transistor market players such as Versarien plc; ACS Material, LLC; Sixth Element Materials Technology Co., Ltd.; Nantero, Inc.; Graphenea S.A.; XG Sciences, Inc.; Thomas Swan & Co. Ltd.; 2D Semiconductors Inc.; NanoXplore Inc.; 2D Layer Materials Pte. Ltd. the 2D Material Transistor Market is defined by intensive innovation across material synthesis, device engineering, and process integration, as participants compete to bridge the gap between laboratory performance and commercial semiconductor manufacturing.
Companies focus on delivering high-purity, defect-controlled graphene, TMDs, and related 2D materials while advancing wafer-scale growth, uniformity control, and repeatable transfer techniques. Strategic partnerships with academic institutions, foundries, and electronics manufacturers accelerate device validation and shorten development cycles. Market participants increasingly emphasize vertical integration, combining material supply with transistor design, prototyping, and reliability testing to address performance, yield, and scalability challenges. Intellectual property development around deposition methods, interface engineering, and low-temperature processing remains a critical differentiator.
Overall, competition centers on enabling stable, high-performance 2D transistors that can integrate into existing CMOS workflows, supporting future applications in advanced logic, memory, flexible electronics, and next-generation computing platforms.
Key Player Analysis
- Versarien plc
- ACS Material, LLC
- Sixth Element Materials Technology Co., Ltd.
- Nantero, Inc.
- Graphenea S.A.
- XG Sciences, Inc.
- Thomas Swan & Co. Ltd.
- 2D Semiconductors Inc.
- NanoXplore Inc.
- 2D Layer Materials Pte. Ltd.
Recent Developments
- In June 2025, Pennsylvania State University scientists constructed the first CMOS-based computer made completely of two-dimensional materials, and not silicon. This breakthrough demonstrated the promise of nanoscale materials to overcome traditional semiconductors, a key advance toward smaller, faster, and more energy-efficient electronic devices in the technological applications of the future.
- In January 2025, Adisyn acquired 2D Generation, an Israel-based semiconductor IP company, with the deal being finalized on January 9. The acquisition gave Adisyn rights to the patented graphene coating technology used by 2D Generation to develop advanced chip development that consumes less energy.
- In January 2025, University at Buffalo (UB) researchers announced they developed a method to combine thin, 2D materials like molybdenum disulfide (MoS2) with silicon, creating more efficient, energy-saving nanoelectronics by improving how electrical charges are injected and move, paving the way for next-gen semiconductors.
Report Coverage
The research report offers an in-depth analysis based on Material Type, Transistor Type, Device Application and Geography. It details leading market players, providing an overview of their business, product offerings, investments, revenue streams, and key applications. Additionally, the report includes insights into the competitive environment, SWOT analysis, current market trends, as well as the primary drivers and constraints. Furthermore, it discusses various factors that have driven market expansion in recent years. The report also explores market dynamics, regulatory scenarios, and technological advancements that are shaping the industry. It assesses the impact of external factors and global economic changes on market growth. Lastly, it provides strategic recommendations for new entrants and established companies to navigate the complexities of the market.
Future Outlook
- Adoption of 2D material transistors will accelerate as semiconductor nodes approach physical scaling limits of silicon-based devices.
- Integration of graphene and TMD-based transistors into advanced logic and memory architectures will progress through pilot-scale fabrication.
- Wafer-scale synthesis and transfer-free growth techniques will improve yield consistency and manufacturing reliability.
- Foundry–industry collaborations will expand to enable compatibility of 2D materials with established CMOS process flows.
- Demand will increase from high-performance computing and AI accelerators requiring lower power consumption and higher switching speeds.
- Flexible and wearable electronics will drive commercialization of ultra-thin, mechanically robust 2D transistor designs.
- Advancements in contact engineering and interface optimization will enhance carrier mobility and device stability.
- Standardization of material quality metrics and testing protocols will support broader industrial adoption.
- Investments in pilot fabs and specialized equipment will strengthen supply-chain readiness for volume production.
- Long-term growth will be supported by emerging applications in neuromorphic computing, sensors, and quantum-enabled electronics.
Request a Free Sample
Fill in your details and we'll send you a free sample report.
- Sample data tables & charts
- Research methodology
Need a Custom Version of This Report?
Tailor the scope, geography, or segments to your exact requirements.
- Custom geography or segment scope
- Direct access to our analyst team
Frequently Asked Questions
What is the current market size for the 2D Material Transistor Market, and what is its projected size in 2032?
At what Compound Annual Growth Rate is the 2D Material Transistor Market projected to grow between 2024 and 2032?
Which 2D Material Transistor Market segment held the largest share in 2024?
What are the primary factors fueling the growth of the 2D Material Transistor Market?
Who are the leading companies in the 2D Material Transistor Market?
Which region commanded the largest share of the 2D Material Transistor Market in 2024?
Table of Content
Chapter 1. Report Introduction
- 1.1 Report Description & Purpose
- 1.1.1 Report Title & Market Definition
- 1.1.2 Unique Selling Propositions (USP) & Key Differentiators
- 1.1.3 Value Proposition for Stakeholders
- 1.2 Research Objectives
- 1.2.1 Market Sizing Objectives (Volume & Revenue) (Volume Where Applicable)
- 1.2.2 Segmentation Objectives
- 1.2.3 Competitive Intelligence Objectives
- 1.2.4 Forecast & Scenario Objectives
- 1.3 Report Scope
- 1.3.1 2D Material Transistor Scope – Segments & Subsegments Covered
- 1.3.2 Geographic Scope – Regions & Countries Covered
- 1.3.3 Historical Period, Base Year & Forecast Period (2024; forecast to 2032)
- 1.3.4 Inclusions & Exclusions
- 1.4 Industry Classification & Applicable Codes
- 1.5 Currency, Measurement Units & Valuation Basis
- 1.6 Target Stakeholders
- 1.7 Limitations & Assumptions
Chapter 2. Executive Summary
- 2.1 Global 2D Material Transistor Market Snapshot
- 2.1.1 Market Size – Historical (2024) & Forecast (2024-2032) (2024: USD 442.8 million → 2032: USD 1,512.9 million)
- 2.1.2 Volume & Revenue – Global Totals (Volume Where Applicable)
- 2.1.3 Key Market Highlights – Top Five Facts
- 2.2 2D Material Transistor Market Segmentation Snapshot
- 2.2.1 Market Split by Region – 2024 vs. 2032
- 2.3 Competitive Snapshot
- 2.3.1 Top 10 Players by Revenue Share – 2024
- 2.3.2 Top 10 Players by Volume Share – 2024 (Volume Where Applicable)
- 2.3.3 Recent Strategic Developments (18-Month Summary)
- 2.4 Key Investment Highlights & Strategic Conclusions
Chapter 3. 2D Material Transistor Market Dynamics & Industry Analysis
- 3.1 Market Overview & Context
- 3.1.1 2D Material Transistor Market Position in the Broader Industry Value Chain
- 3.1.2 Demand Structure & Purchasing Dynamics
- 3.1.3 Market Maturity & Development Stage by Region
- 3.2 2D Material Transistor Market Drivers
- 3.3 2D Material Transistor Market Restraints & Challenges
- 3.4 2D Material Transistor Market Opportunities
- 3.5 Porter's Five Forces Analysis
- 3.5.1 Threat of New Entrants
- 3.5.2 Bargaining Power of Suppliers
- 3.5.3 Bargaining Power of Buyers
- 3.5.4 Threat of Substitutes
- 3.5.5 Competitive Rivalry – Intensity Assessment
- 3.6 2D Material Transistor Value Chain Analysis
- 3.6.1 Upstream – Key Inputs, Resources & Suppliers
- 3.6.1.1 Key Input/Resource 1
- 3.6.1.2 Key Input/Resource 2
- 3.6.1.3 Key Input/Resource 3
- 3.6.2 Midstream – Core Operations & Value Creation
- 3.6.2.1 Operating Model & Process Overview
- 3.6.2.2 Key Operating Locations & Capabilities by Company
- 3.6.3 Downstream – Market Channels & End Users
- 3.6.3.1 Direct Sales & Customer Engagement Channels
- 3.6.3.2 Indirect Sales, Intermediaries & Partner Channels
- 3.6.4 Value Chain Profitability Analysis
- 3.6.1 Upstream – Key Inputs, Resources & Suppliers
- 3.7 PESTEL Analysis
- 3.7.1 Political Factors
- 3.7.2 Economic Factors
- 3.7.3 Social Factors
- 3.7.4 Technological Factors
- 3.7.5 Environmental Factors
- 3.7.6 Legal Factors
- 3.8 2D Material Transistor Supply Chain Analysis
- 3.8.1 Critical Input & Resource Availability Risk Assessment
- 3.8.2 Supplier & Operational Concentration Risk (Geographic Exposure)
- 3.8.3 Supply & Service Disruption Impact Analysis
- 3.9 Regulatory & Policy Landscape
Note: The regulatory and policy landscape section covers regulations based on their applicability to the market, 2D Material Transistor category, geography, and scope of the study. Only regulatory frameworks with a material impact on operations, compliance, trade, sustainability, or market access are analyzed in detail.
Chapter 4. Key Investment Pockets & Opportunity Analysis
- 4.1 2D Material Transistor Market Attractiveness Analysis
- 4.1.1 By Region – Investment Attractiveness Matrix (Market Size × CAGR)
- 4.2 Absolute Revenue Growth Opportunity
- 4.2.1 By Region – Absolute Revenue Growth Through 2032
- 4.3 Incremental Demand Opportunity
- 4.3.1 By Region – Incremental Demand Through 2032
- 4.3.2 Segment – Incremental Demand
- 4.4 Emerging Submarket Opportunity Deep Dive (Subject to Applicability)
- 4.5 Priority Market Opportunity Scorecards
- 4.5.1 United States
- 4.5.2 Europe
- 4.5.3 Asia
- 4.5.4 Middle East & Africa
Note: Priority market opportunity scorecards reflect the geographic scope and strategic relevance of the study. Listed markets are indicative and may be adapted to the industry.
Chapter 5. 2D Material Transistor Cross-Border Trade & Market Access Analysis
- 5.1 International Trade & Cross-Border Activity Overview
- 5.1.1 Global Export Value by Country (2024)
- 5.1.2 Global Export Volume by Country (2024) (Volume Where Applicable)
- 5.1.3 Global Import Value by Country (2024)
- 5.1.4 Global Import Volume by Country (2024) (Volume Where Applicable)
- 5.1.5 Net Trade Balance by Country (2024)
- 5.2 Export Analysis – Segment
- 5.2.1 Category 1 (Applicable Classification Code)
- 5.2.2 Category 2 (Applicable Classification Code)
- 5.2.3 Category 3 (Applicable Classification Code)
- 5.2.4 Category 4 (Applicable Classification Code)
- 5.2.5 Category 5 (Applicable Classification Code)
- 5.3 Import Analysis – Segment
- 5.3.1 Category 1 (Applicable Classification Code)
- 5.3.2 Category 2 (Applicable Classification Code)
- 5.3.3 Category 3 (Applicable Classification Code)
- 5.3.4 Category 4 (Applicable Classification Code)
- 5.3.5 Category 5 (Applicable Classification Code)
- 5.4 Cross-Border Pricing & Transaction Benchmarks
- 5.4.1 Export Pricing – Segment & Country
- 5.4.2 Import Pricing – Segment & Source Country
- 5.4.3 Price Trends (2024)
- 5.5 Key Cross-Border Trade & Delivery Routes
- 5.5.1 Cross-Border Trade/Delivery Route 1
- 5.5.2 Cross-Border Trade/Delivery Route 2
- 5.5.3 Cross-Border Trade/Delivery Route 3
- 5.5.4 Cross-Border Trade/Delivery Route 4
- 5.5.5 Cross-Border Trade/Delivery Route 5
- 5.6 Trade Policy & Market Access Impact Assessment
- 5.6.1 Tariff & Non-Tariff Barriers
- 5.6.2 Regional Trade & Economic Integration Frameworks
- 5.6.3 Bilateral & Multilateral Trade Agreements
- 5.6.4 Cross-Border Operating, Licensing & Localization Requirements
Note: This chapter applies where cross-border trade or delivery is relevant to 2D Material Transistor. Goods, services, and digital offerings are assessed using applicable classifications and transaction measures. Import-export volumes, trade balances, and route analyses are included only where meaningful to the market.
Chapter 6. Competitive Landscape & Company Benchmarking
- 6.1 2D Material Transistor Market Concentration & Structure
- 6.1.1 Herfindahl-Hirschman Index (HHI) – vs. 2024
- 6.1.2 Leading, Mid-Sized & Emerging Player Structure
- 6.1.3 Global, Regional & Local Player Dynamics
- 6.2 2D Material Transistor Market Share Analysis – 2024
- 6.2.1 Global Revenue Share by Company
- 6.2.2 Global Volume Share by Company (Volume Where Applicable)
- 6.2.3 Regional Revenue Share
- 6.2.4 Market Share Evolution ( vs. 2024)
- 6.2.5 Company Market Share by Key Segment
- 6.2.6 Company Market Share by Customer Group
- 6.3 Operating Scale, Capacity & Infrastructure Analysis
- 6.3.1 Global Operating Scale & Supply Capacity
- 6.3.2 Resource Utilization & Operating Efficiency
- 6.3.3 Output, Service Delivery & Activity Metrics
- 6.3.4 Operating Footprint & Infrastructure Map
- 6.3.5 Planned Operational & Capacity Expansion
- 6.4 2D Material Transistor Competitive Benchmarking Matrix
- 6.4.1 Revenue, Growth, Profitability & Operating Metric Comparison
- 6.4.2 Channel Revenue Mix
- 6.4.3 Geographic Revenue Exposure
- 6.4.4 R&D Intensity
- 6.4.5 Sustainability Maturity
- 6.5 Strategic Developments in 2D Material Transistor (Last 24 Months)
- 6.5.1 Mergers, Acquisitions & Divestments
- 6.5.2 New Products, Services & Solutions in 2D Material Transistor
- 6.5.3 Operational & Infrastructure Expansions
- 6.5.4 Strategic Alliances, Joint Ventures & Partnerships
- 6.5.5 Distribution Expansion & Market Entry
- 6.5.6 Sustainability & ESG Initiatives
- 6.6 Competitive Strategy Mapping
- 6.6.1 Leader, Challenger, Follower & Niche Classification
- 6.6.2 Pricing Strategy Comparison
- 6.6.3 Channel Strategy Matrix
Note: Strategic developments are included based on their materiality and the availability of reliable information.
Chapter 7. Global 2D Material Transistor Market – By Sales & Delivery Channel
- 7.1 Segment Overview
- 7.1.1 Volume & Revenue Split by Channel (2024 & 2032) (Volume Where Applicable)
- 7.1.2 Channel Mix Evolution (2024-2032)
Chapter 8. Regional Market Analysis – Global Overview
- 8.1 Global Regional Overview
- 8.1.1 Regional Volume Share (Volume Where Applicable)
- 8.1.2 Regional Revenue Share
- 8.1.3 Regional Volume by Region (Volume Where Applicable)
- 8.1.4 Regional Revenue by Region
- 8.1.5 Regional Forecast Through 2032
- 8.2 Cross-Regional Segment Analysis
- 8.2.1 By Sales & Delivery Channel
- 8.2.2 By Competitive Positioning & Price Tier
Chapter 9. North America 2D Material Transistor Market
- 9.1 United States
- 9.2 Canada
- 9.3 Mexico
Chapter 10. Europe 2D Material Transistor Market
- 10.1 Germany
- 10.2 France
- 10.3 Italy
- 10.4 United Kingdom
- 10.5 Spain
- 10.6 Poland
- 10.7 Russia
- 10.8 Netherlands
- 10.9 Belgium
- 10.10 Sweden
- 10.11 Denmark
- 10.12 Norway
- 10.13 Rest of Europe
Chapter 11. Asia Pacific 2D Material Transistor Market
- 11.1 China
- 11.2 India
- 11.3 Japan
- 11.4 South Korea
- 11.5 Thailand
- 11.6 Indonesia
- 11.7 Vietnam
- 11.8 Malaysia
- 11.9 Australia
- 11.10 Rest of Asia Pacific
Chapter 12. Latin America 2D Material Transistor Market
- 12.1 Brazil
- 12.2 Argentina
- 12.3 Colombia
- 12.4 Chile
- 12.5 Rest of Latin America
Chapter 13. Middle East 2D Material Transistor Market
- 13.1 Saudi Arabia
- 13.2 United Arab Emirates
- 13.3 Turkey
- 13.4 Israel
- 13.5 Iran
- 13.6 Rest of the Middle East
Chapter 14. Africa 2D Material Transistor Market
- 14.1 South Africa
- 14.2 Egypt
- 14.3 Nigeria
- 14.4 Morocco
- 14.5 Rest of Africa
Chapter 15. 2D Material Transistor Company Profiles
- 15.1 [Company 01]
- 15.1.1 Company Overview
- 15.1.2 Key Management Personnel
- 15.1.3 Products & Services Portfolio
- 15.1.4 Financial Performance
- 15.1.5 Key Market Focus & Geographic Presence
- 15.1.6 Recent Developments & Strategic Initiatives
Note: The company profile list is preliminary and may change based on research findings, market developments, data availability, and client requirements.
Chapter 16. Appendices
- Appendix A – List of Abbreviations & Acronyms
- Appendix B – Industry Classification Code Reference – Full Series
- Appendix C – Supply, Output & Operating Capacity Data Tables
- Appendix D – End-Use & Demand Base Tables
- Appendix E – Demand, Adoption & Usage Assumptions
- Appendix F – Pricing & Revenue Metric Reference Tables
- Appendix G – Company Operations & Infrastructure Database
- Appendix H – Cross-Border Trade & Activity Data Tables (Where Applicable)
- Appendix I – Regulatory Summary Tables
- Appendix J – Primary Research Participant List (Anonymized)
- Appendix K – Primary Research Questionnaire Framework
- Appendix L – Data Sources & Bibliography
- Appendix M – Market Size Divergence & Source Comparison
Chapter 17. Research Methodology
- 17.1 Research Framework & Philosophy
- 17.2 Secondary Research – Sources, Hierarchy & Data Extraction
- 17.3 Data Modeling – Bottom-Up & Top-Down Market Sizing
- 17.4 Primary Research – Stakeholder Framework, LOI & Sample Sizes
- 17.5 Forecast Methodology – Regression, Scenario & Sensitivity Analysis
- 17.6 Quality Control – Four-Layer Validation Framework
- 17.7 Limitations & Standard Assumptions
- 17.8 Disclaimer
