Market Overview
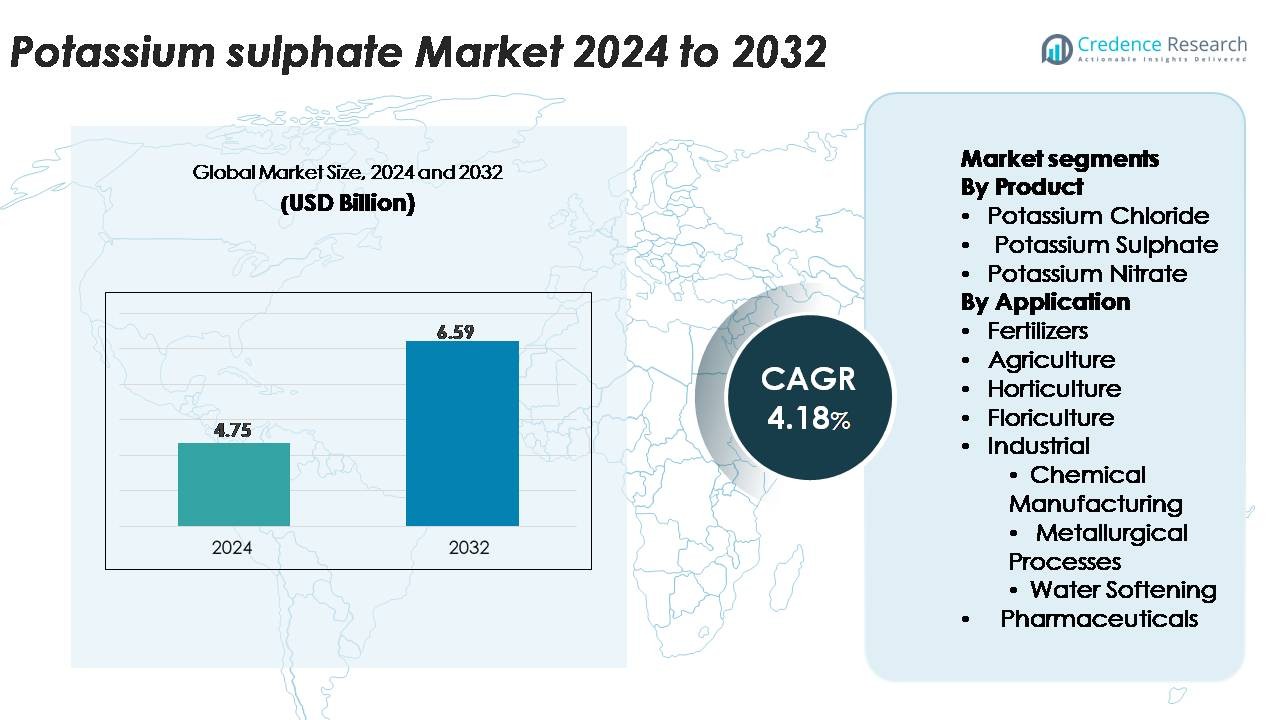
The global Potassium Sulphate market was valued at USD 4.75 billion in 2024 and is projected to reach USD 6.59 billion by 2032, expanding at a CAGR of 4.18% during the forecast period.
| REPORT ATTRIBUTE |
DETAILS |
| Historical Period |
2020-2023 |
| Base Year |
2024 |
| Forecast Period |
2025-2032 |
| Potassium Sulphate market Size 2024 |
USD 4.75 Billion |
| Potassium Sulphate market, CAGR |
4.18% |
| Potassium Sulphate market Size 2032 |
USD 6.59 Billion |
The potassium sulphate market is shaped by established global players such as Uralkali, BHP, Mosaic Company, Rio Tinto Ltd., Compass Minerals Intl. Ltd., and JSC Belaruskali, each leveraging large-scale production capabilities and strong distribution networks to serve high-value agriculture and specialty crop markets. These companies focus on high-purity grades, water-soluble formulations, and reliable supply chains to support fertigation and chloride-sensitive crop segments. Asia-Pacific leads the market with a commanding 40% share, driven by intensive horticulture, expanding micro-irrigation systems, and widespread sulphur-deficient soils. Europe follows with 24%, supported by advanced greenhouse farming and strict sustainability standards, while North America holds 18% due to strong demand from specialty crop growers.
Access crucial information at unmatched prices!
Request your sample report today & start making informed decisions powered by Credence Research Inc.!
Download Sample
Market Insights
- The global potassium sulphate market was valued at USD 4.75 billion in 2024 and is projected to reach USD 6.59 billion by 2032, expanding at a 4.18% CAGR, supported by rising demand for chloride-free nutrients in high-value crop cultivation.
- Market growth is driven by increasing adoption of potassium sulphate in horticulture, floriculture, and specialty crop segments, which collectively command a dominant share due to their sensitivity to chloride and need for sulphur-rich nutrition.
- Key trends include rapid expansion of fertigation, greenhouse farming, and demand for high-purity water-soluble grades, along with a shift toward sustainable and low-salinity fertilizers in export-oriented agriculture.
- The competitive landscape is shaped by major players such as Uralkali, BHP, Mosaic Company, Compass Minerals, Rio Tinto, and JSC Belaruskali, with competition centered on production efficiency, purity standards, and distribution strength.
- Asia-Pacific leads with 40% of global share, followed by Europe at 24% and North America at 18%, while specialty crop applications remain the largest segment across all regions.
Market Segmentation Analysis:
By Product
Within the product landscape, Potassium Sulphate holds the largest share due to its chloride-free composition, which makes it indispensable for high-value and chloride-sensitive crops such as fruits, vegetables, and nuts. Its superior compatibility with drip-fertigation systems and balanced nutrient profile strengthens its use among precision-farming producers. Potassium Chloride remains widely adopted for broad-acre applications, while Potassium Nitrate gains traction in specialty horticulture for combined nitrogen–potassium delivery. The product mix increasingly reflects crop diversification trends and the rising adoption of premium fertilization programs in intensive agriculture.
- For instance, ICL Group has developed and commercialized a high-purity potassium sulfate grade produced via solar evaporation of its Dead Sea brine operations, delivering crystal products with a minimum potassium oxide (K₂O) assay of 50.5 percent and water-solubility exceeding 98 percent, which enables uniform dissolution in fertigation systems.
By Application
Fertilizers dominate the application segment, driven by growing demand for nutrient-efficient crop production and the need to enhance yield quality in high-value cultivation. Potassium Sulphate’s advantage in chloride-sensitive crops accelerates its use in horticulture and floriculture, where crop quality, color development, and stress tolerance are critical. Agriculture applications continue to expand through precision-agriculture adoption, while industrial uses such as chemical manufacturing, metallurgical processing, water softening, and pharmaceuticals benefit from the compound’s solubility and purity. However, fertilizer demand remains the primary growth catalyst across global markets.
- For instance, K+S Minerals and Agriculture operates its potassium sulfate production through the Mannheim process, where each reactor unit achieves output capacities of approximately 25,000 tonnes per year; the company’s multi-reactor configuration at its Ludwigshafen site enables continuous manufacturing of high-purity SOP with sulfate content above 17.5 percent and near-zero chloride levels, supporting strict quality requirements in horticulture and industrial processing.
Key Growth Drivers
Rising Demand for High-Value and Chloride-Sensitive Crops
The expansion of high-value crop cultivation continues to strengthen demand for potassium sulphate as growers prioritize fertilizers that enhance quality without introducing chloride stress. Fruits, vegetables, nuts, and specialty plantation crops require balanced potassium and sulphur inputs to sustain color development, sugar accumulation, and stress tolerance. As agricultural systems shift toward export-oriented horticulture and greenhouse farming, growers increasingly adopt potassium sulphate for its superior nutrient-release efficiency and compatibility with modern irrigation platforms. The growth of protected cultivation, relying on fertigation-based nutrient delivery, further accelerates consumption. Regions emphasizing premium-grade produce including grapes, citrus, berries, and floriculture show heightened adoption due to the compound’s ability to maintain consistent yields under intensive production cycles. This structural transition toward quality-driven farming remains one of the strongest demand drivers globally.
- For instance, SQM produces potassium sulphate at its Coya Sur and Nueva Victoria facilities using natural brine resources from the Atacama Desert, achieving SOP purity levels above 98 percent and sulphate content consistently maintained near 18 percent. The company’s solar evaporation ponds cover an area of more than 42 square kilometers (or more than 42,000,000 square meters) of surface area, enabling large-scale supply to high-value crop producers worldwide.
Expansion of Precision Agriculture and Fertigation Systems
Precision farming practices are expanding rapidly as growers adopt data-driven nutrition management to improve yield consistency and resource-use efficiency. Potassium sulphate benefits directly from this trend because it delivers potassium and sulphur in a highly soluble, low-salt form ideal for drip irrigation and fertigation systems. Modern irrigation controllers, soil sensors, and variable-rate application equipment enable accurate dosing, making potassium sulphate a preferred input for managing nutrient-sensitive crops. Fertigation adoption is accelerating in regions with water scarcity, where growers seek fertilizers that dissolve efficiently and minimize soil salinity buildup. High adoption in greenhouse, polyhouse, vertical farming, and hydroponic operations also strengthens demand. As governments and agritech companies promote micro-irrigation, potassium sulphate remains a strategic fit for farmers seeking efficient, high-performance fertilizers compatible with advanced application technologies.
- For instance, Netafim one of the largest global fertigation technology providers operates 19 manufacturing plants worldwide. They offer precision dosing systems such as the Netafim NetaFlex™ 3G, which is capable of delivering up to 6 independent nutrient stock solutions.
Strengthening Global Focus on Soil Health and Sulphur Nutrition
Depleting soil sulphur levels across major agricultural regions are boosting demand for fertilizers that can supply sulphur alongside potassium. Potassium sulphate addresses this dual requirement by providing sulphur in a plant-available sulphate form, improving chlorophyll formation, enzyme activity, and stress resilience. Increasing adoption of high-analysis nitrogen and phosphorus fertilizers many of which contain little to no sulphur has contributed to widespread sulphur deficiency, making potassium sulphate an important corrective input. Regulatory emphasis on nutrient stewardship and balanced fertilization further supports adoption in integrated nutrient-management programs. In high-intensity agriculture, sulphur supplementation helps improve protein synthesis and enhances nutrient-use efficiency, positioning potassium sulphate as a key tool for optimizing crop performance. As research institutions and extension services promote sulphur-aware fertilization strategies, market penetration continues to expand across diverse crop systems.
Key Trends & Opportunities
Growing Shift Toward Specialty Fertilizers and Crop-Specific Formulations
The fertilizer industry is shifting toward specialty nutrients tailored to crop type, soil condition, and production environment. This trend generates significant opportunities for potassium sulphate suppliers to develop optimized formulations for fruit orchards, vegetable clusters, greenhouse crops, and floriculture. Customized blends combining potassium sulphate with micronutrients or water-soluble compounds are gaining traction in intensive horticulture. Increasing demand for chloride-free formulations enables manufacturers to expand water-soluble NPK blends based on potassium sulphate, especially for fertigation and foliar feeding. Market players also leverage advancements in granulation, micronization, and coating technologies to produce high-purity, quick-dissolving grades for precision farming. As growers demand more targeted and sustainable nutrient solutions, potassium sulphate’s versatility supports its integration into next-generation premium fertilizer portfolios, enhancing long-term adoption prospects.
- For instance, Yara International produces specialty, water-soluble NPK formulations under its YaraTera® series, manufactured using high-purity potassium sulphate with solubility of approximately 11.1 grams per 100g water (or 111 grams per liter) at 20 °C. The company’s Porsgrunn complex in Norway operates multiple production lines with a total NPK capacity of around 2.0 million tonnes per year, a portion of which is dedicated to specialty fertilizers.
Rising Adoption of Sustainable and Low-Salinity Fertilizers
Sustainability initiatives across global agriculture are increasing demand for fertilizers with low environmental impact, minimal salt buildup, and improved nutrient efficiency. Potassium sulphate aligns with these priorities due to its low salinity index and chloride-free structure, making it suitable for soils prone to salinization and for water-limited regions. The push for climate-resilient agriculture, combined with stricter soil quality regulations, encourages the transition away from high-chloride fertilizers toward more plant-friendly alternatives. Organic growers, export-oriented farms, and high-tech horticulture operators are adopting potassium sulphate to meet quality and residue-compliance requirements. As environmental certification programs expand and buyers demand higher standards for sustainable production, potassium sulphate emerges as a critical input supporting long-term soil health and eco-friendly nutrient strategies.
- For instance, Compass Minerals produces sulfate of potash at its Ogden, Utah facility using solar evaporation across more than 50,000 acres of crystallizer ponds, achieving purity levels above 98 percent and chloride content typically below 1 percent; the operation harnesses natural solar energy for over 300 days per year, reducing processing-related emissions while supplying low-salinity SOP to sustainable agriculture producers.
Key Challenges
High Production Costs and Raw Material Dependency
Potassium sulphate production involves resource-intensive processes such as Mannheim furnace operations, salt lake extraction, or advanced chemical conversions, all of which carry high energy requirements and raw material dependencies. These cost structures make potassium sulphate significantly more expensive than conventional muriate of potash, limiting adoption among cost-sensitive farmers. Volatility in sulphur, potassium chloride, and energy prices further impacts manufacturing economics, affecting supply stability and pricing. Smaller producers often face barriers in achieving economies of scale, resulting in regional cost disparities. In agricultural markets dominated by bulk fertilizers, the higher price of potassium sulphate remains a persistent hurdle to wider penetration, particularly in developing economies.
Limited Awareness and Slow Transition from Low-Cost Alternatives
Despite its agronomic advantages, many growers especially in developing regions remain unaware of potassium sulphate’s role in chloride-sensitive crops and sulphur-deficient soils. Limited extension services and inadequate technical guidance lead to overuse of lower-cost potassium fertilizers, even when they negatively impact crop quality. Slow dissemination of best practices and constraints in last-mile distribution hinder adoption among smallholder farmers. Additionally, misconceptions about application rates and benefits create reluctance to shift from traditional inputs. Addressing this challenge requires coordinated efforts among fertilizer companies, agritech providers, and agricultural institutions to enhance farmer education, demonstrate performance benefits, and improve accessibility of high-quality potassium sulphate.
Regional Analysis
North America
North America accounts for around 18% of the global potassium sulphate market, supported by the region’s strong adoption of chloride-free fertilizers for high-value crops such as almonds, berries, citrus, and greenhouse vegetables. The United States drives most consumption due to extensive specialty crop acreage and the rapid expansion of micro-irrigation systems in water-stressed states like California. Demand also benefits from increasing sulphur-deficiency mitigation programs and widespread adoption of fertigation in controlled-environment agriculture. Regulatory emphasis on soil health and premium crop quality continues to strengthen potassium sulphate penetration across horticulture and commercial farming segments.
Europe
Europe captures approximately 24% of the global market, driven by its intensive horticulture, organic farming regulations, and high reliance on chloride-sensitive crops such as potatoes, fruits, vineyards, and ornamentals. Countries including Spain, Italy, France, and the Netherlands lead consumption due to advanced greenhouse cultivation and stringent residue-compliance standards. The region’s focus on sustainable fertilization, low-salinity soils, and high-purity water-soluble fertilizers further accelerates potassium sulphate use. Expansion of protected agriculture and the shift toward specialty nutrient blends particularly in Mediterranean horticulture keep the region a strong contributor to overall demand.
Asia-Pacific
Asia-Pacific holds the largest share at around 40%, driven by high agricultural output, expanding horticulture clusters, and strong demand from chloride-sensitive crops such as tea, tobacco, fruits, and vegetables. China and India are the primary consumers due to massive fertilizer application volumes and increasing adoption of sulphur-supplying fertilizers to address widespread soil nutrient depletion. The region’s rapid shift toward fertigation, micro-irrigation, and greenhouse cultivation boosts demand for water-soluble potassium sulphate. Government-led nutrient-efficiency programs and the growth of export-oriented fruit and vegetable sectors further enhance its market dominance.
Latin America
Latin America represents roughly 10% of global demand, anchored by large-scale cultivation of high-value crops including grapes, berries, citrus, avocados, and plantation crops. Countries such as Brazil, Chile, Peru, and Mexico increasingly prefer potassium sulphate for irrigation-based horticulture and export-compliant crop production. Rising adoption of drip irrigation in arid agricultural zones and greater awareness of chloride sensitivity in specialty crops support market growth. The region’s expanding fruit export industry, coupled with ongoing soil-quality improvement initiatives, enhances potassium sulphate uptake across commercial farming operations.
Middle East & Africa
The Middle East & Africa collectively account for nearly 8% of the market, driven by rapid expansion of irrigated horticulture, greenhouse farming, and date palm cultivation in Gulf countries. Water scarcity across the region promotes significant use of drip-fertigation systems, supporting demand for highly soluble, low-salinity fertilizers such as potassium sulphate. Key markets include Saudi Arabia, UAE, Egypt, Morocco, and South Africa, where controlled-environment agriculture is growing rapidly. Increasing investments in modern farming, reliance on imported premium crops, and the need to mitigate soil salinity further strengthen demand across this region.
Market Segmentations:
By Product
- Potassium Chloride
- Potassium Sulphate
- Potassium Nitrate
By Application
- Fertilizers
- Agriculture
- Horticulture
- Floriculture
- Industrial
- Chemical Manufacturing
- Metallurgical Processes
- Water Softening
- Pharmaceuticals
By Geography
- North America
- Europe
- Germany
- France
- U.K.
- Italy
- Spain
- Rest of Europe
- Asia Pacific
- China
- Japan
- India
- South Korea
- South-east Asia
- Rest of Asia Pacific
- Latin America
- Brazil
- Argentina
- Rest of Latin America
- Middle East & Africa
- GCC Countries
- South Africa
- Rest of the Middle East and Africa
Competitive Landscape
The competitive landscape of the potassium sulphate market is characterized by a mix of global fertilizer manufacturers, regional producers, and vertically integrated agrochemical companies focused on specialty nutrient solutions. Leading players compete based on product purity, production technology, and distribution strength, particularly in high-value horticulture markets. Companies with advanced Mannheim furnace operations, brine-extraction capabilities, or integrated sulphur–potassium processing maintain a strategic cost advantage. Many producers are expanding water-soluble and high-purity grades to support fertigation, greenhouse farming, and export-oriented specialty crop segments. Partnerships with agro-input distributors, investments in micronized formulations, and geographic expansion into emerging horticulture clusters further intensify competition. Sustainability initiatives such as low-emission production processes and chloride-free nutrient portfolios are becoming key differentiators as buyers prioritize soil health and premium crop quality. Overall, the market remains moderately consolidated, with leading players focusing on capacity optimization, product innovation, and downstream value-chain integration to strengthen market presence.
Shape Your Report to Specific Countries or Regions & Enjoy 30% Off!
Key Player Analysis
Recent Developments
- In November 2025, Mosaic Company welcomed the U.S. decision to add phosphate and potash to the Critical Minerals List, underscoring its strategic positioning in nutrient supply chains.
- In July 2025, Mosaic Company opened a new facility in Palmeirante, Brazil, featuring automated blending and bagging systems and direct rail-to-port connectivity, enhancing its ability to deliver specialty fertilizer blends.
Report Coverage
The research report offers an in-depth analysis based on Product, Application and Geography. It details leading market players, providing an overview of their business, product offerings, investments, revenue streams, and key applications. Additionally, the report includes insights into the competitive environment, SWOT analysis, current market trends, as well as the primary drivers and constraints. Furthermore, it discusses various factors that have driven market expansion in recent years. The report also explores market dynamics, regulatory scenarios, and technological advancements that are shaping the industry. It assesses the impact of external factors and global economic changes on market growth. Lastly, it provides strategic recommendations for new entrants and established companies to navigate the complexities of the market.
Future Outlook
- Demand for potassium sulphate will strengthen as growers prioritize chloride-free nutrition for high-value fruits, vegetables, and plantation crops.
- Adoption of micro-irrigation and fertigation systems will continue to boost the use of highly soluble potassium sulphate grades.
- Greenhouse, vertical farming, and controlled-environment agriculture will create new opportunities for premium water-soluble formulations.
- Rising focus on soil-health restoration and sulphur deficiency correction will enhance long-term consumption.
- Sustainability regulations will accelerate the shift away from high-chloride fertilizers toward potassium sulphate-based solutions.
- Technological upgrades in Mannheim and brine-extraction processes will improve supply reliability and production efficiency.
- Expansion of export-oriented horticulture will increase demand for high-purity, residue-compliant fertilizer inputs.
- Global fertilizer companies will invest in value-added blends and micronized potassium sulphate for precision farming.
- Regional producers will expand capacity to reduce import dependency in high-consumption agricultural markets.
- Integrated nutrient-management programs will further embed potassium sulphate into balanced fertilization strategies.


