Market Overview
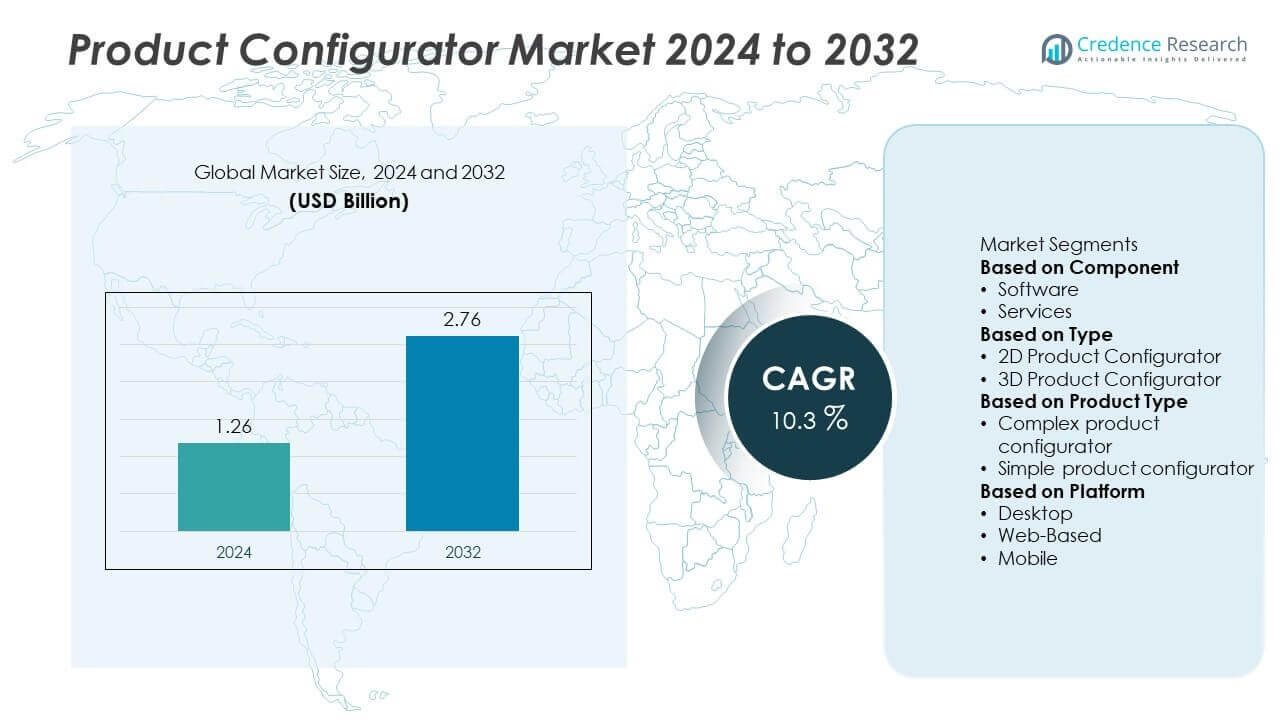
The Product Configurator Market was valued at USD 1.26 billion in 2024 and is projected to reach USD 2.76 billion by 2032, registering a CAGR of 10.3% during the forecast period.
| REPORT ATTRIBUTE |
DETAILS |
| Historical Period |
2020-2023 |
| Base Year |
2024 |
| Forecast Period |
2025-2032 |
| Product Configurator Market Size 2024 |
USD 1.26 Million |
| Product Configurator Market, CAGR |
10.3% |
| Product Configurator Market Size 2032 |
USD 2.76 Million |
The product configurator market is driven by key players including KBMax (Epicor Software Corporation), Conga (Apttus), THREEKIT INC, Configit A/S, Revalize, Inc, and Infosys Limited, who focus on delivering advanced CPQ and 3D visualization solutions. These companies emphasize cloud deployment, AI integration, and seamless ERP/CRM connectivity to improve sales efficiency and reduce order errors. North America leads the market with over 38% share in 2024, supported by early digital adoption and strong demand across manufacturing and automotive sectors. Europe follows with 30% share, driven by Industry 4.0 initiatives, while Asia-Pacific holds 22% share and represents the fastest-growing region due to rising industrialization and e-commerce adoption.
 Market Insights
- The product configurator market was valued at USD 1.26 billion in 2024 and is projected to reach USD 2.76 billion by 2032, growing at a CAGR of 10.3% during the forecast period.
- Rising demand for mass customization and automation in manufacturing drives adoption, with software accounting for over 65% share due to its ability to streamline sales processes and reduce errors.
- Key trends include integration of AI, 3D visualization, and AR/VR technologies, enabling immersive customer experiences and supporting higher conversion rates across industries like automotive and furniture.
- The market is highly competitive with players such as KBMax, Configit A/S, Conga, and THREEKIT INC focusing on cloud-based solutions, partnerships, and CPQ automation to expand their global footprint and gain competitive edge.
- North America leads with 38% share, followed by Europe with 30%, while Asia-Pacific holds 22% and emerges as the fastest-growing region due to rising industrialization and e-commerce expansion.
Access crucial information at unmatched prices!
Request your sample report today & start making informed decisions powered by Credence Research Inc.!
Download Sample
Market Segmentation Analysis:
By Component
The software segment dominates the product configurator market, accounting for over 65% share in 2024. This dominance is driven by the rising adoption of cloud-based and AI-enabled configurator platforms that streamline product visualization and order accuracy. Businesses increasingly invest in software solutions to reduce errors, accelerate quote-to-cash cycles, and improve customer experience. The services segment, including consulting and implementation, is growing steadily as enterprises require integration support and customization. The scalability and automation benefits offered by software continue to position it as the preferred choice across industries, particularly in manufacturing and retail sectors.
- For instance, Epicor CPQ (formerly KBMax), integrated with its cloud ERP platform, uses AI and advanced visualization to handle highly complex product configurations in real-time. The solution is designed to deliver a smooth customer experience through immersive 3D, AR, or VR visualizations.
By Type
The 3D product configurator segment leads the market with more than 55% share in 2024, fueled by demand for immersive, interactive product visualization. Businesses use 3D configurators to enhance customer engagement, reduce return rates, and support virtual sales demonstrations. Integration with AR/VR technologies is expanding adoption across automotive, furniture, and industrial equipment sectors. The 2D configurator segment retains relevance for simpler applications and cost-sensitive industries but faces slower growth as enterprises shift toward 3D tools for improved accuracy and personalization. The push for better user experience and visualization precision continues to drive 3D configurator demand globally.
- For instance, ThreeKit’s 3D product configurator platform supports photorealistic rendering of complex products, and its optimization tools are designed to achieve fast loading on eCommerce sites. The platform also features AR integration, enabling customers to virtually place products in real-world environments.
By Product Type
Complex product configurators dominate with over 60% market share in 2024, supported by industries like aerospace, automotive, and machinery that require multi-level customization. These configurators handle large product catalogs, intricate rules, and advanced pricing models, enabling efficient production planning and reducing lead times. Their adoption is driven by manufacturers aiming to streamline engineer-to-order processes and improve operational efficiency. Simple product configurators serve basic applications like consumer goods but capture a smaller share due to limited functionality. The growing focus on digital transformation and mass customization sustains the demand for complex configurators across global manufacturing ecosystems.
Key Growth Drivers
Rising Demand for Mass Customization
Manufacturers are increasingly adopting product configurators to enable mass customization and meet customer-specific requirements efficiently. This driver is crucial in industries such as automotive, furniture, and electronics, where personalized products are a major differentiator. Configurators streamline complex design processes, reduce order errors, and accelerate production timelines. The ability to offer tailored solutions without increasing costs enhances customer satisfaction and boosts sales conversion rates. This trend is expected to fuel sustained adoption of product configurators globally, supporting higher revenue generation for businesses investing in digital sales enablement tools.
- For instance, Tesla leverages its online vehicle configurator to streamline the order process, which reduces the potential for manual errors compared to traditional, dealership-based ordering systems.
Integration of AI and Cloud Technology
The rapid integration of AI and cloud computing into product configurator platforms is driving market growth. AI-powered configurators analyze customer preferences, suggest optimized configurations, and improve decision-making in real time. Cloud-based solutions provide scalability, remote access, and seamless collaboration between sales teams, engineers, and customers. This technological shift allows enterprises to deliver faster quotes, manage complex product data, and enhance customer experience. Cloud-enabled configurators also reduce IT infrastructure costs, making them accessible to small and medium-sized enterprises seeking efficient and flexible product configuration solutions.
- For instance, Siemens, using Tacton CPQ (Configure, Price, Quote) software, has significantly reduced the time it takes to generate quotes for its complex turbine business from eight weeks to just five minutes.
Focus on Reducing Sales Cycle Time
Enterprises are leveraging product configurators to shorten sales cycles and accelerate time-to-market. By automating configuration, pricing, and quoting (CPQ) processes, businesses reduce manual effort and improve order accuracy. Faster approvals and real-time updates improve responsiveness to customer inquiries and boost win rates in competitive markets. This efficiency helps manufacturers meet growing demand while minimizing operational costs. Shorter sales cycles also enable companies to capitalize on market opportunities more quickly, positioning product configurators as essential tools for sales enablement and competitive advantage across multiple industries.
Key Trends & Opportunities
Adoption of 3D and AR/VR Technologies
A major trend in the market is the integration of 3D visualization and AR/VR technologies into configurator platforms. These tools allow customers to interact with products in a virtual environment, improving engagement and purchase confidence. Industries like automotive and furniture are using 3D configurators to showcase realistic product models and reduce returns. The rising popularity of online shopping and virtual showrooms presents a strong opportunity for businesses to differentiate their offerings and drive digital sales growth through enhanced visualization experiences.
- For instance, IKEA’s IKEA Place app launched with over 2,000 furniture and accessory items; the app scales products based on room dimensions with 98% accuracy.
Expansion of Omnichannel and E-Commerce Integration
The rise of e-commerce and omnichannel retailing is creating opportunities for configurator vendors to offer seamless online-to-offline experiences. Businesses are embedding configurators into websites and mobile apps to provide customers with real-time customization and pricing options. This capability improves lead generation, increases conversion rates, and supports direct-to-consumer sales strategies. With growing demand for personalized online experiences, integrating configurators into digital channels will remain a significant growth lever for enterprises targeting tech-savvy, convenience-driven customers worldwide.
- For instance, Campfire, an AR/VR collaboration tool used by Collins Aerospace, offers a free tier that supports up to five projects and five collaborators with 5 GB file storage; this has accelerated engineering review loops by letting designers alter 3D CAD files in real time.
Key Challenges
High Implementation and Integration Costs
One of the key challenges for enterprises is the high upfront cost of implementing and integrating product configurator solutions. Complex installations often require customization, data migration, and staff training, which increase deployment expenses. Smaller companies may face difficulty justifying such investments despite the long-term benefits. High costs can slow adoption, particularly in price-sensitive markets, making vendors focus on offering scalable, modular, and subscription-based models to attract a wider customer base and lower entry barriers for potential users.
Complexity of Managing Product Data
Product configurators rely on accurate, updated product data to function effectively. Managing complex product catalogs, rules, and pricing data across multiple systems can be challenging for large enterprises. Inconsistent or outdated data can lead to errors in configurations and damage customer trust. Integrating configurators with ERP, CRM, and PLM systems requires significant effort and ongoing maintenance. Addressing this challenge is critical for businesses to ensure configurators deliver reliable outputs and support smooth operations across sales and production workflows.
Regional Analysis
North America
North America leads the product configurator market with over 38% share in 2024, driven by strong adoption across manufacturing, automotive, and industrial equipment sectors. The United States dominates regional demand, supported by early adoption of CPQ software, digital sales transformation, and investment in cloud technologies. The presence of key solution providers and advanced IT infrastructure strengthens market penetration. Growth is further fueled by increasing use of 3D visualization tools and AR/VR-based configurators to enhance customer engagement. High focus on reducing sales cycle times and improving operational efficiency ensures continued leadership of North America in this market.
Europe
Europe holds around 30% share of the product configurator market in 2024, with significant demand from Germany, France, and the United Kingdom. Strong manufacturing bases and Industry 4.0 initiatives drive adoption of configurators across automotive, aerospace, and machinery industries. Regulatory support for digital transformation and customization fuels growth. European enterprises emphasize sustainability and traceability, which align with rule-based configurator solutions for efficient production planning. Integration with ERP and PLM systems remains a key trend, enabling seamless data management. Continuous innovation and investments in digital sales tools position Europe as a hub for advanced product configurator solutions.
Asia-Pacific
Asia-Pacific accounts for over 22% share in 2024, making it the fastest-growing regional market. Rising industrialization, expanding manufacturing capabilities, and growing e-commerce adoption drive demand for configurator solutions. China, Japan, and India lead regional growth as enterprises focus on mass customization and digital commerce platforms. Increasing adoption of 3D and cloud-based configurators supports scalability for small and medium-sized businesses. Government initiatives promoting smart manufacturing and Industry 4.0 accelerate digital adoption. Expanding middle-class populations and rising demand for personalized products create strong opportunities, positioning Asia-Pacific as a key growth engine for global market expansion through 2032.
Latin America
Latin America captures around 6% share in 2024, with Brazil and Mexico leading adoption. Expanding automotive production, industrial equipment manufacturing, and retail digitalization are driving configurator deployment. Companies in the region are embracing configurators to streamline sales processes, reduce manual errors, and improve customer experience. Growth is supported by rising investments in cloud infrastructure and e-commerce platforms. Local manufacturers are focusing on implementing simple and cost-effective configurator solutions to enhance competitiveness. While adoption is slower compared to developed regions, the market shows strong potential as businesses digitize operations and cater to growing demand for customized products.
Middle East & Africa
The Middle East & Africa hold around 4% share in 2024, with demand concentrated in Gulf Cooperation Council (GCC) countries and South Africa. The region’s growth is supported by investments in industrial automation, construction equipment, and automotive sectors. Businesses adopt configurator tools to improve efficiency, support large infrastructure projects, and enable customized solutions. Rising digitalization initiatives and smart city projects create opportunities for configurator vendors. However, limited IT infrastructure and higher implementation costs pose adoption challenges. Strategic partnerships and localized solutions are expected to support steady growth and enhance market presence in this developing region.
Market Segmentations:
By Component
By Type
- 2D Product Configurator
- 3D Product Configurator
By Product Type
- Complex product configurator
- Simple product configurator
By Platform
By Geography
- North America
- Europe
- Germany
- France
- U.K.
- Italy
- Spain
- Rest of Europe
- Asia Pacific
- China
- Japan
- India
- South Korea
- South-east Asia
- Rest of Asia Pacific
- Latin America
- Brazil
- Argentina
- Rest of Latin America
- Middle East & Africa
- GCC Countries
- South Africa
- Rest of the Middle East and Africa
Competitive Landscape
The competitive landscape of the product configurator market features key players such as KBMax (Epicor Software Corporation), Conga (Apttus), THREEKIT INC, GoExpedi, Sofon B.V, Configit A/S, Revalize, Inc, 3D Source, Infosys Limited, and Resolto Informatik (Configon). These companies focus on delivering robust configurator solutions that integrate seamlessly with ERP, CRM, and PLM systems to streamline sales and production workflows. Vendors are investing in AI, cloud-based platforms, and 3D visualization technologies to enhance user experience and reduce configuration errors. Strategic initiatives include partnerships with manufacturers, expansion into e-commerce platforms, and development of industry-specific solutions. Many players are adopting subscription-based pricing models to attract small and medium enterprises while strengthening their global presence through digital transformation initiatives. Innovation in AR/VR-enabled configurators and CPQ automation is emerging as a key differentiator, allowing market leaders to gain a competitive edge and cater to rising demand for mass customization worldwide.
Shape Your Report to Specific Countries or Regions & Enjoy 30% Off!
Key Player Analysis
- KBMax (Epicor Software Corporation)
- Conga (Apttus)
- THREEKIT INC
- GoExpedi
- Sofon B.V
- Configit A/S
- Revalize, Inc
- 3D Source
- Infosys Limited
- Resolto Informatik (Configon)
Recent Developments
- In June 2025, Infosys Limited expanded their Configure-Price-Quote (CPQ) solutions with AI-powered recommendation engines that analyze over 2 million product variants and reduce configuration setup time by 40%, supporting complex B2B manufacturing client requirements.
- In February 2024, KBMax (Epicor Software Corporation) launched an enhanced version of Epicor CPQ featuring their KB3D visual configurator with advanced Sketch and Extrude functionality.
- In 2024, Revalize, Inc launched enhancements to their industrial equipment configurator that supports up to 50,000 configuration rules and dynamically generates 3D CAD files in under 5 seconds per configuration.
- In February 2023, Configit A/S released the Configit Ace® SaaS product configuration and variant management platform.
Report Coverage
The research report offers an in-depth analysis based on Component, Type, Product Type, Platform and Geography. It details leading market players, providing an overview of their business, product offerings, investments, revenue streams, and key applications. Additionally, the report includes insights into the competitive environment, SWOT analysis, current market trends, as well as the primary drivers and constraints. Furthermore, it discusses various factors that have driven market expansion in recent years. The report also explores market dynamics, regulatory scenarios, and technological advancements that are shaping the industry. It assesses the impact of external factors and global economic changes on market growth. Lastly, it provides strategic recommendations for new entrants and established companies to navigate the complexities of the market.
Future Outlook
- The product configurator market will continue to grow due to rising demand for mass customization.
- Cloud-based and AI-enabled configurators will gain wider adoption across manufacturing and retail sectors.
- 3D visualization and AR/VR technologies will become standard features to boost customer engagement.
- Integration with ERP, CRM, and PLM systems will streamline operations and improve data accuracy.
- Subscription-based pricing models will attract more small and medium-sized enterprises.
- Demand for complex product configurators will increase in automotive, aerospace, and industrial equipment sectors.
- E-commerce and omnichannel integration will strengthen direct-to-consumer configurator adoption.
- Vendors will focus on improving configurator speed and scalability for global deployments.
- Partnerships with technology providers and manufacturers will enhance solution capabilities and market reach.
- Asia-Pacific will emerge as the fastest-growing region, driven by rapid industrialization and digital transformation.


