
Market Overview
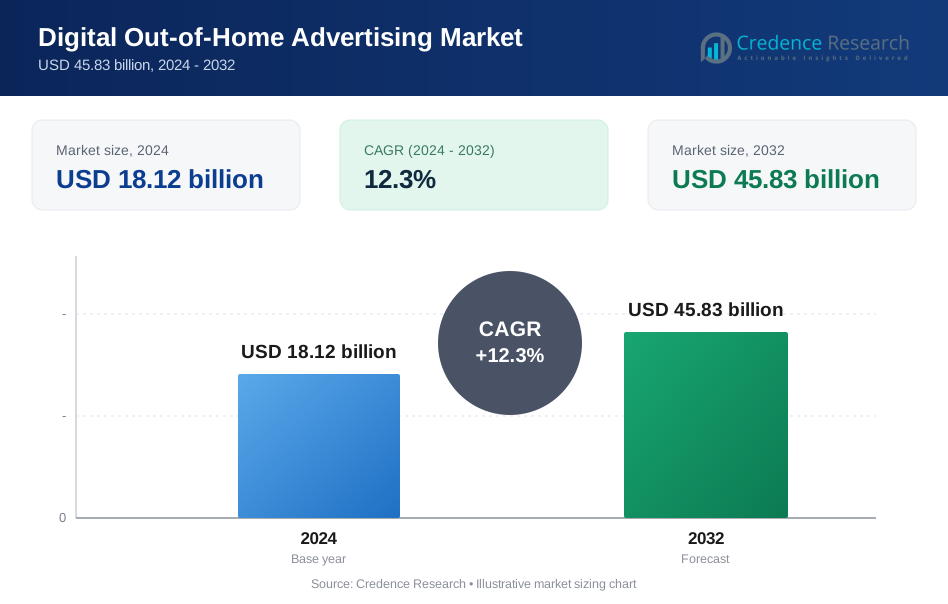
The global Digital Out-of-Home (DOOH) Advertising Market was valued at USD 18.12 billion in 2024 and is projected to reach USD 45.83 billion by 2032, expanding at a CAGR of 12.3% during the forecast period.
| REPORT ATTRIBUTE | DETAILS |
|---|---|
| Historical Period | 2020-2023 |
| Base Year | 2024 |
| Forecast Period | 2025-2032 |
| Digital Out-of-Home (DOOH) Advertising Market Size 2024 | USD 18.12 Billion |
| Digital Out-of-Home (DOOH) Advertising Market, CAGR | 12.3% |
| Digital Out-of-Home (DOOH) Advertising Market Size 2032 | USD 45.83 Billion |
The digital out-of-home (DOOH) advertising market is shaped by major global and regional players, with JCDecaux, Clear Channel Outdoor, Lamar Advertising, OUTFRONT Media, Ströer, Ocean Outdoor, Focus Media, Alliance Media, Daktronics, and Talon Outdoor leading network expansion and technology adoption. These companies invest heavily in high-resolution LED infrastructure, programmatic integrations, and audience analytics to strengthen premium inventory and advertiser performance. North America remains the largest regional market with approximately 34% share, supported by advanced digital signage networks and strong programmatic uptake, while Asia-Pacific, holding around 30%, leads in deployment scale and rapid urban digitization. Europe follows with roughly 28%, driven by mature OOH ecosystems and rising dynamic content adoption.
Market Insights
- The global digital out-of-home (DOOH) advertising market was valued at USD 18.12 billion in 2024 and is expected to reach USD 45.83 billion by 2032, registering a CAGR of 12.3% during the forecast period.
- Market growth is driven by expanding digital billboard infrastructure, rising programmatic adoption, and increasing demand for real-time, data-triggered advertising across high-traffic environments, with billboards holding the largest format share.
- Key trends include the integration of DOOH with mobile and CTV campaigns, rapid deployment of high-brightness LED panels, and rising use of AI, computer vision, and contextual triggers to enhance targeting and campaign measurement.
- The competitive landscape is led by operators such as JCDecaux, Clear Channel Outdoor, Lamar Advertising, OUTFRONT Media, Ströer, Ocean Outdoor, Focus Media, Daktronics, Alliance Media, and Talon Outdoor, competing on network scale, premium locations, and technological capabilities.
- Regionally, North America holds ~34%, Asia-Pacific ~30%, and Europe ~28% of the market, supported by strong urban digitization, transit modernization, and growing advertiser demand for measurable, high-impact DOOH inventory.
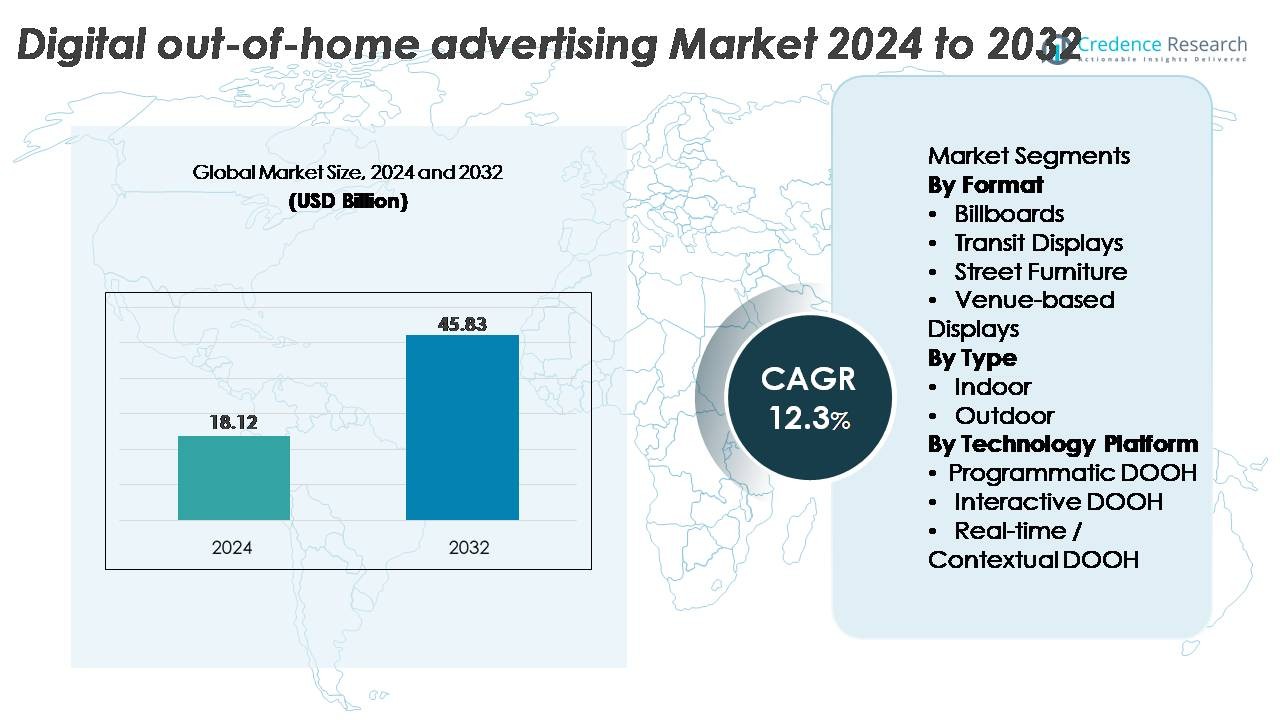 Market Segmentation Analysis:
By Format
Billboards remain the dominant format in digital out-of-home advertising, driven by their high visibility, large-format impact, and strategic placement across highways, urban centers, and commercial districts. Their ability to support ultra-HD LED screens, dynamic content rotation, and programmatic triggers strengthens advertiser preference. Transit displays continue to expand due to rising airport, metro, and bus terminal deployments, while street furniture and venue-based displays gain traction in dense urban clusters. The increasing integration of location-based analytics and automated content scheduling further reinforces billboards’ leadership in audience reach and campaign scalability.
· For instance, Lamar Advertising operates one of the largest digital billboard networks in the U.S., with more than 4,000 digital displays deployed across major markets. Clear Channel Outdoor also maintains a large digital footprint, with over 1,500 roadside and urban digital faces that support dynamic content rotation such as 8-second ad slots. These networks reflect the ongoing expansion of large-scale DOOH infrastructure in North America.
By Type
Outdoor DOOH leads the market, supported by widespread adoption of digital billboards, transit networks, and roadside signage capable of delivering high-frequency impressions to mobile and commuter audiences. Its dominance is reinforced by continuous upgrades to LED brightness, energy efficiency, and remote asset management systems. Indoor DOOH including displays in malls, airports, retail stores, and entertainment venues shows strong momentum as advertisers capitalize on dwell-time environments and audience targeting accuracy. However, outdoor networks maintain higher market share due to expansive coverage, real-time content capabilities, and greater investment from media owners.
- For instance, OUTFRONT Media reports operating more than 8,000 digital displays across the U.S., with its ON Smart Media platform enabling content refresh cycles in under 15 seconds through LTE-enabled controllers.
By Technology Platform
Programmatic DOOH is the dominant technology segment, driven by its ability to automate ad-buying, optimize impressions, and leverage data sources such as mobility patterns, weather feeds, and audience metrics. Its scalable, performance-driven approach attracts brands seeking measurable outcomes and dynamic campaign adjustments. Interactive DOOH grows steadily through touchscreens, gesture-based systems, and mobile-linked engagement, especially in premium retail and event venues. Real-time/contextual DOOH accelerates adoption as advertisers deploy content triggered by live conditions. Nevertheless, programmatic platforms retain the largest share due to operational efficiency and improved ROI measurement.
Key Growth Drivers:
Expansion of Programmatic DOOH and Data-Driven Campaign Delivery
Programmatic DOOH continues to fuel market expansion by enabling automated, real-time buying and selling of outdoor ad inventory. The ability to integrate diverse data feeds such as mobility analytics, weather conditions, dayparting patterns, and demographic movement allows advertisers to optimize content delivery with higher precision and contextual relevance. Brands increasingly rely on audience intelligence platforms to refine targeting accuracy and improve campaign ROI, making DOOH performance more measurable and comparable to digital channels. Media owners deploy advanced SSPs, DSP integrations, and cross-screen attribution models to unify planning across connected ecosystems. This technical transformation not only accelerates adoption among large consumer brands but also opens DOOH inventory to small and mid-size businesses through flexible, impression-based buying models. As transparency and automation improve, programmatic DOOH firmly emerges as a primary catalyst for sustained market growth.
· For instance, Broadsign Reach provides programmatic access to a global network that now exceeds 1.8 million digital screens following its 2025 expansion, reflecting one of the largest DOOH inventories worldwide. Vistar Media remains a major programmatic DOOH platform operating at high transaction volumes, supporting large-scale global bid activity across its DSP and SSP ecosystem. These platforms demonstrate the rapid growth and integration of programmatic DOOH infrastructure.
Rapid Global Deployment of High-Resolution LED and Smart Display Infrastructure
The continuous upgrade of digital signage infrastructure significantly drives the DOOH market, particularly through high-resolution LED panels, energy-efficient display modules, and weather-resistant outdoor systems. Modern screens deliver superior brightness, contrast ratios, and wider viewing angles, making them suitable for diverse environmental conditions and long operating hours. Cities worldwide are adopting smart urban signage systems integrated with sensors, IoT modules, and centralized content management platforms, expanding premium inventory across transport hubs, business districts, and entertainment zones. These technology advancements increase advertiser willingness to shift budgets from static to dynamic formats due to improved visual impact and enhanced audience engagement. Media operators also invest in remote monitoring, predictive maintenance, and automated diagnostics, reducing operational costs and downtime. As infrastructure modernization accelerates across emerging and developed markets, digital networks become more scalable, thereby reinforcing strong, long-term growth momentum.
- For instance, Daktronics supplies outdoor LED displays built with larger pixel pitches optimized for long-distance viewing, emphasizing durability and consistent image performance for roadside DOOH installations. Samsung’s outdoor LED lines, such as the XAT and XPR-E series, deliver brightness levels up to about 3,300 nits and are engineered for 24/7 operation with lifetimes exceeding 100,000 hours. These capabilities show how DOOH hardware continues to advance in reliability and visual quality.
Rising Demand for Real-Time, Contextual, and Audience-Responsive Advertising
A major growth driver is the increasing focus on contextualized and adaptive DOOH content that responds instantly to real-world triggers. Advertisers leverage integrations with live data sources including traffic patterns, sports scores, weather updates, inventory levels, and event schedules to deliver highly relevant messages at optimal moments. This dynamic messaging capability significantly elevates engagement and conversion potential, especially for retail, travel, entertainment, and quick-service restaurant segments. Brands increasingly prefer DOOH for its ability to amplify omnichannel campaigns, align with mobile targeting, and support sequential storytelling. Audience-responsive systems also enhance compliance with brand safety and regulatory requirements by enabling content adjustments in real time. As AI-based creative optimization, computer vision analytics, and mobility datasets become more widely accessible, DOOH transitions from static messaging to intelligent, situational communication, strengthening its value proposition across global advertising strategies.
Key Trends and Opportunities:
Integration of DOOH with Mobile, CTV, and Omnichannel Advertising Ecosystems
One of the strongest trends is the merging of DOOH with broader omnichannel strategies, allowing advertisers to build cohesive, cross-platform experiences. DOOH increasingly works in tandem with mobile retargeting, connected TV advertising, and social media amplification, enabling sequenced messaging across touchpoints. As identity-based and location-based analytics improve, brands use DOOH as a top-of-funnel awareness tool that drives measurable mid- and lower-funnel actions through mobile and digital channels. This convergence creates opportunities for unified audience measurement, cross-device attribution, and synchronized creative deployments. Media owners and ad-tech providers are integrating DOOH inventory into omnichannel DSPs and retail media networks, supplying advertisers with consolidated planning and optimization tools. This ecosystem expansion positions DOOH as a central component of full-funnel digital advertising frameworks.
· For instance, Vistar Media enables mobile retargeting campaigns that activate when a consumer is exposed to DOOH screens, allowing advertisers to extend reach across mobile environments. Yahoo DSP also provides unified programmatic access to a large global network of DOOH screens through its integrated SSP partnerships. These capabilities support cross-channel strategies that link DOOH with mobile and CTV audiences.
Growth Opportunities in Smart Cities, Transit Networks, and Urban Mobility Hubs
Smart city initiatives present significant opportunities for DOOH expansion, driven by government investments in digital infrastructure, intelligent transportation systems, and public information networks. Transit environments airports, metros, railways, rideshare zones, and EV charging stations offer high-dwell, high-frequency settings where DOOH screens deliver strong engagement. Urban mobility data helps advertisers design campaigns aligned with population flow patterns, improving relevance and real-world impact. As cities implement digital street furniture, interactive kiosks, and dynamic wayfinding displays, DOOH networks evolve into multifunctional communication platforms that serve both commercial and public interests. This transformation attracts diverse advertisers, including retail, fintech, travel, entertainment, and civic agencies, creating robust, long-term growth potential across metropolitan regions.
· For instance, JCDecaux, the world’s largest OOH media company, operates over one million advertising panels worldwide and continues to expand its digital inventory. The firm’s Filtreo bus shelters in cities like Paris and Krakow filter fine particles and support NFC and QR interactions. JCDecaux also uses remote monitoring systems to maintain high uptime and fast servicing across its digital assets.
Rising Adoption of AI, Computer Vision, and Predictive Analytics in DOOH
AI-driven tools are reshaping the DOOH landscape by enabling automated content optimization, predictive audience modeling, and improved operational efficiency. Computer vision systems help anonymously analyze footfall patterns, dwell time, and engagement levels, helping media owners deliver more accurate audience impressions and advertisers refine targeting. AI-powered creative engines generate real-time variations of content based on environmental cues, enhancing personalization and message relevance. Predictive analytics enables inventory forecasting, dynamic pricing, and performance benchmarking across networks. These capabilities elevate DOOH’s competitiveness with online advertising by delivering measurable impact and reducing waste. As AI technologies mature, DOOH operators gain opportunities to differentiate offerings with advanced analytics dashboards, real-time insights, and intelligent content automation.
Key Challenges:
Measurement Standardization and Attribution Complexity
Despite strong technological advancement, consistent measurement across DOOH networks remains a major challenge. Variability in data sources, impression-counting methodologies, and screen-level reporting creates difficulties in comparing performance across media owners and geographies. Advertisers increasingly demand digital-like attribution, including footfall lift, store visits, and mobile retargeting outcomes; however, fragmented systems hinder seamless evaluation. Integration across DSPs, SSPs, and data verification platforms is improving, but standardization progresses slowly. These inconsistencies can limit programmatic adoption and create hesitancy among data-driven marketers. Establishing unified metrics for impressions, dwell time, and viewability remains essential for scaling DOOH investment.
High Capital Investment and Operational Costs for Digital Infrastructure
Deploying and maintaining digital outdoor infrastructure requires substantial capital, particularly for large-format LED billboards, weatherproof enclosures, power supply systems, and network monitoring technologies. Operators face significant upfront expenditure alongside ongoing costs such as maintenance, electricity, software licensing, and periodic hardware upgrades. These financial barriers can delay network rollout in emerging markets or low-density regions where advertiser demand may not justify rapid expansion. Additionally, regulatory restrictions, permit requirements, and zoning constraints increase complexity and potential delays in deployment. While long-term ROI is strong, these challenges necessitate careful location planning, strategic partnerships, and value-added service models to ensure sustained network profitability.
Regional Analysis
North America
North America holds approximately 34% of the global DOOH advertising market, driven by extensive digital billboard networks, rapid programmatic adoption, and strong investments from media owners across the U.S. and Canada. Urban hubs such as New York, Los Angeles, Chicago, and Toronto host some of the highest-density digital signage footprints, supported by advanced audience measurement and cross-channel attribution systems. Retail, automotive, entertainment, and technology brands continue to shift budgets toward DOOH due to superior targeting and analytics. Increasing upgrades to high-brightness LED façades, airport networks, and transit systems further reinforce the region’s leadership position.
Europe
Europe accounts for nearly 28% of the DOOH market, supported by mature OOH infrastructure and strong regulatory alignment for digital media deployment. The U.K., Germany, France, and the Nordics exhibit high penetration of digital street furniture, transport displays, and roadside networks. Programmatic DOOH adoption accelerates as advertisers integrate real-time mobility and geolocation datasets into dynamic campaigns. Major cities including London, Berlin, Paris, and Stockholm expand smart city initiatives, boosting premium DOOH inventory. Growth is further supported by transit modernization, sustainability-focused LED upgrades, and rising demand for data-driven campaigns across retail, telecom, and travel sectors.
Asia-Pacific
Asia-Pacific commands roughly 30% of global DOOH revenue and represents the fastest-growing regional market. China, Japan, South Korea, India, and Australia are major contributors, supported by large urban populations and heavy investment in digital display networks across malls, metro stations, airports, and commercial districts. China leads regional deployment with extensive large-format LED installations, while Japan and South Korea advance interactive and AI-led DOOH. India accelerates adoption through smart-city corridors and transit modernization. The region benefits from mobile-first consumer behavior, high digital engagement levels, and expanding programmatic infrastructure that enhances campaign precision and scalability.
Latin America
Latin America captures nearly 5% of the DOOH advertising market, with growth led by Brazil, Mexico, Chile, and Colombia. Expansion is driven by rising urbanization, modernization of transport hubs, and increased investment in digital billboards and mall-based screens. Although adoption is slower compared to mature regions, improvements in programmatic infrastructure and mobile-based audience measurement strengthen market potential. Advertisers in retail, beverages, entertainment, and telecom increasingly adopt DOOH for high-visibility campaigns across metropolitan areas. Infrastructure constraints and economic volatility remain hurdles, but the region’s growing digital ecosystem supports healthy long-term adoption.
Middle East & Africa
The Middle East & Africa region accounts for approximately 3% of global DOOH revenue, supported by rapid development in the UAE, Saudi Arabia, South Africa, and Qatar. Smart city projects in Dubai, Riyadh, and Doha accelerate deployment of digital street furniture, transit displays, and large-format LED walls. Airport modernization and retail expansion contribute additional premium inventory. Brands in luxury, tourism, automotive, and financial services utilize DOOH for high-impact campaigns aligned with international traffic flows. While adoption remains uneven across Africa due to infrastructure gaps, GCC markets demonstrate strong momentum through technology-led urban development initiatives.
Market Segmentations:
By Format
- Billboards
- Transit Displays
- Street Furniture
- Venue-based Displays
By Type
- Indoor
- Outdoor
By Technology Platform
- Programmatic DOOH
- Interactive DOOH
- Real-time / Contextual DOOH
By Geography
- North America
- U.S.
- Canada
- Mexico
- Europe
- Germany
- France
- U.K.
- Italy
- Spain
- Rest of Europe
- Asia Pacific
- China
- Japan
- India
- South Korea
- South-east Asia
- Rest of Asia Pacific
- Latin America
- Brazil
- Argentina
- Rest of Latin America
- Middle East & Africa
- GCC Countries
- South Africa
- Rest of the Middle East and Africa
Competitive Landscape
The digital out-of-home (DOOH) advertising market features a competitive landscape characterized by global media owners, regional OOH operators, and technology-driven ad-tech platforms expanding programmatic and data-led capabilities. Leading players such as JCDecaux, Clear Channel Outdoor, Lamar Advertising, OUTFRONT Media, Stroer, Focus Media, and Global invest heavily in high-resolution LED networks, automated content delivery, and advanced analytics to enhance inventory value. Programmatic specialists Vistar Media, Broadsign, Hivestack, Place Exchange, and Admobilize strengthen ecosystem integration through SSP, DSP, and attribution partnerships, enabling cross-channel audience planning. Companies increasingly prioritize AI-enabled targeting, location intelligence, and measurable performance outcomes, driving consolidation and global expansion strategies. Emerging operators in Asia-Pacific and the Middle East diversify the landscape through rapid deployment across transit terminals, malls, and smart-city corridors. Collectively, competition intensifies around data transparency, network scalability, premium locations, and omnichannel interoperability, shaping the future trajectory of the DOOH market.
Key Player Analysis
- Ocean Outdoor (U.K.)
- Daktronics (U.S.)
- Alliance Media (South Africa)
- OUTFRONT Media (U.S.)
- Ströer SE & Co. KGaA (Germany)
- Talon Outdoor Ltd (U.K.)
- Focus Media (China)
- JCDecaux (France)
- Lamar Advertising (U.S.)
- Clear Channel Outdoor (U.S.)
Recent Developments
- In October 2025, Ocean Outdoor announced a leadership reshuffle: the UK business head (formerly Chief Commercial Officer) was promoted to UK CEO, and the prior UK CEO moved into the Group Chief Operating Officer role signaling strategic organizational changes ahead of further European expansion.
- In July 2025, Ocean Outdoor unveiled a new immersive 3D-canvas format the “Ocean Showcase™” featuring a precision-engineered LED structure nearly six metres wide and three metres high, built in-house by Ocean Labs.
- In July 2025, Daktronics launched a new generation of eco-conscious digital billboards (model DXB-1000) targeted at urban environments. The new billboards deliver superior image quality while reducing energy consumption and maintenance needs, aligning with demand for sustainable and high-performance OOH infrastructure.
Report Coverage
The research report offers an in-depth analysis based on Format, Type, Technology platform and Geography. It details leading market players, providing an overview of their business, product offerings, investments, revenue streams, and key applications. Additionally, the report includes insights into the competitive environment, SWOT analysis, current market trends, as well as the primary drivers and constraints. Furthermore, it discusses various factors that have driven market expansion in recent years. The report also explores market dynamics, regulatory scenarios, and technological advancements that are shaping the industry. It assesses the impact of external factors and global economic changes on market growth. Lastly, it provides strategic recommendations for new entrants and established companies to navigate the complexities of the market.
Future Outlook
- DOOH networks will expand rapidly across urban centers as cities adopt more smart infrastructure and digital street furniture.
- Programmatic DOOH will become the default buying method, driven by automation, data integrations, and flexible impression-based transactions.
- AI and machine learning will increasingly optimize creative delivery, audience prediction, and real-time campaign adjustments.
- Contextual and trigger-based advertising will gain broader adoption as brands leverage weather, traffic, and mobility data for dynamic messaging.
- Integration with mobile, CTV, and omnichannel platforms will strengthen DOOH’s role in full-funnel marketing strategies.
- High-resolution LED, 3D anamorphic screens, and interactive formats will enhance creative possibilities and viewer engagement.
- Measurement will become more standardized as industry bodies and ad-tech firms harmonize impression metrics and attribution models.
- Sustainability initiatives will drive adoption of energy-efficient screens and renewable-power-supported installations.
- Transit hubs, airports, and retail destinations will see accelerated network deployment due to high dwell-time audiences.
- Emerging markets will experience faster DOOH penetration supported by rising urbanization and digital infrastructure investments.
Request a Free Sample
Fill in your details and we'll send you a free sample report.
- Sample data tables & charts
- Research methodology
Need a Custom Version of This Report?
Tailor the scope, geography, or segments to your exact requirements.
- Custom geography or segment scope
- Direct access to our analyst team
Frequently Asked Questions
What is the current market size for Digital Out-of-Home (DOOH) Advertising, and what is its projected size in 2032?
At what Compound Annual Growth Rate is the Digital Out-of-Home (DOOH) Advertising market projected to grow between 2024 and 2032?
Which Digital Out-of-Home (DOOH) segment held the largest share in 2024?
What are the primary factors fueling the growth of the Digital Out-of-Home (DOOH) Advertising market?
Who are the leading companies in the Digital Out-of-Home (DOOH) Advertising market?
Which region commanded the largest share of the Digital Out-of-Home (DOOH) Advertising market in 2024?
Table of Content
Chapter 1. Report Introduction
- 1.1 Report Description & Purpose
- 1.1.1 Report Title & Market Definition
- 1.1.2 Unique Selling Propositions (USP) & Key Differentiators
- 1.1.3 Value Proposition for Stakeholders
- 1.2 Research Objectives
- 1.2.1 Market Sizing Objectives (Volume & Revenue) (Volume Where Applicable)
- 1.2.2 Segmentation Objectives
- 1.2.3 Competitive Intelligence Objectives
- 1.2.4 Forecast & Scenario Objectives
- 1.3 Report Scope
- 1.3.1 Digital Out-of-Home Advertising Scope – Segments & Subsegments Covered
- 1.3.2 Geographic Scope – Regions & Countries Covered
- 1.3.3 Historical Period, Base Year & Forecast Period (2024; forecast to 2032)
- 1.3.4 Inclusions & Exclusions
- 1.4 Industry Classification & Applicable Codes
- 1.5 Currency, Measurement Units & Valuation Basis
- 1.6 Target Stakeholders
- 1.7 Limitations & Assumptions
Chapter 2. Executive Summary
- 2.1 Global Digital Out-of-Home Advertising Market Snapshot
- 2.1.1 Market Size – Historical (2024) & Forecast (2024-2032) (2024: USD 18.12 billion → 2032: USD 45.83 billion)
- 2.1.2 Volume & Revenue – Global Totals (Volume Where Applicable)
- 2.1.3 Key Market Highlights – Top Five Facts
- 2.2 Digital Out-of-Home Advertising Market Segmentation Snapshot
- 2.2.1 Market Split by Region – 2024 vs. 2032
- 2.3 Competitive Snapshot
- 2.3.1 Top 10 Players by Revenue Share – 2024
- 2.3.2 Top 10 Players by Volume Share – 2024 (Volume Where Applicable)
- 2.3.3 Recent Strategic Developments (18-Month Summary)
- 2.4 Key Investment Highlights & Strategic Conclusions
Chapter 3. Digital Out-of-Home Advertising Market Dynamics & Industry Analysis
- 3.1 Market Overview & Context
- 3.1.1 Digital Out-of-Home Advertising Market Position in the Broader Industry Value Chain
- 3.1.2 Demand Structure & Purchasing Dynamics
- 3.1.3 Market Maturity & Development Stage by Region
- 3.2 Digital Out-of-Home Advertising Market Drivers
- 3.3 Digital Out-of-Home Advertising Market Restraints & Challenges
- 3.4 Digital Out-of-Home Advertising Market Opportunities
- 3.5 Porter's Five Forces Analysis
- 3.5.1 Threat of New Entrants
- 3.5.2 Bargaining Power of Suppliers
- 3.5.3 Bargaining Power of Buyers
- 3.5.4 Threat of Substitutes
- 3.5.5 Competitive Rivalry – Intensity Assessment
- 3.6 Digital Out-of-Home Advertising Value Chain Analysis
- 3.6.1 Upstream – Key Inputs, Resources & Suppliers
- 3.6.1.1 Key Input/Resource 1
- 3.6.1.2 Key Input/Resource 2
- 3.6.1.3 Key Input/Resource 3
- 3.6.2 Midstream – Core Operations & Value Creation
- 3.6.2.1 Operating Model & Process Overview
- 3.6.2.2 Key Operating Locations & Capabilities by Company
- 3.6.3 Downstream – Market Channels & End Users
- 3.6.3.1 Direct Sales & Customer Engagement Channels
- 3.6.3.2 Indirect Sales, Intermediaries & Partner Channels
- 3.6.4 Value Chain Profitability Analysis
- 3.6.1 Upstream – Key Inputs, Resources & Suppliers
- 3.7 PESTEL Analysis
- 3.7.1 Political Factors
- 3.7.2 Economic Factors
- 3.7.3 Social Factors
- 3.7.4 Technological Factors
- 3.7.5 Environmental Factors
- 3.7.6 Legal Factors
- 3.8 Digital Out-of-Home Advertising Supply Chain Analysis
- 3.8.1 Critical Input & Resource Availability Risk Assessment
- 3.8.2 Supplier & Operational Concentration Risk (Geographic Exposure)
- 3.8.3 Supply & Service Disruption Impact Analysis
- 3.9 Regulatory & Policy Landscape
Note: The regulatory and policy landscape section covers regulations based on their applicability to the market, Digital Out-of-Home Advertising category, geography, and scope of the study. Only regulatory frameworks with a material impact on operations, compliance, trade, sustainability, or market access are analyzed in detail.
Chapter 4. Key Investment Pockets & Opportunity Analysis
- 4.1 Digital Out-of-Home Advertising Market Attractiveness Analysis
- 4.1.1 By Region – Investment Attractiveness Matrix (Market Size × CAGR)
- 4.2 Absolute Revenue Growth Opportunity
- 4.2.1 By Region – Absolute Revenue Growth Through 2032
- 4.3 Incremental Demand Opportunity
- 4.3.1 By Region – Incremental Demand Through 2032
- 4.3.2 Segment – Incremental Demand
- 4.4 Emerging Submarket Opportunity Deep Dive (Subject to Applicability)
- 4.5 Priority Market Opportunity Scorecards
- 4.5.1 United States
- 4.5.2 Europe
- 4.5.3 Asia
- 4.5.4 Middle East & Africa
Note: Priority market opportunity scorecards reflect the geographic scope and strategic relevance of the study. Listed markets are indicative and may be adapted to the industry.
Chapter 5. Digital Out-of-Home Advertising Cross-Border Trade & Market Access Analysis
- 5.1 International Trade & Cross-Border Activity Overview
- 5.1.1 Global Export Value by Country (2024)
- 5.1.2 Global Export Volume by Country (2024) (Volume Where Applicable)
- 5.1.3 Global Import Value by Country (2024)
- 5.1.4 Global Import Volume by Country (2024) (Volume Where Applicable)
- 5.1.5 Net Trade Balance by Country (2024)
- 5.2 Export Analysis – Segment
- 5.2.1 Category 1 (Applicable Classification Code)
- 5.2.2 Category 2 (Applicable Classification Code)
- 5.2.3 Category 3 (Applicable Classification Code)
- 5.2.4 Category 4 (Applicable Classification Code)
- 5.2.5 Category 5 (Applicable Classification Code)
- 5.3 Import Analysis – Segment
- 5.3.1 Category 1 (Applicable Classification Code)
- 5.3.2 Category 2 (Applicable Classification Code)
- 5.3.3 Category 3 (Applicable Classification Code)
- 5.3.4 Category 4 (Applicable Classification Code)
- 5.3.5 Category 5 (Applicable Classification Code)
- 5.4 Cross-Border Pricing & Transaction Benchmarks
- 5.4.1 Export Pricing – Segment & Country
- 5.4.2 Import Pricing – Segment & Source Country
- 5.4.3 Price Trends (2024)
- 5.5 Key Cross-Border Trade & Delivery Routes
- 5.5.1 Cross-Border Trade/Delivery Route 1
- 5.5.2 Cross-Border Trade/Delivery Route 2
- 5.5.3 Cross-Border Trade/Delivery Route 3
- 5.5.4 Cross-Border Trade/Delivery Route 4
- 5.5.5 Cross-Border Trade/Delivery Route 5
- 5.6 Trade Policy & Market Access Impact Assessment
- 5.6.1 Tariff & Non-Tariff Barriers
- 5.6.2 Regional Trade & Economic Integration Frameworks
- 5.6.3 Bilateral & Multilateral Trade Agreements
- 5.6.4 Cross-Border Operating, Licensing & Localization Requirements
Note: This chapter applies where cross-border trade or delivery is relevant to Digital Out-of-Home Advertising. Goods, services, and digital offerings are assessed using applicable classifications and transaction measures. Import-export volumes, trade balances, and route analyses are included only where meaningful to the market.
Chapter 6. Competitive Landscape & Company Benchmarking
- 6.1 Digital Out-of-Home Advertising Market Concentration & Structure
- 6.1.1 Herfindahl-Hirschman Index (HHI) – vs. 2024
- 6.1.2 Leading, Mid-Sized & Emerging Player Structure
- 6.1.3 Global, Regional & Local Player Dynamics
- 6.2 Digital Out-of-Home Advertising Market Share Analysis – 2024
- 6.2.1 Global Revenue Share by Company
- 6.2.2 Global Volume Share by Company (Volume Where Applicable)
- 6.2.3 Regional Revenue Share
- 6.2.4 Market Share Evolution ( vs. 2024)
- 6.2.5 Company Market Share by Key Segment
- 6.2.6 Company Market Share by Customer Group
- 6.3 Operating Scale, Capacity & Infrastructure Analysis
- 6.3.1 Global Operating Scale & Supply Capacity
- 6.3.2 Resource Utilization & Operating Efficiency
- 6.3.3 Output, Service Delivery & Activity Metrics
- 6.3.4 Operating Footprint & Infrastructure Map
- 6.3.5 Planned Operational & Capacity Expansion
- 6.4 Digital Out-of-Home Advertising Competitive Benchmarking Matrix
- 6.4.1 Revenue, Growth, Profitability & Operating Metric Comparison
- 6.4.2 Channel Revenue Mix
- 6.4.3 Geographic Revenue Exposure
- 6.4.4 R&D Intensity
- 6.4.5 Sustainability Maturity
- 6.5 Strategic Developments in Digital Out-of-Home Advertising (Last 24 Months)
- 6.5.1 Mergers, Acquisitions & Divestments
- 6.5.2 New Products, Services & Solutions in Digital Out-of-Home Advertising
- 6.5.3 Operational & Infrastructure Expansions
- 6.5.4 Strategic Alliances, Joint Ventures & Partnerships
- 6.5.5 Distribution Expansion & Market Entry
- 6.5.6 Sustainability & ESG Initiatives
- 6.6 Competitive Strategy Mapping
- 6.6.1 Leader, Challenger, Follower & Niche Classification
- 6.6.2 Pricing Strategy Comparison
- 6.6.3 Channel Strategy Matrix
Note: Strategic developments are included based on their materiality and the availability of reliable information.
Chapter 7. Global Digital Out-of-Home Advertising Market – By Sales & Delivery Channel
- 7.1 Segment Overview
- 7.1.1 Volume & Revenue Split by Channel (2024 & 2032) (Volume Where Applicable)
- 7.1.2 Channel Mix Evolution (2024-2032)
Chapter 8. Regional Market Analysis – Global Overview
- 8.1 Global Regional Overview
- 8.1.1 Regional Volume Share (Volume Where Applicable)
- 8.1.2 Regional Revenue Share
- 8.1.3 Regional Volume by Region (Volume Where Applicable)
- 8.1.4 Regional Revenue by Region
- 8.1.5 Regional Forecast Through 2032
- 8.2 Cross-Regional Segment Analysis
- 8.2.1 By Sales & Delivery Channel
- 8.2.2 By Competitive Positioning & Price Tier
Chapter 9. North America Digital Out-of-Home Advertising Market
- 9.1 United States
- 9.2 Canada
- 9.3 Mexico
Chapter 10. Europe Digital Out-of-Home Advertising Market
- 10.1 Germany
- 10.2 France
- 10.3 Italy
- 10.4 United Kingdom
- 10.5 Spain
- 10.6 Poland
- 10.7 Russia
- 10.8 Netherlands
- 10.9 Belgium
- 10.10 Sweden
- 10.11 Denmark
- 10.12 Norway
- 10.13 Rest of Europe
Chapter 11. Asia Pacific Digital Out-of-Home Advertising Market
- 11.1 China
- 11.2 India
- 11.3 Japan
- 11.4 South Korea
- 11.5 Thailand
- 11.6 Indonesia
- 11.7 Vietnam
- 11.8 Malaysia
- 11.9 Australia
- 11.10 Rest of Asia Pacific
Chapter 12. Latin America Digital Out-of-Home Advertising Market
- 12.1 Brazil
- 12.2 Argentina
- 12.3 Colombia
- 12.4 Chile
- 12.5 Rest of Latin America
Chapter 13. Middle East Digital Out-of-Home Advertising Market
- 13.1 Saudi Arabia
- 13.2 United Arab Emirates
- 13.3 Turkey
- 13.4 Israel
- 13.5 Iran
- 13.6 Rest of the Middle East
Chapter 14. Africa Digital Out-of-Home Advertising Market
- 14.1 South Africa
- 14.2 Egypt
- 14.3 Nigeria
- 14.4 Morocco
- 14.5 Rest of Africa
Chapter 15. Digital Out-of-Home Advertising Company Profiles
- 15.1 [Company 01]
- 15.1.1 Company Overview
- 15.1.2 Key Management Personnel
- 15.1.3 Products & Services Portfolio
- 15.1.4 Financial Performance
- 15.1.5 Key Market Focus & Geographic Presence
- 15.1.6 Recent Developments & Strategic Initiatives
Note: The company profile list is preliminary and may change based on research findings, market developments, data availability, and client requirements.
Chapter 16. Appendices
- Appendix A – List of Abbreviations & Acronyms
- Appendix B – Industry Classification Code Reference – Full Series
- Appendix C – Supply, Output & Operating Capacity Data Tables
- Appendix D – End-Use & Demand Base Tables
- Appendix E – Demand, Adoption & Usage Assumptions
- Appendix F – Pricing & Revenue Metric Reference Tables
- Appendix G – Company Operations & Infrastructure Database
- Appendix H – Cross-Border Trade & Activity Data Tables (Where Applicable)
- Appendix I – Regulatory Summary Tables
- Appendix J – Primary Research Participant List (Anonymized)
- Appendix K – Primary Research Questionnaire Framework
- Appendix L – Data Sources & Bibliography
- Appendix M – Market Size Divergence & Source Comparison
Chapter 17. Research Methodology
- 17.1 Research Framework & Philosophy
- 17.2 Secondary Research – Sources, Hierarchy & Data Extraction
- 17.3 Data Modeling – Bottom-Up & Top-Down Market Sizing
- 17.4 Primary Research – Stakeholder Framework, LOI & Sample Sizes
- 17.5 Forecast Methodology – Regression, Scenario & Sensitivity Analysis
- 17.6 Quality Control – Four-Layer Validation Framework
- 17.7 Limitations & Standard Assumptions
- 17.8 Disclaimer
