
Market Overview
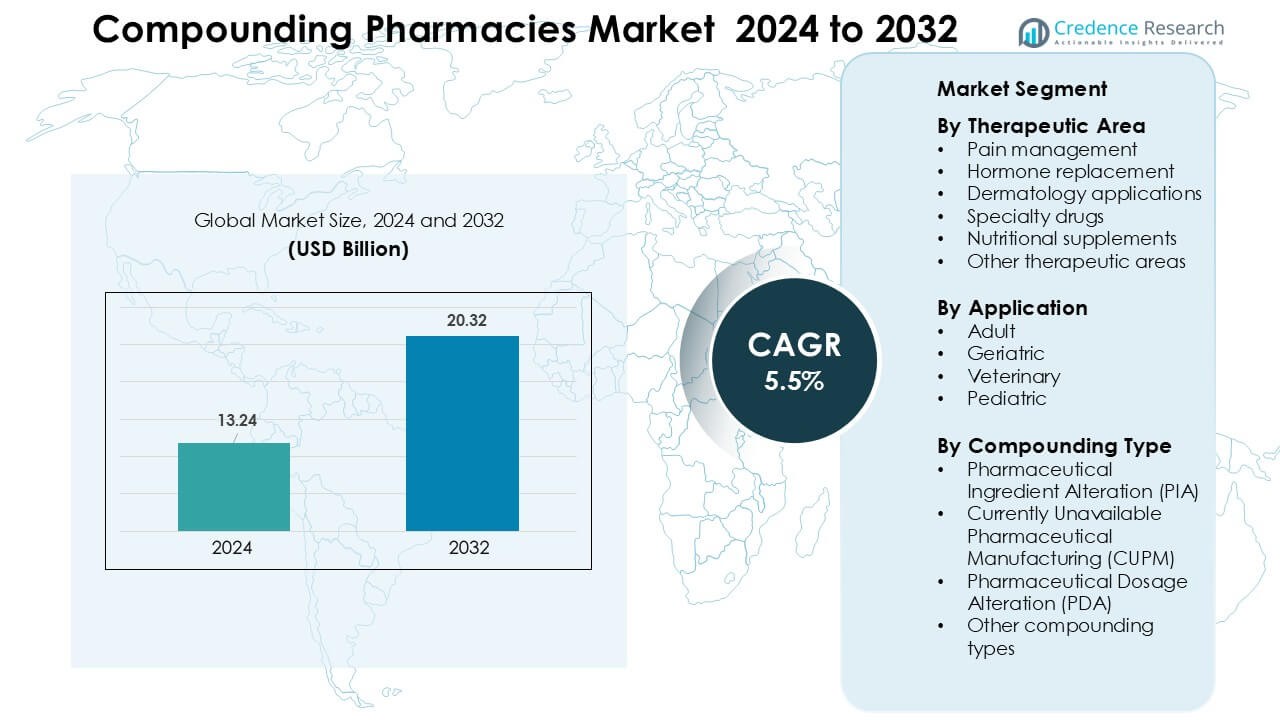
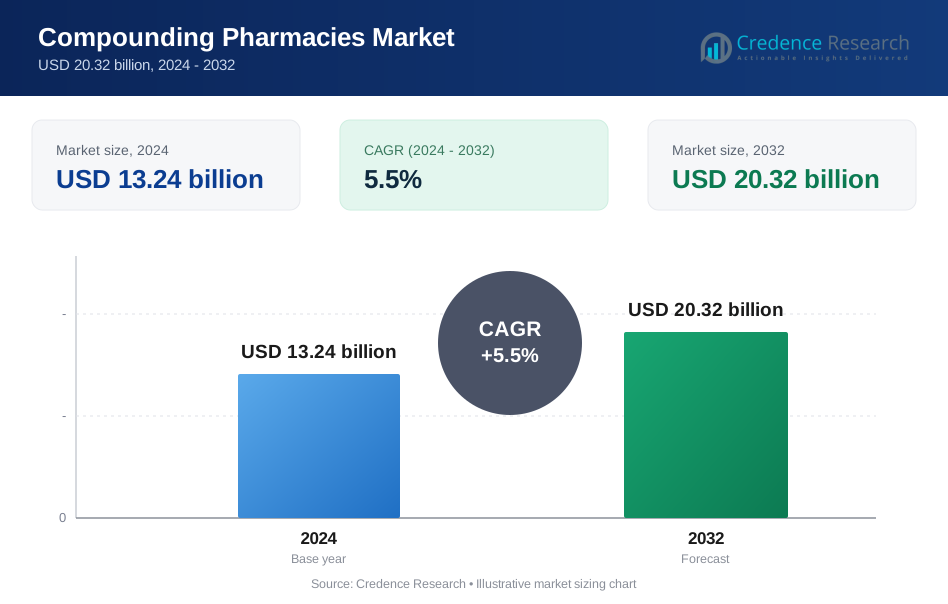
Compounding Pharmacies Market was valued at USD 13.24 billion in 2024 and is anticipated to reach USD 20.32 billion by 2032, growing at a CAGR of 5.5 % during the forecast period.
| REPORT ATTRIBUTE | DETAILS |
|---|---|
| Historical Period | 2020-2023 |
| Base Year | 2024 |
| Forecast Period | 2025-2032 |
| Compounding Pharmacies Market Size 2024 | USD 13.24 Billion |
| Compounding Pharmacies Market, CAGR | 5.5 % |
| Compounding Pharmacies Market Size 2032 | USD 20.32 Billion |
The Compounding Pharmacies Market is shaped by leading players such as Nephron Pharmaceuticals Corporation, Clinigen Group PLC, Lorraine’s Pharmacy, Fagron NV, Institutional Pharmacy Solutions LLC, McGuff Compounding Pharmacy Services, Fresenius Kabi AG, ITC Compounding Pharmacy, B. Braun Melsungen AG, and Dougherty’s Pharmacy Inc. These companies expand sterile and non-sterile capabilities, strengthen regulatory compliance, and invest in personalized therapies across pain management, dermatology, hormone replacement, and pediatrics. North America emerged as the dominant region in 2024 with 41% share, supported by advanced compounding infrastructure, strong adoption of customized medications, and a mature network of 503A and 503B pharmacies.
Market Insights
- The global Compounding Pharmacies Market size reached approximately USD 13.24 billion in 2024 and is projected to grow at a CAGR of 5.5 % through 2032.
- Rising demand for personalized medicine and custom formulations in pain management, hormone therapy, dermatology and pediatrics fuels market growth across all segments.
- Growth trends include increased adoption of sterile outsourcing facilities, rising veterinary compounding demand, and higher use of tailored hormone and dermatology therapies.
- Major firms such as Nephron Pharmaceuticals, Fagron NV, B. Braun Melsungen AG, Fresenius Kabi AG, and others compete by expanding sterile and non-sterile compounding capabilities and by enhancing compliance and quality controls.
- Regulatory compliance burden, stringent quality-control requirements, and variability in compounded formulation standards restrain growth in regions with less mature infrastructure; North America leads the market with ~41 % share, followed by Europe (~28 %) and Asia-Pacific (~22 %).
 Market Segmentation Analysis:
By Therapeutic Area
Pain management led the therapeutic-area segment in 2024 with about 34% share, driven by rising prescriptions for customized analgesic blends used in chronic pain, neuropathic pain, and post-surgical recovery. Demand grew as clinicians sought non-opioid and lower-dose alternatives tailored to patient tolerance levels. Hormone replacement therapies also expanded due to higher use in women’s health and thyroid imbalance cases. Dermatology applications gained traction with personalized creams and gels. Specialty drugs and nutritional supplements advanced steadily, but pain management stayed dominant because physicians depend on flexible strengths and combinations to improve treatment response.
- For instance, PCCA’s Lipoderm ActiveMax™ base demonstrated transdermal delivery rates up to 25% higher for select analgesic APIs during controlled permeation studies, supporting broader use in chronic pain protocols.
By Application
Adult patients dominated the application segment in 2024 with nearly 46% share, supported by wide use of tailored medications for chronic diseases, hormonal imbalance, dermatology conditions, and lifestyle-linked disorders. Adults often require dosage adjustments, allergen-free formulations, and alternative delivery modes that standard products do not offer. Geriatric demand grew as older adults needed customized low-dose or easy-to-swallow formats. Pediatric use increased for flavored liquids and safer strengths, while veterinary compounding expanded through personalized treatments for companion animals. Adults remained the largest group because clinicians prescribe most compounded medications to support long-term disease management.
- For instance, PCCA’s various HRT bases, such as VersaBase Gel, leverage a proprietary polymer network that PCCA states is tested to deliver uniform hormone release and provide consistent results, enabling precise adult dosing when compounded as directed.
By Compounding Type
Pharmaceutical Ingredient Alteration (PIA) accounted for roughly 38% share in 2024, leading the compounding-type segment due to rising demand for allergen-free, preservative-free, and dye-free medications. Clinics relied on PIA to modify base ingredients for patients with intolerance or restricted therapeutic requirements. Pharmaceutical Dosage Alteration (PDA) grew further as pharmacists created adjusted strengths, flavored formats, and alternative dosage forms for adults and children. CUPM solutions rose in relevance as pharmacies filled gaps for discontinued or short-supply drugs. PIA remained dominant because ingredient modification offers flexibility that supports personalized safety and adherence needs.
Key Growth Drivers
Rising Demand for Personalized Medicine
Personalized medicine has become a major growth engine for the compounding pharmacies market as patients increasingly seek treatment plans tailored to individual needs. Physicians prescribe personalized formulations when standard-dose medications create side effects, offer limited efficacy, or lack suitable delivery modes. Compounding pharmacies address these gaps by adjusting strengths, removing allergens, and creating alternative formats such as gels, suspensions, or troches. Chronic disease cases continue to rise globally, and many patients require individualized therapeutic regimens that commercial drugs cannot meet. This dynamic strengthens demand for personalized medications across dermatology, hormone therapy, pain management, and pediatric care. The shift toward patient-centric healthcare, combined with active physician acceptance of customized therapies, ensures steady market expansion. Compounded medications also play a key role in cases involving drug intolerance or specific ingredient sensitivities. As patient expectations for tailored care grow, personalized medicine remains one of the strongest drivers of market growth.
- For instance, Fagron’s TrichoTest® analyzes 48 genetic variants across seven pathways to guide personalized dermatology and hair-loss formulations with higher treatment precision.
Increasing Shortages of Commercially Manufactured Drugs
Recurring shortages of key pharmaceuticals remain a strong catalyst for the compounding pharmacies market, as healthcare providers rely on customized formulations to fill supply gaps. Many essential medicines including sterile injectables, analgesics, and diabetes drugs face supply disruptions due to manufacturing delays, regulatory actions, or raw-material issues. Compounding pharmacies support hospital systems and clinics by preparing equivalent formulations during such shortages, ensuring uninterrupted treatment. They often step in when discontinued products are required for niche therapeutic needs. The rising frequency of shortages has pushed healthcare facilities to develop long-term partnerships with compounding suppliers to maintain timely access to critical medications. Moreover, specialized outsourcing facilities operating under strict quality standards help deliver high-volume compounded solutions that meet hospital-grade requirements. As global supply chains face periodic instability, compounding pharmacies serve as a vital safety net, strengthening resilience in the pharmaceutical ecosystem and sustaining growth momentum.
Growing Demand for Customized Hormone and Pain Management Therapies
The compounding pharmacies market benefits from a strong surge in demand for customized hormone replacement therapy (HRT) and pain-management solutions. Patients often require individualized hormone levels based on age, gender, and metabolic rate, prompting physicians to prescribe compounded bioidentical hormone therapies tailored to specific physiological needs. Compounded formulations help address menopause, thyroid disorders, and adrenal imbalance more precisely than standardized products. In parallel, chronic pain patients increasingly depend on custom analgesic combinations that reduce opioid exposure while improving symptom control. Compounding pharmacies provide multi-drug formulations, lower-dose alternatives, and transdermal delivery options that enhance patient safety and adherence. These tailored hormone and pain treatments hold special relevance for aging populations, which exhibit higher incidence of endocrine imbalance and chronic pain. With rising awareness of non-standard treatment paths, compounded HRT and pain therapies continue to accelerate market expansion.
Key Trends & Opportunities
Expansion of Sterile and High-Quality Outsourcing Facilities
A major trend reshaping the compounding pharmacies market is the expansion of sterile outsourcing facilities operating under enhanced regulatory standards. Healthcare systems increasingly outsource sterile preparations to 503B outsourcing pharmacies to ensure consistent quality, reduce compounding errors, and maintain supply continuity. These facilities leverage automation, cleanroom technologies, and advanced quality-assurance practices that meet large-scale hospital requirements. The trend creates vast opportunities for providers capable of producing high-volume sterile injectables, ophthalmic solutions, and niche critical-care medications. As hospitals face mounting compliance pressures, they prefer outsourcing partners offering traceability, sterile infrastructure, and reliable production capacity. This shift opens strong business potential for compounding firms that invest in high-grade manufacturing systems. The ongoing expansion of sterile operations signals a long-term opportunity as demand rises for complex, clinical-grade formulations.
- For instance, Industry analysis and articles confirm that advanced technologies, such as robotics, isolator technology, and integrated automation, significantly boost efficiency and production capacity in pharmaceutical manufacturing.
Growing Adoption of Veterinary Compounding and Niche Therapeutic Solutions
Veterinary compounding has emerged as a fast-growing opportunity as pet ownership rises and veterinarians seek customized solutions for species-specific needs. Many animals require unique doses, delivery formats, or flavors that commercial drugs cannot provide. Compounding pharmacies create pet-friendly formulations such as chewables, flavored liquids, and transdermal gels that improve treatment compliance. Beyond veterinary care, niche areas such as dermatology, gastroenterology, and nutritional supplementation offer strong growth potential for compounding specialists. Increasing consumer awareness about personalized therapies for pets and specialized patient groups continues to support this trend. Veterinary compounding, combined with unmet needs in specialty human therapies, provides compounding pharmacies with expanding revenue opportunities across diverse healthcare segments.
- For instance, the American Pet Products Association (APPA) reports over 94 million U.S. households owned a pet as of their 2025 survey, a notable increase from 82 million in 2023, driving increased demand for compounded medications tailored to individual animals.
Rising Integration of Technology in Compounding Operations
Technology adoption is creating new opportunities in compounding pharmacies as systems such as automated dispensing, digital workflow platforms, and electronic prescription transfers strengthen safety and accuracy. Pharmacies increasingly use barcode verification, real-time quality monitoring, and cloud-based documentation to reduce contamination risk and eliminate formulation errors. Digital platforms also streamline physician communication, enabling faster prescription adjustments and improved transparency. Investment in robotic systems and smart labeling expands capacity and enhances productivity for both sterile and non-sterile compounding. As regulatory expectations intensify, technology-driven compounding operations gain strong competitive advantages. This trend unlocks opportunities for pharmacies that modernize operations and establish high-efficiency workflow models.
Key Challenges
Stringent Regulatory Requirements and Compliance Burden
Regulatory requirements pose a significant challenge for compounding pharmacies, as they must meet strict quality, sterility, and documentation standards. Compliance with USP <795>, <797>, and <800> guidelines, along with oversight from national health authorities, creates high operational burdens. Facilities must invest heavily in cleanrooms, air-quality systems, staff training, and continuous environmental monitoring. Regulatory inspections also demand complete traceability for every compounded product, increasing administrative complexity. Non-compliance can result in penalties, recalls, or shutdowns, creating financial risk. Smaller independent pharmacies struggle most with these heightened expectations, leading many to limit operations or shift to non-sterile compounding. As regulations evolve, pharmacies face ongoing pressure to maintain rigorous systems, making compliance a core barrier to market growth.
Quality-Control Risks and Variability in Formulations
Ensuring consistent quality across customized formulations remains a key challenge for compounding pharmacies. Since compounded medications lack standardized manufacturing processes, formulation variability may occur due to differences in raw materials, equipment accuracy, or operator experience. Errors in dosing, stability, or sterility can jeopardize patient safety and lead to adverse events. Maintaining stable shelf-life and reliable bioavailability also proves difficult for certain complex therapies. Compounding errors have previously triggered regulatory action and raised concerns among healthcare providers. These risks force pharmacies to adopt strict validation protocols, advanced testing, and continuous monitoring-factors that increase operational cost and complexity. Addressing quality-control variability remains essential for building trust and strengthening market credibility.
Regional Analysis
North America
North America held the largest share of the compounding pharmacies market in 2024 with about 41%, driven by strong demand for personalized medicine, advanced compounding infrastructure, and wide adoption of bioidentical hormone therapies. The region benefits from a mature network of 503A and 503B pharmacies that support both individualized and large-volume sterile preparations. Growth strengthened as physicians increasingly prescribed custom analgesics, dermatology blends, and allergen-free formulations. Rising chronic disease cases, drug shortages, and supportive reimbursement trends further expanded service demand. Strong regulatory oversight also encouraged investment in high-quality sterile compounding facilities.
Europe
Europe accounted for around 28% of the market in 2024, supported by a well-established pharmacy compounding tradition and strong demand for customized dermatology, hormone replacement, and pediatric formulations. Countries such as Germany, France, and the Netherlands operate structured compounding frameworks that ensure product safety and uniform dispensing practices. Growing adoption of personalized therapies for aging populations, along with increased use of preservative-free and dose-adjusted solutions, strengthened market growth. Hospitals also relied on compounded preparations during recurring drug shortages. Expansion of clinical compounding services and rising preference for tailored therapies continued to support steady regional demand.
Asia-Pacific
Asia-Pacific reached nearly 22% share in 2024, emerging as the fastest-growing region due to rising chronic disease incidence, expanding healthcare spending, and increasing awareness of personalized treatments. Demand grew across Australia, Japan, India, and South Korea as patients sought customized hormone therapies, dermatology formulations, and pediatric solutions unavailable in standard formats. Drug shortages in several markets also pushed hospitals to rely on compounded preparations. Investments in training, sterile infrastructure, and digital pharmacy platforms supported market expansion. Growing pet ownership further boosted veterinary compounding. The region’s large population base and improving healthcare access will continue to accelerate long-term growth.
Latin America
Latin America captured roughly 6% of the market in 2024, driven by rising adoption of customized therapies in Brazil, Mexico, and Argentina. Regional growth accelerated as physicians prescribed compounded solutions for dermatology, hormone imbalance, fertility, and pain management. Increasing middle-class healthcare spending and higher demand for alternative dosage forms supported the sector. Pharmacies expanded capabilities in allergen-free and preservative-free formulations to serve sensitivity-prone patients. Although regulatory variability remains a challenge, ongoing improvements in compounding standards and expanding clinical awareness contributed to steady demand across major urban centers.
Middle East & Africa
The Middle East & Africa region held about 3% share in 2024, with demand primarily concentrated in the UAE, Saudi Arabia, and South Africa. Growth stemmed from rising chronic disease prevalence, expanding private healthcare networks, and increasing acceptance of customized dermatology and hormone therapies. Hospitals and clinics relied on compounded products to address shortages of specialty and pediatric drugs. Investment in modern pharmacy infrastructure and rising awareness of personalized treatments improved market penetration. However, limited regulatory harmonization and uneven access to trained compounding professionals restricted broader expansion across developing markets.
Market Segmentations:
By Therapeutic Area
- Pain management
- Hormone replacement
- Dermatology applications
- Specialty drugs
- Nutritional supplements
- Other therapeutic areas
By Application
- Adult
- Geriatric
- Veterinary
- Pediatric
By Compounding Type
- Pharmaceutical Ingredient Alteration (PIA)
- Currently Unavailable Pharmaceutical Manufacturing (CUPM)
- Pharmaceutical Dosage Alteration (PDA)
- Other compounding types
By Geography
- North America
- U.S.
- Canada
- Mexico
- Europe
- Germany
- France
- U.K.
- Italy
- Spain
- Rest of Europe
- Asia Pacific
- China
- Japan
- India
- South Korea
- South-east Asia
- Rest of Asia Pacific
- Latin America
- Brazil
- Argentina
- Rest of Latin America
- Middle East & Africa
- GCC Countries
- South Africa
- Rest of the Middle East and Africa
Competitive Landscape
The Compounding Pharmacies Market features strong competition among major players such as Nephron Pharmaceuticals Corporation, Clinigen Group PLC, Lorraine’s Pharmacy, Fagron NV, Institutional Pharmacy Solutions LLC, McGuff Compounding Pharmacy Services, Fresenius Kabi AG, ITC Compounding Pharmacy, B. Braun Melsungen AG, and Dougherty’s Pharmacy Inc. These companies compete by expanding sterile and non-sterile compounding capabilities, enhancing cleanroom infrastructure, and strengthening compliance with USP <795>, <797>, and <800> standards. Market leaders focus on broad therapeutic coverage across pain management, hormone therapy, dermatology, pediatrics, and veterinary care. Several players invest in 503B outsourcing facilities to supply high-volume sterile injectables to hospitals facing shortages. Technology integration, including automated compounding systems, digital prescription workflows, and advanced quality-control tools, further shapes competitive performance. Strategic partnerships with healthcare networks, physician groups, and specialty clinics support market positioning. Continuous innovation in personalized formulations and safety standards remains central to competitive success.
Key Player Analysis
- Nephron Pharmaceuticals Corporation
- Clinigen Group PLC
- Lorraine’s Pharmacy
- Fagron NV
- Institutional Pharmacy Solutions, LLC
- McGuff Compounding Pharmacy Services
- Fresenius Kabi AG
- ITC Compounding Pharmacy
- B. Braun Melsungen AG
- Dougherty's Pharmacy, Inc.
Recent Developments
- In June 2025, Clinigen Group PLC announced securing rights for six medac therapies to expand patient access to specialist medicines (strategic expansion in specialty/compounded/managed-access space).
- In January 2025, Clinigen Group PLC formed a partnership with Santhera Pharmaceuticals to expand access to a treatment for Duchenne muscular dystrophy (clinical access / specialty medicines activity).
Report Coverage
The research report offers an in-depth analysis based on Therapeutic Area, Application, Compounding Type and Geography. It details leading market players, providing an overview of their business, product offerings, investments, revenue streams, and key applications. Additionally, the report includes insights into the competitive environment, SWOT analysis, current market trends, as well as the primary drivers and constraints. Furthermore, it discusses various factors that have driven market expansion in recent years. The report also explores market dynamics, regulatory scenarios, and technological advancements that are shaping the industry. It assesses the impact of external factors and global economic changes on market growth. Lastly, it provides strategic recommendations for new entrants and established companies to navigate the complexities of the market.
Future Outlook
- The market will expand as demand grows for personalized therapies across major therapeutic areas.
- Sterile outsourcing facilities will gain stronger adoption among hospitals and large clinics.
- Technology-driven compounding systems will improve accuracy, safety, and workflow efficiency.
- Bioidentical hormone therapy will remain a major growth catalyst in aging populations.
- Veterinary compounding will rise as pet health spending and species-specific needs increase.
- Drug shortages will continue to boost reliance on compounded alternatives in critical care.
- Regulatory frameworks will tighten, pushing pharmacies to invest more in quality systems.
- Digital prescription platforms and telehealth integration will expand patient access to custom medications.
- Pediatric and geriatric dose-flexible formulations will see stronger adoption in clinical settings.
- Market competition will intensify as leading players invest in sterile infrastructure, automation, and broader therapeutic portfolios.
Request a Free Sample
Fill in your details and we'll send you a free sample report.
- Sample data tables & charts
- Research methodology
Need a Custom Version of This Report?
Tailor the scope, geography, or segments to your exact requirements.
- Custom geography or segment scope
- Direct access to our analyst team
Frequently Asked Questions
What is the current market size for Compounding Pharmacies Market, and what is its projected size in 2032?
At what Compound Annual Growth Rate is Compounding Pharmacies Market projected to grow between 2024 and 2032?
Which Compounding Pharmacies Market segment held the largest share in 2024?
What are the primary factors fueling the growth of Compounding Pharmacies Market?
Who are the leading companies in Compounding Pharmacies Market?
Which region commanded the largest share of Compounding Pharmacies Market?
Table of Content
Chapter 1. Report Introduction
- 1.1 Report Description & Purpose
- 1.1.1 Report Title & Market Definition
- 1.1.2 Unique Selling Propositions (USP) & Key Differentiators
- 1.1.3 Value Proposition for Stakeholders
- 1.2 Research Objectives
- 1.2.1 Market Sizing Objectives (Volume & Revenue) (Volume Where Applicable)
- 1.2.2 Segmentation Objectives
- 1.2.3 Competitive Intelligence Objectives
- 1.2.4 Forecast & Scenario Objectives
- 1.3 Report Scope
- 1.3.1 Compounding Pharmacies Scope – Segments & Subsegments Covered
- 1.3.2 Geographic Scope – Regions & Countries Covered
- 1.3.3 Historical Period, Base Year & Forecast Period (2024; forecast to 2032)
- 1.3.4 Inclusions & Exclusions
- 1.4 Industry Classification & Applicable Codes
- 1.5 Currency, Measurement Units & Valuation Basis
- 1.6 Target Stakeholders
- 1.7 Limitations & Assumptions
Chapter 2. Executive Summary
- 2.1 Global Compounding Pharmacies Market Snapshot
- 2.1.1 Market Size – Historical (2024) & Forecast (2024-2032) (2024: USD 13.24 billion → 2032: USD 20.32 billion)
- 2.1.2 Volume & Revenue – Global Totals (Volume Where Applicable)
- 2.1.3 Key Market Highlights – Top Five Facts
- 2.2 Compounding Pharmacies Market Segmentation Snapshot
- 2.2.1 Market Split by Region – 2024 vs. 2032
- 2.3 Competitive Snapshot
- 2.3.1 Top 10 Players by Revenue Share – 2024
- 2.3.2 Top 10 Players by Volume Share – 2024 (Volume Where Applicable)
- 2.3.3 Recent Strategic Developments (18-Month Summary)
- 2.4 Key Investment Highlights & Strategic Conclusions
Chapter 3. Compounding Pharmacies Market Dynamics & Industry Analysis
- 3.1 Market Overview & Context
- 3.1.1 Compounding Pharmacies Market Position in the Broader Industry Value Chain
- 3.1.2 Demand Structure & Purchasing Dynamics
- 3.1.3 Market Maturity & Development Stage by Region
- 3.2 Compounding Pharmacies Market Drivers
- 3.3 Compounding Pharmacies Market Restraints & Challenges
- 3.4 Compounding Pharmacies Market Opportunities
- 3.5 Porter's Five Forces Analysis
- 3.5.1 Threat of New Entrants
- 3.5.2 Bargaining Power of Suppliers
- 3.5.3 Bargaining Power of Buyers
- 3.5.4 Threat of Substitutes
- 3.5.5 Competitive Rivalry – Intensity Assessment
- 3.6 Compounding Pharmacies Value Chain Analysis
- 3.6.1 Upstream – Key Inputs, Resources & Suppliers
- 3.6.1.1 Key Input/Resource 1
- 3.6.1.2 Key Input/Resource 2
- 3.6.1.3 Key Input/Resource 3
- 3.6.2 Midstream – Core Operations & Value Creation
- 3.6.2.1 Operating Model & Process Overview
- 3.6.2.2 Key Operating Locations & Capabilities by Company
- 3.6.3 Downstream – Market Channels & End Users
- 3.6.3.1 Direct Sales & Customer Engagement Channels
- 3.6.3.2 Indirect Sales, Intermediaries & Partner Channels
- 3.6.4 Value Chain Profitability Analysis
- 3.6.1 Upstream – Key Inputs, Resources & Suppliers
- 3.7 PESTEL Analysis
- 3.7.1 Political Factors
- 3.7.2 Economic Factors
- 3.7.3 Social Factors
- 3.7.4 Technological Factors
- 3.7.5 Environmental Factors
- 3.7.6 Legal Factors
- 3.8 Compounding Pharmacies Supply Chain Analysis
- 3.8.1 Critical Input & Resource Availability Risk Assessment
- 3.8.2 Supplier & Operational Concentration Risk (Geographic Exposure)
- 3.8.3 Supply & Service Disruption Impact Analysis
- 3.9 Regulatory & Policy Landscape
Note: The regulatory and policy landscape section covers regulations based on their applicability to the market, Compounding Pharmacies category, geography, and scope of the study. Only regulatory frameworks with a material impact on operations, compliance, trade, sustainability, or market access are analyzed in detail.
Chapter 4. Key Investment Pockets & Opportunity Analysis
- 4.1 Compounding Pharmacies Market Attractiveness Analysis
- 4.1.1 By Region – Investment Attractiveness Matrix (Market Size × CAGR)
- 4.2 Absolute Revenue Growth Opportunity
- 4.2.1 By Region – Absolute Revenue Growth Through 2032
- 4.3 Incremental Demand Opportunity
- 4.3.1 By Region – Incremental Demand Through 2032
- 4.3.2 Segment – Incremental Demand
- 4.4 Emerging Submarket Opportunity Deep Dive (Subject to Applicability)
- 4.5 Priority Market Opportunity Scorecards
- 4.5.1 United States
- 4.5.2 Europe
- 4.5.3 Asia
- 4.5.4 Middle East & Africa
Note: Priority market opportunity scorecards reflect the geographic scope and strategic relevance of the study. Listed markets are indicative and may be adapted to the industry.
Chapter 5. Compounding Pharmacies Cross-Border Trade & Market Access Analysis
- 5.1 International Trade & Cross-Border Activity Overview
- 5.1.1 Global Export Value by Country (2024)
- 5.1.2 Global Export Volume by Country (2024) (Volume Where Applicable)
- 5.1.3 Global Import Value by Country (2024)
- 5.1.4 Global Import Volume by Country (2024) (Volume Where Applicable)
- 5.1.5 Net Trade Balance by Country (2024)
- 5.2 Export Analysis – Segment
- 5.2.1 Category 1 (Applicable Classification Code)
- 5.2.2 Category 2 (Applicable Classification Code)
- 5.2.3 Category 3 (Applicable Classification Code)
- 5.2.4 Category 4 (Applicable Classification Code)
- 5.2.5 Category 5 (Applicable Classification Code)
- 5.3 Import Analysis – Segment
- 5.3.1 Category 1 (Applicable Classification Code)
- 5.3.2 Category 2 (Applicable Classification Code)
- 5.3.3 Category 3 (Applicable Classification Code)
- 5.3.4 Category 4 (Applicable Classification Code)
- 5.3.5 Category 5 (Applicable Classification Code)
- 5.4 Cross-Border Pricing & Transaction Benchmarks
- 5.4.1 Export Pricing – Segment & Country
- 5.4.2 Import Pricing – Segment & Source Country
- 5.4.3 Price Trends (2024)
- 5.5 Key Cross-Border Trade & Delivery Routes
- 5.5.1 Cross-Border Trade/Delivery Route 1
- 5.5.2 Cross-Border Trade/Delivery Route 2
- 5.5.3 Cross-Border Trade/Delivery Route 3
- 5.5.4 Cross-Border Trade/Delivery Route 4
- 5.5.5 Cross-Border Trade/Delivery Route 5
- 5.6 Trade Policy & Market Access Impact Assessment
- 5.6.1 Tariff & Non-Tariff Barriers
- 5.6.2 Regional Trade & Economic Integration Frameworks
- 5.6.3 Bilateral & Multilateral Trade Agreements
- 5.6.4 Cross-Border Operating, Licensing & Localization Requirements
Note: This chapter applies where cross-border trade or delivery is relevant to Compounding Pharmacies. Goods, services, and digital offerings are assessed using applicable classifications and transaction measures. Import-export volumes, trade balances, and route analyses are included only where meaningful to the market.
Chapter 6. Competitive Landscape & Company Benchmarking
- 6.1 Compounding Pharmacies Market Concentration & Structure
- 6.1.1 Herfindahl-Hirschman Index (HHI) – vs. 2024
- 6.1.2 Leading, Mid-Sized & Emerging Player Structure
- 6.1.3 Global, Regional & Local Player Dynamics
- 6.2 Compounding Pharmacies Market Share Analysis – 2024
- 6.2.1 Global Revenue Share by Company
- 6.2.2 Global Volume Share by Company (Volume Where Applicable)
- 6.2.3 Regional Revenue Share
- 6.2.4 Market Share Evolution ( vs. 2024)
- 6.2.5 Company Market Share by Key Segment
- 6.2.6 Company Market Share by Customer Group
- 6.3 Operating Scale, Capacity & Infrastructure Analysis
- 6.3.1 Global Operating Scale & Supply Capacity
- 6.3.2 Resource Utilization & Operating Efficiency
- 6.3.3 Output, Service Delivery & Activity Metrics
- 6.3.4 Operating Footprint & Infrastructure Map
- 6.3.5 Planned Operational & Capacity Expansion
- 6.4 Compounding Pharmacies Competitive Benchmarking Matrix
- 6.4.1 Revenue, Growth, Profitability & Operating Metric Comparison
- 6.4.2 Channel Revenue Mix
- 6.4.3 Geographic Revenue Exposure
- 6.4.4 R&D Intensity
- 6.4.5 Sustainability Maturity
- 6.5 Strategic Developments in Compounding Pharmacies (Last 24 Months)
- 6.5.1 Mergers, Acquisitions & Divestments
- 6.5.2 New Products, Services & Solutions in Compounding Pharmacies
- 6.5.3 Operational & Infrastructure Expansions
- 6.5.4 Strategic Alliances, Joint Ventures & Partnerships
- 6.5.5 Distribution Expansion & Market Entry
- 6.5.6 Sustainability & ESG Initiatives
- 6.6 Competitive Strategy Mapping
- 6.6.1 Leader, Challenger, Follower & Niche Classification
- 6.6.2 Pricing Strategy Comparison
- 6.6.3 Channel Strategy Matrix
Note: Strategic developments are included based on their materiality and the availability of reliable information.
Chapter 7. Global Compounding Pharmacies Market – By Sales & Delivery Channel
- 7.1 Segment Overview
- 7.1.1 Volume & Revenue Split by Channel (2024 & 2032) (Volume Where Applicable)
- 7.1.2 Channel Mix Evolution (2024-2032)
Chapter 8. Regional Market Analysis – Global Overview
- 8.1 Global Regional Overview
- 8.1.1 Regional Volume Share (Volume Where Applicable)
- 8.1.2 Regional Revenue Share
- 8.1.3 Regional Volume by Region (Volume Where Applicable)
- 8.1.4 Regional Revenue by Region
- 8.1.5 Regional Forecast Through 2032
- 8.2 Cross-Regional Segment Analysis
- 8.2.1 By Sales & Delivery Channel
- 8.2.2 By Competitive Positioning & Price Tier
Chapter 9. North America Compounding Pharmacies Market
- 9.1 United States
- 9.2 Canada
- 9.3 Mexico
Chapter 10. Europe Compounding Pharmacies Market
- 10.1 Germany
- 10.2 France
- 10.3 Italy
- 10.4 United Kingdom
- 10.5 Spain
- 10.6 Poland
- 10.7 Russia
- 10.8 Netherlands
- 10.9 Belgium
- 10.10 Sweden
- 10.11 Denmark
- 10.12 Norway
- 10.13 Rest of Europe
Chapter 11. Asia Pacific Compounding Pharmacies Market
- 11.1 China
- 11.2 India
- 11.3 Japan
- 11.4 South Korea
- 11.5 Thailand
- 11.6 Indonesia
- 11.7 Vietnam
- 11.8 Malaysia
- 11.9 Australia
- 11.10 Rest of Asia Pacific
Chapter 12. Latin America Compounding Pharmacies Market
- 12.1 Brazil
- 12.2 Argentina
- 12.3 Colombia
- 12.4 Chile
- 12.5 Rest of Latin America
Chapter 13. Middle East Compounding Pharmacies Market
- 13.1 Saudi Arabia
- 13.2 United Arab Emirates
- 13.3 Turkey
- 13.4 Israel
- 13.5 Iran
- 13.6 Rest of the Middle East
Chapter 14. Africa Compounding Pharmacies Market
- 14.1 South Africa
- 14.2 Egypt
- 14.3 Nigeria
- 14.4 Morocco
- 14.5 Rest of Africa
Chapter 15. Compounding Pharmacies Company Profiles
- 15.1 [Company 01]
- 15.1.1 Company Overview
- 15.1.2 Key Management Personnel
- 15.1.3 Products & Services Portfolio
- 15.1.4 Financial Performance
- 15.1.5 Key Market Focus & Geographic Presence
- 15.1.6 Recent Developments & Strategic Initiatives
Note: The company profile list is preliminary and may change based on research findings, market developments, data availability, and client requirements.
Chapter 16. Appendices
- Appendix A – List of Abbreviations & Acronyms
- Appendix B – Industry Classification Code Reference – Full Series
- Appendix C – Supply, Output & Operating Capacity Data Tables
- Appendix D – End-Use & Demand Base Tables
- Appendix E – Demand, Adoption & Usage Assumptions
- Appendix F – Pricing & Revenue Metric Reference Tables
- Appendix G – Company Operations & Infrastructure Database
- Appendix H – Cross-Border Trade & Activity Data Tables (Where Applicable)
- Appendix I – Regulatory Summary Tables
- Appendix J – Primary Research Participant List (Anonymized)
- Appendix K – Primary Research Questionnaire Framework
- Appendix L – Data Sources & Bibliography
- Appendix M – Market Size Divergence & Source Comparison
Chapter 17. Research Methodology
- 17.1 Research Framework & Philosophy
- 17.2 Secondary Research – Sources, Hierarchy & Data Extraction
- 17.3 Data Modeling – Bottom-Up & Top-Down Market Sizing
- 17.4 Primary Research – Stakeholder Framework, LOI & Sample Sizes
- 17.5 Forecast Methodology – Regression, Scenario & Sensitivity Analysis
- 17.6 Quality Control – Four-Layer Validation Framework
- 17.7 Limitations & Standard Assumptions
- 17.8 Disclaimer
