Market Overview:
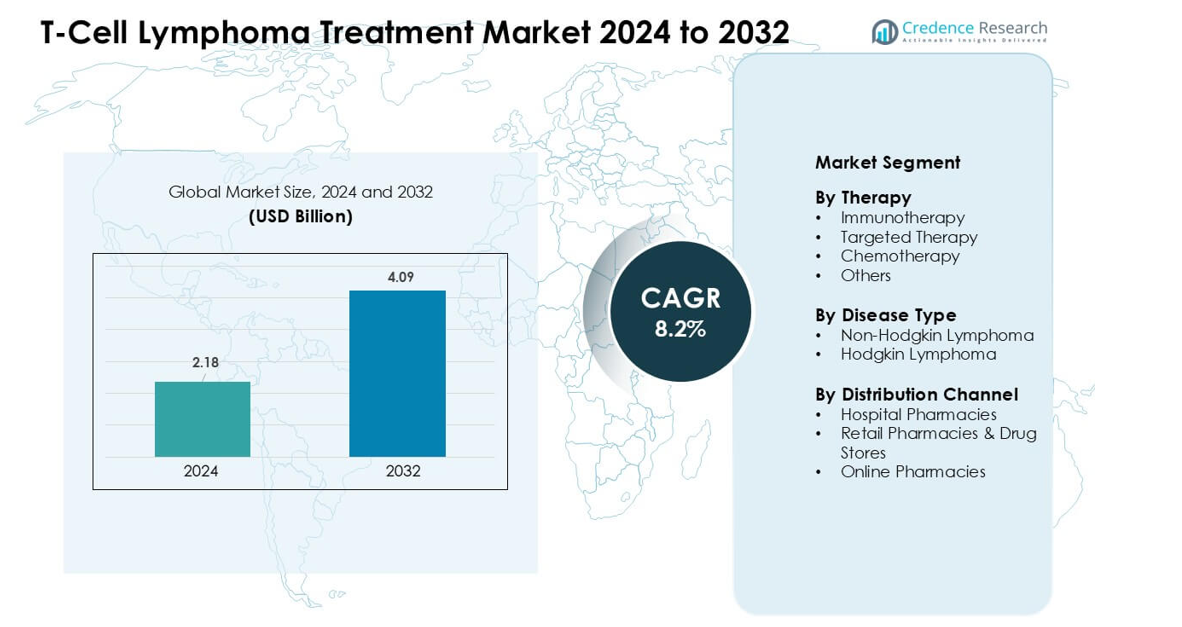
T-Cell Lymphoma Treatment Market was valued at USD 2.18 billion in 2024 and is anticipated to reach USD 4.09 billion by 2032, growing at a CAGR of 8.2 % during the forecast period.
| REPORT ATTRIBUTE |
DETAILS |
| Historical Period |
2020-2023 |
| Base Year |
2024 |
| Forecast Period |
2025-2032 |
| T-Cell Lymphoma Treatment Market Size 2024 |
USD 2.18 billion |
| T-Cell Lymphoma Treatment Market , CAGR |
8.2% |
| T-Cell Lymphoma Treatment Market Size 2032 |
USD 4.09 billion |
The T-Cell Lymphoma Treatment Market includes major companies such as Genentech, Teva Pharmaceutical Industries, Kite Pharma/Gilead Sciences, Bristol Myers Squibb, Novartis, Spectrum Pharmaceuticals, AstraZeneca, Bayer, Janssen Pharmaceuticals, and Takeda Pharmaceutical Company Limited. These firms advanced their positions through strong portfolios in immunotherapy, targeted drugs, and emerging cell-based treatments. North America led the global market in 2024 with an estimated 39% share, supported by high diagnosis rates, advanced oncology centers, and broad access to innovative therapies. Strong clinical trial activity and rapid regulatory approvals further reinforced the region’s leadership within this specialized oncology market.
Market Insights:
- The T-Cell Lymphoma Treatment Market reached USD 2.18 in 2024 and is projected to reach USD 4.09 by 2032, growing at a CAGR of 8.2%.
- Rising demand for immunotherapy drove strong adoption, with immunotherapy holding the largest therapy share in 2024 due to wider approvals and higher response rates.
- Key trends included rapid growth of precision medicine, expanding molecular profiling use, and increased clinical activity in CAR-T and next-generation cell therapies.
- Leading players such as Genentech, Kite Pharma/Gilead Sciences, Bristol Myers Squibb, Novartis, and Takeda strengthened competition through advanced biologics and targeted drugs.
- North America held the highest regional share at 39% in 2024, while Non-Hodgkin lymphoma led the disease segment with a dominant share supported by large patient pools and wider diagnostic coverage.
Access crucial information at unmatched prices!
Request your sample report today & start making informed decisions powered by Credence Research Inc.!
Download Sample
Market Segmentation Analysis:
By Therapy
Immunotherapy held the largest share in 2024 due to strong adoption of PD-1 inhibitors and CAR-T approaches for aggressive T-cell lymphomas. Clinicians favored these options because response rates improved in relapsed cases and reduced toxicity supported better patient outcomes. Targeted therapy also grew as firms expanded kinase-inhibitor use across peripheral T-cell subtypes. Chemotherapy continued to serve as a base regimen for early-line treatment, while the others category supported niche cases requiring combination protocols or palliative regimens. Strong trial activity and wider regulatory approvals kept immunotherapy in the lead.
- For instance, in a recent study of a novel TRBC1‑directed CAR‑T therapy for peripheral T‑cell lymphoma, treatment yielded an overall response rate of 66.6% (6 of 9 evaluable patients) and among responders, four achieved a complete metabolic response (CMR), demonstrating feasibility of CAR‑T for T‑cell NHL.
By Disease Type
Non-Hodgkin lymphoma dominated the segment in 2024 with a major share driven by the high prevalence of peripheral T-cell lymphoma and cutaneous T-cell lymphoma. Treatment needs increased as more patients required advanced systemic options and faster diagnosis improved referral rates to specialty centers. Hodgkin lymphoma held a smaller share because T-cell forms remained less common and required fewer targeted protocols. Growth in the dominant segment stayed supported by wider biomarker testing, stronger therapy pipelines, and improved access to specialized oncology care.
- For instance, according to large registry data from the global International PTCL Project, among all T‑cell lymphomas within NHL, the subtype PTCL-NOS accounted for about 25.9% of T‑cell NHL cases, while Angioimmunoblastic T-cell lymphoma (AITL) made up about 18.5% and Anaplastic large cell lymphoma (ALCL) around 12.0%.
By Distribution Channel
Hospital pharmacies led the distribution landscape in 2024 with the highest share because complex T-cell lymphoma therapies required supervised administration and close monitoring. Large oncology centers dispensed most immunotherapy and targeted agents due to strict handling needs and reimbursement support. Retail pharmacies and drug stores captured moderate demand for oral follow-up therapies and supportive care drugs. Online pharmacies grew at a steady pace as digital fulfillment improved, but strict storage rules and therapy complexity kept hospital pharmacies in the leading position.
Key Growth Drivers:
Rising Adoption of Advanced Immunotherapies
Growth accelerated as oncologists shifted toward immunotherapies that improved survival in aggressive T-cell lymphoma cases. Wider clinical use of PD-1 inhibitors, antibody–drug conjugates, and CAR-T candidates expanded treatment options for relapsed and refractory patients. Regulatory agencies approved more targeted immunotherapy indications, which increased accessibility across major cancer centers. Strong evidence from global trials supported higher uptake, especially where chemotherapy resistance remained common. Hospitals strengthened infusion infrastructure, allowing faster adoption of combination regimens and real-time monitoring protocols. Investment in next-generation immune-modulating drugs continued to rise, enabling broader application across multiple T-cell lymphoma subtypes. These advancements positioned immunotherapy as a key growth engine.
- For instance, in a multicenter phase 1/2 trial of a novel TRBC1‑directed CAR‑T therapy in relapsed/refractory peripheral T‑cell lymphoma (PTCL), 4 of 10 evaluable patients achieved a complete metabolic response; two of them maintained remission beyond one year, demonstrating durable efficacy in a heavily pretreated cohort.
Growing Prevalence and Earlier Diagnosis of Peripheral T-Cell Lymphoma
Higher global prevalence of peripheral T-cell lymphoma and cutaneous T-cell lymphoma increased treatment demand. More screening programs and improved pathology techniques helped clinicians diagnose cases at earlier stages, which raised the need for advanced therapies. Expanded access to molecular testing improved subtype classification and guided therapy selection more accurately. Specialized cancer centers adopted robust referral networks, reducing diagnosis delays and increasing patient enrollment in structured treatment pathways. Health systems also invested in awareness campaigns that improved public knowledge and encouraged earlier medical consultation. With earlier identification and wider treatment availability, therapy volumes increased steadily across hospitals and oncology clinics.
- For instance, a population‑based registry study from Beijing (2007–2018) identified 801 new cases of T‑cell lymphoma over that interval; of these, 37.45% were classified as PTCL‑NOS, 20.35% as angioimmunoblastic T‑cell lymphoma (AITL), 17.60% as NK/T-cell lymphoma, and 10.24% as anaplastic large cell lymphoma (ALCL), reflecting improved subtype classification in registry data.
Strong R&D Investments and Expanding Clinical Pipeline
Pharmaceutical companies increased R&D spending to address unmet clinical needs in T-cell lymphoma. A growing pipeline of targeted inhibitors, combination protocols, and next-generation biologics supported strong innovation. Multiple late-stage trials tested novel pathways, such as JAK/STAT and PI3K inhibition, which created future commercialization opportunities. Collaboration between biotech firms and research institutes accelerated drug discovery and supported faster translational studies. Regulatory agencies granted priority reviews to several candidates due to the rarity and severity of the disease. Rising venture capital funding for lymphoma-focused biotech firms strengthened development momentum. These continuous advancements created a strong foundation for long-term growth.
Key Trends & Opportunities:
Advances in Precision Medicine and Molecular Profiling
Precision medicine grew as oncologists relied more on genomic profiling to guide therapy decisions. Labs expanded next-generation sequencing services that identified mutations linked to T-cell lymphoma progression. This information helped clinicians match patients to targeted inhibitors with higher therapeutic value. Pharmaceutical developers also focused on biomarker-specific trials, which increased demand for tailored treatments. Hospitals invested in digital diagnostic tools that improved turnaround time and supported real-time treatment adjustments. As personalized oncology matured, opportunities increased for drug developers offering mutation-driven solutions and companion diagnostics across global markets.
- For instance, a real‑world study conducted between 2021 and 2023 on patients with confirmed T‑cell lymphomas found that 94% of patients (out of 93) had at least one genetic variant detected via next‑generation sequencing (NGS), and 71% (n = 70) had at least one pathogenic or likely pathogenic variant.
Expansion of CAR-T and Next-Generation Cell-Based Therapies
Growing interest in CAR-T cell therapy created new opportunities in the market. Research groups designed T-cell-focused CAR constructs with improved durability and safety profiles. Manufacturing platforms became more efficient, reducing production timelines and enabling wider patient access. Clinicians evaluated new allogeneic cell therapies that promised lower cost and faster availability. These programs attracted significant investment from global biotech firms, fueling rapid innovation. Hospitals also prepared cell-therapy units with enhanced handling systems and trained staff, strengthening future adoption. These advances positioned cellular therapies as a major opportunity for long-term market expansion.
- For instance, recent advances in CAR‑T manufacturing have trimmed the “vein‑to‑vein” time (from cell collection to infusion) substantially: newer rapid manufacturing platforms have reduced production time from the traditional 3–5 weeks down to under 10 days in some centers.
Key Challenges:
High Treatment Costs and Limited Accessibility
T-cell lymphoma therapies remained expensive due to complex manufacturing, limited supply chains, and intensive clinical supervision. Many patients faced restricted access in low-income regions where reimbursement programs and oncology infrastructure stayed underdeveloped. Hospitals struggled with budget constraints for immunotherapies and advanced cell-based options. Even in developed markets, cost-sharing burdens slowed adoption among certain patient groups. Manufacturers faced pressure to justify pricing through survival benefits and quality-of-life improvements. This challenge continued to limit equitable access across global markets despite rising treatment innovation.
Shortage of Specialized Oncologists and Diagnostic Capacity
Growth faced constraints due to shortages of hematologists, trained oncology nurses, and advanced diagnostic laboratories. Accurate diagnosis required expert pathology and molecular testing, which remained uneven across several regions. Limited access to specialty centers delayed treatment initiation and reduced adherence to proper care pathways. Many clinics struggled with outdated equipment that slowed subtype identification and treatment planning. The shortage of qualified staff also affected the safe handling of immunotherapies and cell-based treatments. These gaps created care disparities and restricted the full adoption of emerging therapies across global markets.
Regional Analysis:
North America – ~39% Market Share (2024)
North America held the largest share of about 39% in 2024 due to strong use of immunotherapies and advanced targeted drugs across major cancer centers. High diagnosis rates, strong oncology infrastructure, and solid reimbursement support boosted treatment access. The United States stayed ahead because of dense clinical trial activity and fast uptake of next-generation biologics. Canada followed similar trends with growing precision-medicine use and wider pathology coverage. Early screening and strong investment from key drug makers kept the region in a leading position.
Europe – ~31% Market Share (2024)
Europe captured around 31% of the market in 2024, supported by strong clinical guidelines, high specialist density, and easy access to molecular testing. Germany, the U.K., France, and Italy boosted targeted-therapy adoption through structured reimbursement and national cancer programs. Research networks expanded trials for biologics and combination regimens, improving treatment availability. Central and Nordic countries invested in advanced labs that improved early subtype detection. Rising peripheral T-cell lymphoma cases and wide access to tertiary cancer centers helped maintain the region’s strong share.
Asia Pacific – ~22% Market Share (2024)
Asia Pacific held nearly 22% of the market in 2024, supported by rising cancer awareness and growing oncology infrastructure. China and Japan drove most demand with strong hospital networks, active clinical trials, and wider immunotherapy approvals. India and South Korea recorded steady uptake as molecular tests became more affordable and referral systems improved. Large patient numbers and rising T-cell lymphoma prevalence increased therapy volumes. Growing investment from domestic and global drug makers positioned the region as a fast-growing market.
Latin America – ~5% Market Share (2024)
Latin America accounted for about 5% of the market in 2024, shaped by uneven treatment access and variable diagnostic capacity. Brazil and Mexico led growth through expanding oncology centers and improved availability of immunotherapy in public and private programs. Limited reimbursement slowed uptake of high-cost biologics and cell-based therapies. Pathology delays and a shortage of specialists reduced early diagnosis rates. Even with these challenges, rising awareness and gradual healthcare investment supported steady expansion.
Middle East & Africa – ~3% Market Share (2024)
The Middle East & Africa held roughly 3% of the market in 2024, with growth limited by restricted access to advanced lymphoma therapies and weak diagnostic resources. Gulf countries such as the UAE and Saudi Arabia showed stronger adoption due to rising cancer-center capacity and higher healthcare spending. Many African nations faced infrastructure gaps that delayed diagnosis and reduced access to targeted drugs. International partnerships and training programs improved skills, but adoption stayed slow. Growing investment in specialty care supported long-term potential for the region.
Market Segmentations:
By Therapy
- Immunotherapy
- Targeted Therapy
- Chemotherapy
- Others
By Disease Type
- Non-Hodgkin Lymphoma
- Hodgkin Lymphoma
By Distribution Channel
- Hospital Pharmacies
- Retail Pharmacies & Drug Stores
- Online Pharmacies
Geography
- North America
- Europe
- Germany
- France
- U.K.
- Italy
- Spain
- Rest of Europe
- Asia Pacific
- China
- Japan
- India
- South Korea
- South-east Asia
- Rest of Asia Pacific
- Latin America
- Brazil
- Argentina
- Rest of Latin America
- Middle East & Africa
- GCC Countries
- South Africa
- Rest of the Middle East and Africa
Competitive Landscape:
The T-Cell Lymphoma Treatment Market features leading companies such as Genentech, Teva Pharmaceutical Industries, Kite Pharma/Gilead Sciences, Bristol Myers Squibb, Novartis, Spectrum Pharmaceuticals, AstraZeneca, Bayer, Janssen Pharmaceuticals, and Takeda Pharmaceutical Company Limited. These firms strengthened their position by expanding portfolios of immunotherapies, targeted inhibitors, and combination regimens designed for aggressive T-cell lymphoma subtypes. Many leaders advanced clinical pipelines with next-generation biologics and cell-based therapies that addressed high relapse rates and unmet medical needs. Strategic partnerships with research institutes and oncology centers helped accelerate molecular testing adoption and broaden global trial enrollment. Companies also invested in improving supply chains to support rising treatment demand and ensure consistent access across major healthcare markets. As innovation grew, competition intensified around differentiated mechanisms, safety profiles, and long-term survival improvements, shaping a dynamic and evolving landscape.
Shape Your Report to Specific Countries or Regions & Enjoy 30% Off!
Key Player Analysis:
Recent Developments:
- In August 2025, Kite Pharma / Gilead Sciences : Acquisition to expand in-vivo cell therapy capabilities Gilead’s Kite announced (reported by Reuters) a planned acquisition of Interius BioTherapeutics (Aug 2025) to add an in-vivo delivery platform that could simplify CAR-T approaches. This strategic move strengthens Kite/Gilead’s cell-therapy toolkit and has implications for accelerating or lowering the cost of future CAR-T programs potentially including efforts to target T-cell malignancies (though the Interius deal itself was not announced specifically for a PTCL program).
- In July 2025, Genentech (Roche): Regulatory update (sBLA/CRL) for Columvi combination In mid-July 2025 the FDA issued a complete response letter (CRL) for a supplemental application seeking a broader Columvi + chemotherapy indication — an important regulatory development for Genentech’s bispecific portfolio (again, relevant to T-cell-engaging platform growth though focused on B-cell disease). This regulatory action affects how broadly Genentech can commercialize T-cell-engaging bispecifics.
- In May 2025, Genentech (Roche) reported follow-up and program updates on its T-cell-engaging bispecific antibodies (Columvi and mosunetuzumab). These agents are CD3 (T-cell) engagers but are being developed and approved primarily for B-cell non-Hodgkin lymphomas (e.g., diffuse large B-cell lymphoma and follicular lymphoma), so their direct impact on the T-cell lymphoma (PTCL/CTCL) market is limited however, they expand the commercial and clinical footprint of T-cell-engager modalities, which has indirect relevance for the broader immune-engager market
Report Coverage:
The research report offers an in-depth analysis based on Therapy, Disease type, Distribution channel and Geography. It details leading market players, providing an overview of their business, product offerings, investments, revenue streams, and key applications. Additionally, the report includes insights into the competitive environment, SWOT analysis, current market trends, as well as the primary drivers and constraints. Furthermore, it discusses various factors that have driven market expansion in recent years. The report also explores market dynamics, regulatory scenarios, and technological advancements that are shaping the industry. It assesses the impact of external factors and global economic changes on market growth. Lastly, it provides strategic recommendations for new entrants and established companies to navigate the complexities of the market.
Future Outlook:
- Immunotherapy will gain wider use as more indications receive regulatory approval.
- CAR-T and next-generation cell therapies will expand access across major cancer centers.
- Molecular profiling will guide more treatment decisions and improve subtype targeting.
- Combination regimens will grow as studies show better outcomes in refractory cases.
- Hospitals will invest in advanced diagnostic tools to improve early detection.
- Pharmaceutical firms will increase R&D spending on novel biologics and targeted inhibitors.
- Global collaboration will accelerate clinical trial enrollment for rare T-cell subtypes.
- Digital platforms will support improved patient monitoring and treatment planning.
- Emerging markets will adopt advanced therapies as oncology infrastructure expands.
- Pricing reforms and reimbursement expansion will improve access to high-cost treatments.


