| REPORT ATTRIBUTE |
DETAILS |
| Historical Period |
2020-2023 |
| Base Year |
2024 |
| Forecast Period |
2025-2032 |
| Pulse Ingredients Market Size 2024 |
USD 21,515.84 million |
| Pulse Ingredients Market, CAGR |
3.19% |
| Pulse Ingredients Market Size 2032 |
USD 27,555.90 million |
Market Overview:
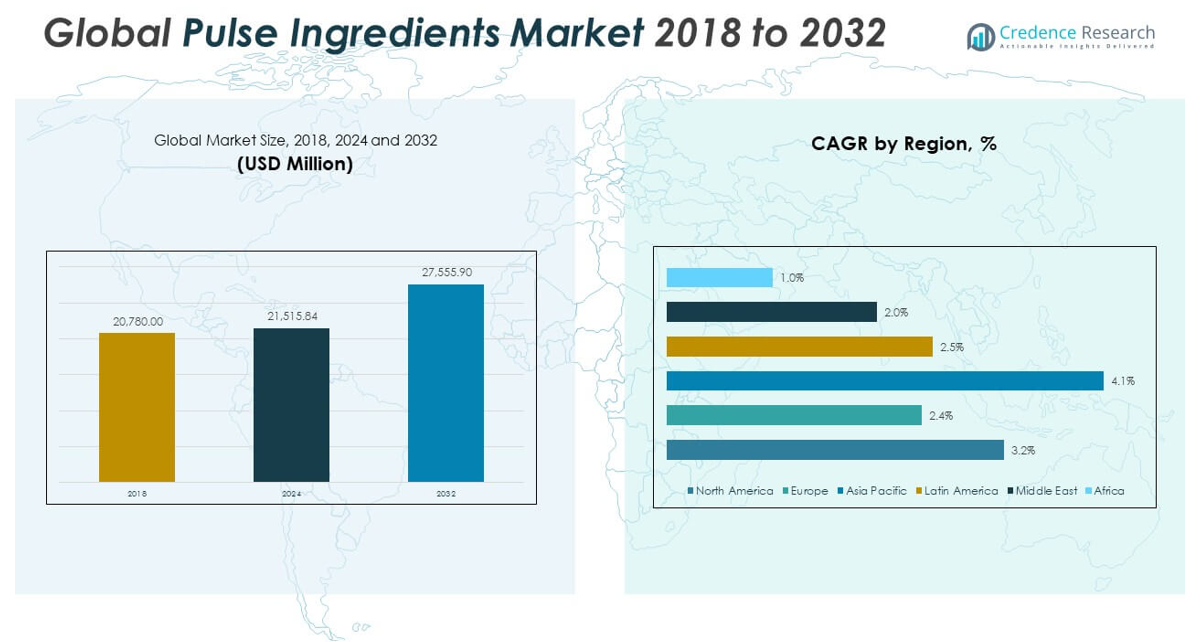
The Global Pulse Ingredients Market size was valued at USD 20,780.00 million in 2018 to USD 21,515.84 million in 2024 and is anticipated to reach USD 27,555.90 million by 2032, at a CAGR of 3.19% during the forecast period.
The key drivers fueling the growth of the global pulse ingredients market include the rising adoption of plant-based diets and the surge in health consciousness among consumers. Pulses, being rich in protein, dietary fiber, vitamins, and minerals, are widely recognized as a superior alternative to conventional protein sources. Their ability to improve digestion, aid in weight management, and reduce the risk of chronic diseases has increased their usage in functional foods and dietary supplements. Additionally, the growing popularity of veganism and flexitarian lifestyles is expanding the demand for pulse-based meat substitutes and dairy alternatives. Manufacturers are also attracted to pulse ingredients for their multifunctional roles such as gelling, emulsifying, thickening, and water retention, which make them highly desirable in processed food products. The sustainability angle further supports market growth, as pulses require less water, contribute to soil health through nitrogen fixation, and have a relatively low carbon footprint—making them an ideal choice for eco-conscious consumers and companies alike.
Regionally, the Asia-Pacific region dominates the global pulse ingredients market. This dominance is driven by countries like India and China, which are not only the largest producers of pulses globally but also have deeply rooted dietary habits centered around legumes. Asia-Pacific’s rapid urbanization, changing consumer lifestyles, and rising disposable incomes are also propelling the demand for ready-to-eat and health-oriented food products incorporating pulse ingredients. North America is another significant region, expected to register the fastest CAGR due to increasing consumer preference for natural and high-protein food products. The U.S. and Canada are witnessing a surge in pulse-based innovations, supported by favorable regulatory standards and growing interest in clean-label foods. Europe follows closely, with strong demand in countries such as Germany, France, and the UK, driven by sustainability goals, government initiatives, and a well-established vegetarian consumer base. Meanwhile, Latin America and the Middle East & Africa are emerging as promising markets, supported by gradual improvements in food processing infrastructure, evolving dietary preferences, and expanding urban populations. These regions are projected to experience moderate but steady growth over the coming years.
Market Insights:
- The Global Pulse Ingredients Market was valued at USD 20,780.00 million in 2018, reached USD 21,515.84 million in 2024, and is projected to reach USD 27,555.90 million by 2032, growing at a CAGR of 3.19% during the forecast period.
- Increasing adoption of plant-based diets and rising health consciousness are driving demand for pulse-based products rich in protein, dietary fiber, vitamins, and minerals, supporting their use in functional foods and dietary supplements.
- Pulse ingredients are used extensively in processed foods, bakery products, snacks, dairy alternatives, meat substitutes, animal feed, and pet nutrition, owing to their multifunctionality in emulsifying, thickening, water retention, and gelling.
- Pulses are environmentally sustainable, requiring significantly less water, naturally fixing nitrogen in soil, and contributing to a lower carbon footprint compared to animal-based proteins, appealing to eco-conscious consumers.
- The Asia-Pacific region dominates the market, with India and China being the largest global producers and consumers of pulses, while North America is expected to record the fastest CAGR, driven by clean-label trends and regulatory support.
- Market growth is challenged by supply chain instability, as climatic variations, droughts, and policy interventions in key regions like India, Canada, and Australia impact pulse yield, pricing, and global trade dynamics.
- Sensory and technical challenges such as bitterness, graininess, and off-flavors hinder broader product acceptance, requiring advanced processing technologies and R&D to improve taste, texture, and shelf stability for mainstream consumers.
Access crucial information at unmatched prices!
Request your sample report today & start making informed decisions powered by Credence Research Inc.!
Download Sample
Market Drivers:
Rising Demand for Plant-Based Nutrition and Functional Foods:
The shift toward plant-based diets is a core driver in the Global Pulse Ingredients Market. Consumers are increasingly prioritizing health, sustainability, and ethical consumption, prompting food manufacturers to seek high-protein, clean-label alternatives to animal-derived ingredients. Pulses, including lentils, chickpeas, peas, and beans, offer a rich source of plant protein, dietary fiber, and essential micronutrients. These attributes make pulse-derived flours, concentrates, and isolates attractive for health-conscious consumers. The demand for fortified food and beverages, including protein-enriched snacks, dairy alternatives, and meal replacements, continues to grow. It supports this trend with nutrient-dense, gluten-free, and allergen-friendly profiles that align with diverse consumer preferences.
- For instance, Ingredion Incorporated’s VITESSENCE® Pulse 1803 protein isolate delivers a minimum protein content of 80% on a dry basis, enabling manufacturers to formulate high-protein, plant-based foods with clean labels.
Expanding Application Across Food, Beverage, and Feed Industries:
Pulse ingredients are increasingly integrated into a broad range of products beyond traditional food categories. Their functionality in emulsification, water retention, thickening, and binding enhances their value in processed foods, bakery products, snacks, and plant-based meat alternatives. The Global Pulse Ingredients Market benefits from this wide applicability across sectors, including food and beverage, animal feed, and pet nutrition. In animal nutrition, pulse proteins and fibers serve as high-quality, digestible feed components. Demand for natural and sustainable feed inputs contributes to the adoption of pulses. Companies are also using pulse starch and flour in gluten-free and clean-label formulations, expanding their market penetration across both emerging and developed economies.
- For instance, Roquette’s NUTRALYS® pea protein is used in more than 100 plant-based food and beverage products globally, and the company’s pea protein isolates offer up to 85% protein content, supporting diverse applications in meat analogs, sports nutrition, and bakery products.
Consumer Preference for Sustainable and Environmentally Friendly Ingredients:
Sustainability concerns are playing a growing role in influencing ingredient choices across the supply chain. Pulses support sustainable agriculture due to their low water requirements, natural nitrogen fixation, and reduced dependency on synthetic fertilizers. It strengthens its market position by aligning with environmental goals set by regulators and food manufacturers. Consumers are becoming more aware of the ecological impact of their food choices, leading to increased adoption of pulse-based products. The carbon footprint of pulses is significantly lower than that of animal protein, which supports their promotion in climate-conscious food systems. Retailers and brands are responding by sourcing ingredients with verifiable environmental benefits, supporting long-term demand for pulse derivatives.
Innovation in Processing Technologies and Product Development:
Advancements in processing and extraction technologies have improved the functionality, texture, and sensory characteristics of pulse ingredients. These innovations enable manufacturers to tailor ingredients for specific applications such as dairy substitutes, high-protein snacks, and meat analogs. It leverages this technological progress to expand its relevance across mainstream and specialty food segments. Improved taste, shelf life, and versatility have addressed earlier consumer concerns related to flavor and consistency. Food scientists continue to explore new methods for enhancing protein yield, minimizing off-notes, and optimizing product performance. Innovation is playing a crucial role in strengthening the market presence of pulses in competitive, fast-moving consumer goods categories.
Market Trends:
Emergence of Specialty Pulse-Based Ingredients for Targeted Formulations:
Manufacturers are increasingly introducing specialty pulse-based ingredients designed for specific food applications. These include textured pulse proteins for meat analogs, micronized flours for improved solubility in beverages, and native starches for clean-label formulations. The Global Pulse Ingredients Market is evolving beyond standard flour and protein isolates, with R&D focusing on ingredient customization for enhanced functionality. This trend supports the demand for highly specialized formulations in sports nutrition, infant food, clinical nutrition, and performance-based snacks. Companies are investing in proprietary processing techniques to create pulse ingredients that meet distinct texture, flavor, and nutritional needs. It is moving toward value-added innovation, responding to shifting product development priorities in the food industry.
- For instance, Cosucra’s Pisane® pea protein isolate features a particle size of less than 100 microns, enabling rapid dispersion and solubility in ready-to-drink beverages and specialized clinical nutrition products.
Integration of Pulses in Non-Food Applications such as Cosmetics and Bioplastics:
Pulse-derived compounds are finding growing use in non-food industries, particularly in cosmetics, pharmaceuticals, and biodegradable packaging. The protein and fiber content of pulses supports their use in skin-care formulations, hair-care products, and natural personal care lines. It is seeing expanded applications in biodegradable films and bio-based plastics, where pulse starch serves as a sustainable raw material. Market participants are exploring these opportunities to diversify revenue streams and reduce reliance on traditional food channels. This expansion into adjacent markets creates new commercial pathways and elevates the industrial relevance of pulse-derived inputs. The Global Pulse Ingredients Market is increasingly intersecting with circular economy models and green chemistry principles.
- For instance, Cargill has developed a biodegradable packaging film using pea starch that demonstrates a tensile strength of over 30 MPa and biodegrades within 90 days under industrial composting conditions, supporting sustainable packaging innovation.
Growing Popularity of Hybrid Protein Products Blending Pulses with Other Plant Sources:
Food producers are developing hybrid protein blends that combine pulse proteins with other plant-based ingredients such as oats, rice, and algae. These formulations aim to optimize amino acid profiles, improve taste, and increase product versatility. The Global Pulse Ingredients Market supports this blending trend by offering customizable pulse proteins suited for pairing with complementary sources. Hybrid protein products are gaining consumer acceptance in sports drinks, protein bars, dairy alternatives, and meat substitutes. It enables manufacturers to meet multiple nutritional and sensory targets while maintaining product affordability. This trend reflects a broader shift toward precision formulation in the plant-based protein space.
Use of Blockchain and Traceability Solutions in Pulse Supply Chains:
The integration of digital technologies such as blockchain is transforming transparency and traceability in pulse ingredient sourcing. Food companies are adopting blockchain to verify origin, sustainability claims, and quality metrics across the value chain. The Global Pulse Ingredients Market is witnessing higher expectations for ingredient authenticity and safety assurance, particularly from premium food brands and export-driven markets. Traceable supply chains help brands validate non-GMO, organic, and fair-trade certifications. It strengthens trust among consumers who prioritize ethical and sustainable sourcing. This trend enhances supply chain accountability and enables real-time data exchange between producers, processors, and retailers.
Market Challenges Analysis:
Fluctuating Raw Material Supply and Price Volatility Limit Market Stability:
The Global Pulse Ingredients Market faces ongoing challenges related to the inconsistent availability and pricing of raw pulses. Agricultural production of pulses is highly sensitive to climatic variations, seasonal shifts, and water scarcity, especially in major growing regions such as India, Canada, and Australia. Unpredictable rainfall, droughts, and soil degradation can disrupt yield levels, leading to supply shortages and elevated procurement costs. Government policies concerning pulse exports, minimum support prices, and import restrictions also influence global trade dynamics. It struggles with long-term supply chain planning when sourcing is subject to external geopolitical and environmental risks. These fluctuations impact processing costs and reduce price competitiveness against synthetic or more stable plant-based alternatives.
Technical Barriers in Product Formulation and Consumer Acceptance:
Despite their nutritional benefits, pulse ingredients often present formulation challenges due to inherent sensory characteristics such as bitterness, graininess, and off-flavors. Food manufacturers must invest in advanced processing techniques to improve palatability, texture, and stability, which can raise development costs. The Global Pulse Ingredients Market contends with a knowledge gap among small- and mid-scale producers lacking access to refining technologies. It also encounters resistance from consumers unfamiliar with pulse-based products or sensitive to taste and appearance. In some applications, achieving parity with traditional dairy or meat analogs remains technically complex. These limitations restrict mass-market adoption, especially in categories where taste and mouthfeel are critical purchase drivers.
Market Opportunities:
Rising Demand in Emerging Economies with Expanding Middle-Class Populations:
Emerging markets across Asia-Pacific, Latin America, and Africa present untapped potential for the Global Pulse Ingredients Market. Rapid urbanization, growing health awareness, and expanding middle-income groups are driving interest in affordable, nutritious food options. It can leverage these demographic shifts by offering protein-rich, cost-effective ingredients tailored to local dietary needs. Government initiatives to combat malnutrition and promote sustainable agriculture also support pulse consumption. Local production capacity and infrastructure development will further enhance accessibility and affordability. These regions offer opportunities for market expansion through regional partnerships and investment in localized processing facilities.
Expansion of High-Growth Product Categories in Health and Wellness:
The growing popularity of functional foods, sports nutrition, and clean-label snacks creates favorable conditions for pulse ingredient innovation. It can meet evolving consumer preferences for plant-based, high-protein, and allergen-free solutions across these dynamic categories. Demand for ready-to-eat meals, fortified beverages, and protein supplements is creating new application spaces. The Global Pulse Ingredients Market stands to benefit from targeted formulations addressing gut health, satiety, and weight management. Companies that integrate pulses into novel delivery formats such as powders, bars, or functional drinks will capture growing niche demand. These segments offer strong margins and long-term scalability for industry players.
Market Segmentation Analysis:
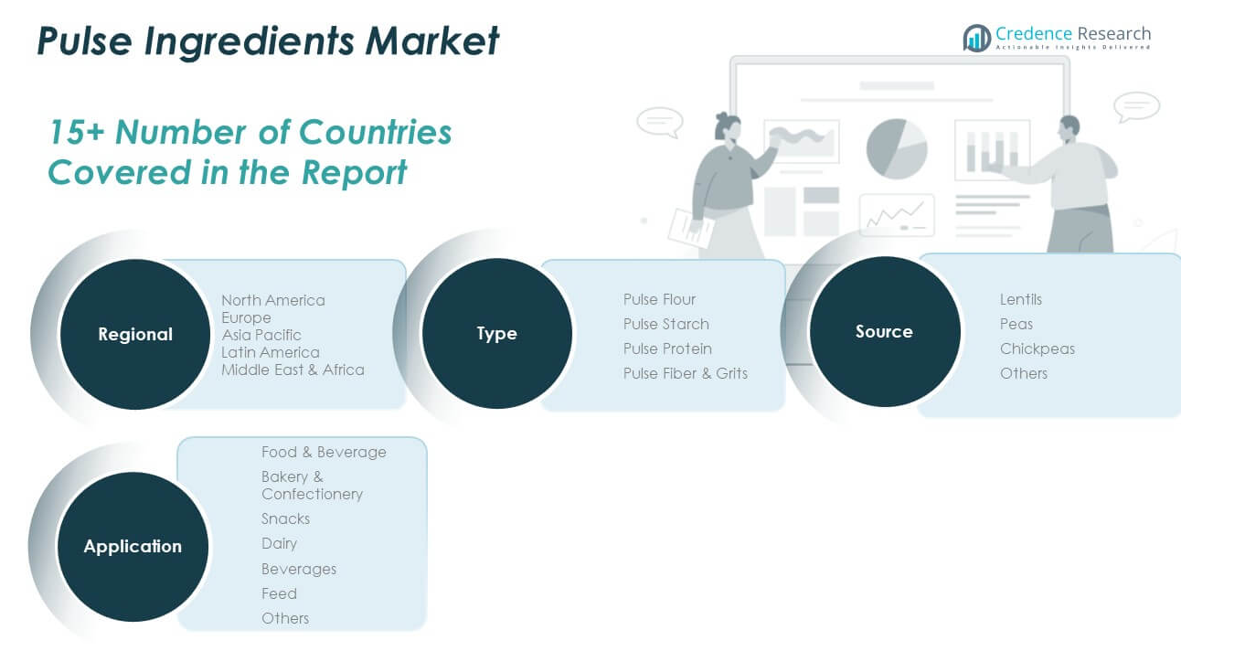
By Type
The Global Pulse Ingredients Market includes pulse flour, pulse starch, pulse protein, and pulse fiber & grits. Pulse flour holds a strong position due to its functional use in gluten-free and clean-label formulations. Pulse starch supports texture and stability in processed foods. Pulse protein is widely used in plant-based meat and nutritional products. Pulse fiber & grits enhance digestive health and support fiber-enriched food innovations.
- For instance, AGT Food and Ingredients processes more than 1 million metric tons of pulses annually into flours, proteins, starches, and fibers, supplying major food manufacturers with specialty pulse ingredients for diverse applications.
By Source
Key sources include lentils, peas, chickpeas, and others. Lentils and peas dominate the segment due to their consistent protein yield and broad cultivation across major regions. Chickpeas are favored for their mild flavor and emulsifying properties in dairy alternatives. The “others” category includes beans and mung beans, used in regional and specialty products.
- For instance, Puris supplies pea protein sourced from yellow peas grown across more than 200,000 acres in North America, supporting scalable, traceable supply chains for plant-based food manufacturers.
By Application
Major application areas are food & beverage, bakery & confectionery, snacks, dairy, beverages, feed, and others. Food & beverage lead the market due to growing demand for functional and health-based ingredients. Bakery and snack producers use pulse derivatives to meet protein and allergen-free product requirements. Dairy alternatives benefit from improved texture and nutrition. Beverages utilize pulse protein in high-protein shakes. Feed applications focus on the digestibility and nutritional quality of pulse inputs. Other uses include pet food, nutraceuticals, and meal replacements.
Segmentation:
By Type
- Pulse Flour
- Pulse Starch
- Pulse Protein
- Pulse Fiber & Grits
By Source
- Lentils
- Peas
- Chickpeas
- Others
By Application
- Food & Beverage
- Bakery & Confectionery
- Snacks
- Dairy
- Beverages
- Feed
- Others
By Region
- North America
- Europe
- Germany
- France
- U.K.
- Italy
- Spain
- Rest of Europe
- Asia Pacific
- China
- Japan
- India
- South Korea
- South-east Asia
- Rest of Asia Pacific
- Latin America
- Brazil
- Argentina
- Rest of Latin America
- Middle East & Africa
- GCC Countries
- South Africa
- Rest of the Middle East and Africa
Regional Analysis:
North America
The North America Pulse Ingredients Market size was valued at USD 5,564.88 million in 2018, reached USD 5,667.14 million in 2024, and is anticipated to reach USD 7,244.49 million by 2032, at a CAGR of 3.2% during the forecast period. North America commands a significant share of the Global Pulse Ingredients Market, driven by consumer demand for high-protein, plant-based, and clean-label products. The U.S. and Canada lead in product innovation across meat substitutes, snacks, and protein beverages. A strong regulatory framework supports sustainability and natural ingredient use. The region also benefits from advanced processing technology and a robust retail infrastructure. Flexitarian and vegan dietary trends continue to drive commercial demand.
Europe
The Europe Pulse Ingredients Market size was valued at USD 5,111.88 million in 2018, declined slightly to USD 5,072.85 million in 2024, and is projected to reach USD 6,110.59 million by 2032, growing at a CAGR of 2.4%. Europe maintains steady demand, backed by a well-established vegetarian base and environmental regulations. Germany, France, and the UK are leading contributors, integrating pulses into bakery, dairy alternatives, and snack products. Market growth is fueled by consumer interest in sustainable and ethical food sources. It benefits from institutional support for plant-forward diets and R&D in ingredient optimization. Companies focus on enhancing texture, taste, and nutrient density of pulse-based products.
Asia Pacific
The Asia Pacific Pulse Ingredients Market size was valued at USD 6,940.52 million in 2018, rose to USD 7,419.65 million in 2024, and is anticipated to reach USD 10,231.53 million by 2032, at a CAGR of 4.1%. Asia Pacific leads the Global Pulse Ingredients Market in both volume and value. India and China dominate regional output, supported by deep-rooted consumption patterns and large-scale cultivation. Urbanization and rising disposable incomes are increasing the demand for healthy, processed food. It benefits from expanding applications in bakery, snacks, and beverages. Regional innovation and growing exports are strengthening the market’s position globally.
Latin America
The Latin America Pulse Ingredients Market size was valued at USD 1,824.48 million in 2018, rose to USD 1,875.97 million in 2024, and is expected to reach USD 2,278.05 million by 2032, with a CAGR of 2.5%. Latin America is an emerging market with growing consumer awareness and evolving dietary preferences. Brazil and Argentina lead regional demand for pulse flour and proteins. Investment in domestic food processing supports the integration of pulse ingredients in snacks, baked goods, and beverages. It benefits from trade ties with North America and Europe. The region presents opportunities in affordable protein solutions.
Middle East
The Middle East Pulse Ingredients Market size was valued at USD 851.98 million in 2018, declined to USD 830.37 million in 2024, and is projected to reach USD 967.36 million by 2032, at a CAGR of 2.0%. The market is gradually expanding, particularly in GCC countries. Consumer demand for natural and functional foods is increasing. Imports meet most of the supply due to limited agricultural output. It is gaining traction in bakery and snack segments where plant-based innovation is rising. Awareness around nutrition and sustainability is improving. Regional players are focusing on premium and health-conscious offerings.
Africa
The Africa Pulse Ingredients Market size was valued at USD 486.25 million in 2018, increased to USD 649.87 million in 2024, and is projected to reach USD 723.87 million by 2032, growing at a CAGR of 1.0%. Africa holds the smallest market share but has untapped potential. Demand is growing due to urban expansion and increased focus on affordable nutrition. South Africa and Egypt are key countries supporting industrial-scale food processing. It faces challenges in logistics and local production capacity. Imports continue to meet demand across key categories. Local investment and infrastructure improvements could unlock future growth.
Shape Your Report to Specific Countries or Regions & Enjoy 30% Off!
Key Player Analysis:
- Ingredion Inc.
- Cargill Inc.
- Roquette Frères
- Emsland Group
- ADM
- The Scoular Company
- Coscura
- Puris
- Axiom Foods, Inc.
- AGT Food & Ingredients
- AM Nutrition
Competitive Analysis:
The Global Pulse Ingredients Market features a competitive landscape marked by strong presence of multinational corporations and specialized ingredient suppliers. Key players include Cargill, Ingredion Incorporated, Roquette Frères, ADM, and AGT Food and Ingredients, each leveraging extensive distribution networks and advanced processing technologies. It exhibits moderate consolidation, with major firms investing in new product development, clean-label innovations, and regional expansions to strengthen their market positions. Companies are focusing on strategic collaborations, acquisitions, and sustainability-driven initiatives to meet growing consumer demand. Smaller firms are differentiating through specialization in niche applications such as organic, non-GMO, and allergen-free pulse ingredients. Technological advancements in extraction and functional customization are enabling players to enhance performance across diverse food systems. The competitive intensity remains high, with continuous pressure to innovate, scale production, and maintain quality across global markets.
Recent Developments:
- In June 2025, Ingredion Inc. announced an expanded distribution partnership with Univar Solutions, effective October 1, 2025. This collaboration will bring a broader portfolio of plant-based and clean-label ingredients—including the innovative Novation® range of functional native starches and plant-based proteins—to food manufacturers across Belgium, the Netherlands, and Luxembourg. The partnership aims to accelerate the adoption of clean-label and sugar-reduction solutions in bakery, snacks, dairy, savory, and beverage applications, addressing the rising demand for healthier and sustainable food products.
- In June 2025, Cargill Inc. disclosed its agreement to acquire full ownership of Teys Australia and Teys USA, building on a 14-year partnership with the Teys family. This acquisition is set to enhance Cargill’s protein and ingredient supply capabilities, ensuring a stable and high-quality supply chain for food manufacturers worldwide. The transition, pending regulatory approval, is expected to close later in 2025 and reflects Cargill’s ongoing commitment to expanding its footprint in the global food protein market.Additionally, in February 2025, Cargill moved to acquire full control of SJC Bioenergia in Brazil, further strengthening its presence in renewable energy and integrated bio-based ingredients.
- In June 2025, Roquette Frères expanded its NUTRALYS® plant protein portfolio by launching two new textured solutions: NUTRALYS® T WHEAT 600L (textured wheat protein) and NUTRALYS® T PEA 700XC (textured pea protein). These innovations are designed to support the development of high-protein, sustainable, and meat-like food alternatives, offering over 60% protein content and improved sensory qualities for plant-based food manufacturers.Earlier in February 2025, Roquette also introduced a new eco-friendly coatings platform for pharmaceuticals and nutraceuticals, featuring plant-based polymers that reduce solvent use and carbon emissions.
- In March 2025, ADM signed a non-binding memorandum of understanding with Mitsubishi Corporation to form a strategic alliance. The partnership aims to explore new collaborations across the agriculture supply chain, focusing on secure, resilient, and sustainable food and ingredient systems. This alliance is expected to drive innovation and address global challenges in food security and supply chain resilience.
Market Concentration & Characteristics:
The Global Pulse Ingredients Market shows moderate market concentration, with a mix of global corporations and regional players competing across diverse application segments. It is characterized by strong raw material dependence, seasonal production cycles, and a growing emphasis on sustainability and traceability. Leading firms maintain competitive advantage through vertical integration, proprietary processing technologies, and well-established distribution channels. Regional suppliers focus on cost efficiency and localization to serve specific consumer preferences. The market remains highly responsive to innovation, especially in texture improvement, flavor masking, and clean-label formulation. It also reflects increasing regulatory scrutiny around food safety and environmental impact, influencing sourcing and production strategies.
Report Coverage:
The research report offers an in-depth analysis based on type, source, and application. It details leading market players, providing an overview of their business, product offerings, investments, revenue streams, and key applications. Additionally, the report includes insights into the competitive environment, SWOT analysis, current market trends, as well as the primary drivers and constraints. Furthermore, it discusses various factors that have driven market expansion in recent years. The report also explores market dynamics, regulatory scenarios, and technological advancements that are shaping the industry. It assesses the impact of external factors and global economic changes on market growth. Lastly, it provides strategic recommendations for new entrants and established companies to navigate the complexities of the market.
Future Outlook:
- Demand for pulse-based proteins will rise due to the global shift toward sustainable and plant-based nutrition.
- Technological advancements in extraction and formulation will enhance the functionality of pulse ingredients in diverse applications.
- Innovation in ready-to-eat meals, snacks, and beverages will expand the use of pulses in convenience foods.
- Clean-label and allergen-free product trends will drive adoption of pulse-derived flours, fibers, and starches.
- Asia-Pacific will remain the leading market, supported by high pulse production and growing urban demand.
- North America and Europe will witness increased investment in pulse-based meat and dairy alternatives.
- Regulatory support for sustainable agriculture and plant-based diets will positively influence market development.
- Expansion into non-food industries such as cosmetics and bioplastics will diversify commercial opportunities.
- Strategic mergers, acquisitions, and regional partnerships will shape competitive dynamics and global reach.
- Consumer education and product awareness will be critical to unlocking new growth in emerging markets.


