
Market Overview
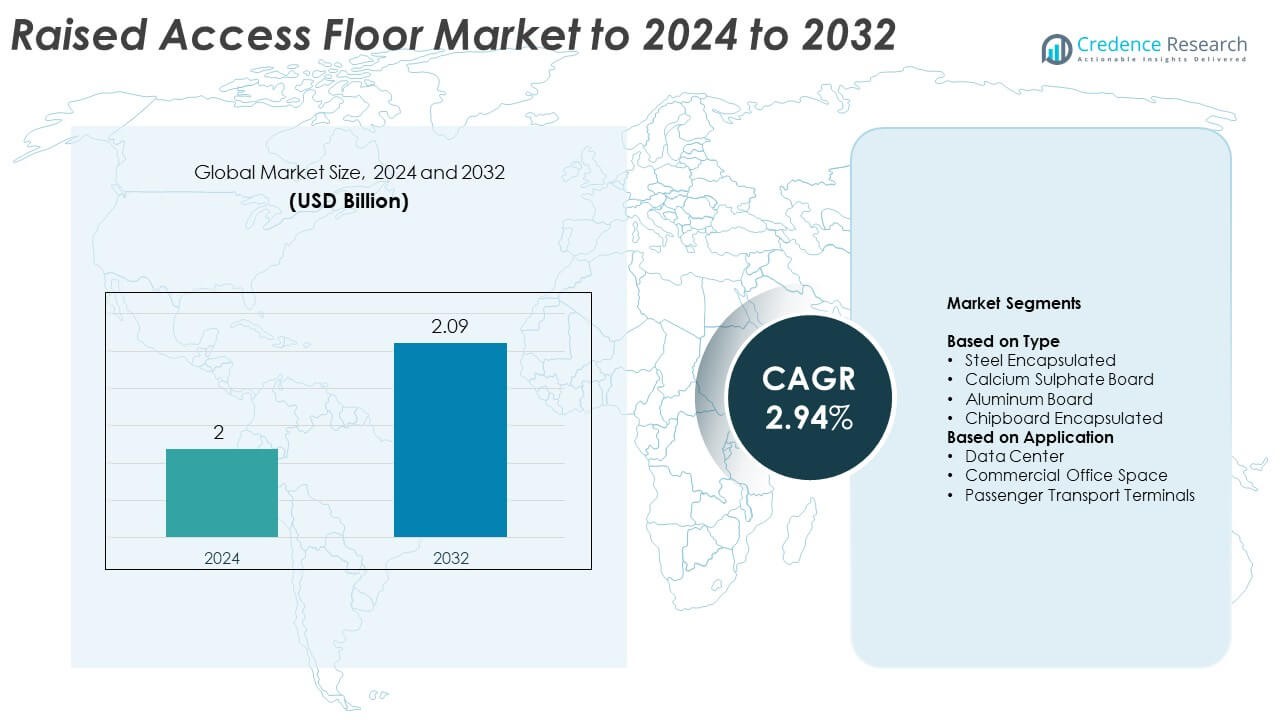
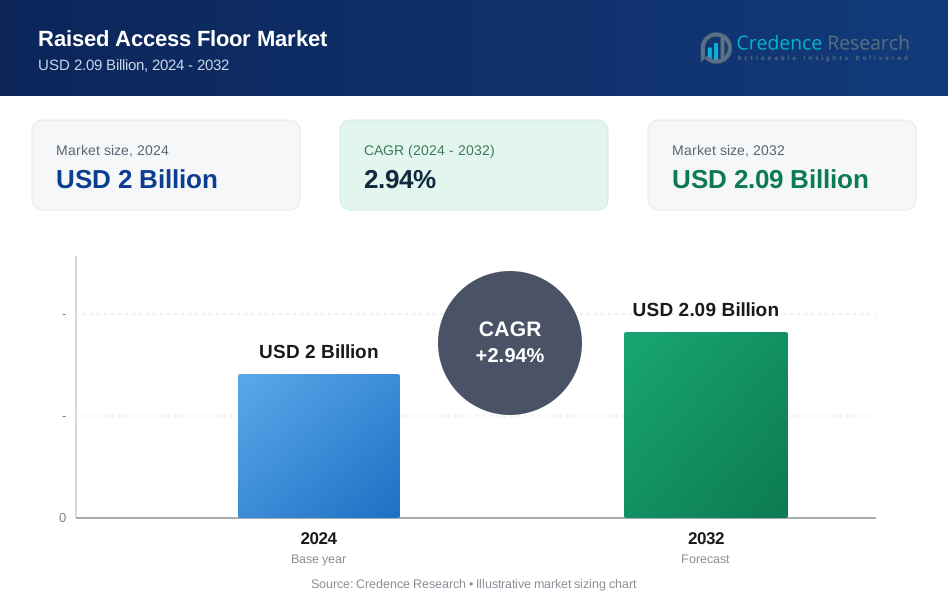
Raised Access Floor Market size was valued USD 2 Billion in 2024 and is anticipated to reach USD 2.09 Billion by 2032, at a CAGR of 2.94% during the forecast period.
| REPORT ATTRIBUTE | DETAILS |
|---|---|
| Historical Period | 2020-2023 |
| Base Year | 2024 |
| Forecast Period | 2025-2032 |
| Raised Access Floor Market Size 2024 | USD 2 Billion |
| Raised Access Floor Market, CAGR | 2.94% |
| Raised Access Floor Market Size 2032 | USD 2.09 Billion |
The raised access floor market is shaped by leading players such as Exyte Technologies, United Office Systems Pvt. Ltd., Eurodek, Everest Industries Limited Inc., Kingspan, Lindner Group, Comey, Gamma Industries, JVP, and Knauf, each competing through advanced materials, modular designs, and performance-focused systems. North America leads the global market with a 34% share, driven by strong data center expansion and commercial renovation activity. Europe follows with a 28% share supported by strict building-efficiency standards, while Asia Pacific holds a 25% share backed by rapid construction and digital-infrastructure growth. These regions anchor global demand due to sustained investment in flexible, technology-ready buildings.
Market Insights
- The market reached USD 2 Billion in 2024 and is projected to touch USD 2.09 Billion by 2032, growing at a CAGR of 2.94%. • Rising data center construction drives strong adoption, with the data center application segment holding a 52% share due to high cooling and cable-management needs. • Steel encapsulated floors lead the product landscape with a 46% share, supported by demand for high load capacity, vibration control, and long service life in advanced commercial and technology buildings. • Competition strengthens as manufacturers focus on modular systems, recyclable materials, and improved airflow engineering to meet energy-efficient building standards and fast installation requirements. • North America leads with a 34% regional share, followed by Europe at 28% and Asia Pacific at 25%, while Latin America and the Middle East & Africa hold 7% and 6% respectively, reflecting different levels of commercial construction, renovation activity, and digital-infrastructure expansion.
Market Segmentation Analysis:
By Type
Steel encapsulated panels lead this segment with a 46% share due to strong load-bearing strength and long service life. Users prefer steel systems because the structure supports heavy IT racks and reduces vibration in high-density setups. Calcium sulphate boards gain steady traction in buildings that need better fire resistance and acoustic control. Aluminum boards serve premium environments that demand corrosion resistance and lightweight construction. Chipboard encapsulated panels remain relevant in cost-focused projects. Growth across all types comes from rising infrastructure upgrades in offices and technology-driven facilities.
- For instance, Kingspan's RG3 steel-encapsulated panel, for 600 × 600 mm tiles, has a uniformly distributed load of 15 kN/m²and an ultimate load in excess of 8 kN.
By Application
Data centers dominate this segment with a 52% share, supported by rapid expansion of cloud infrastructure and rising cooling needs. Raised floors help manage complex cabling, improve airflow, and support high-capacity server racks, which boosts adoption in new and retrofit facilities. Commercial office spaces follow with strong demand for flexible layouts and concealed wiring. Passenger transport terminals adopt raised floors to maintain clean routing of power and communication lines. The overall segment benefits from rising modernization of high-traffic public and corporate environments.
- For instance, ASM’s FS-Series raised floor panels for data centers offer concentrated load ratings from 1,000 lbf to 3,000 lbf on 24 × 24 inch panels.
Key Growth Drivers
Expansion of Data Center Infrastructure
Global data center construction drives strong demand for raised access floors because operators require structured cabling, efficient airflow, and flexible load support. Modern hyperscale and colocation facilities need flooring systems that manage high-density racks and cooling pathways. The shift toward cloud services and edge computing adds more sites, which strengthens adoption. Enterprises also upgrade legacy server rooms to improve reliability and energy performance. This growing digital backbone keeps raised floor installations essential across both new builds and large-scale modernization projects.
- For instance, Tate’s FDEB_XH extra-heavy grade system for data centers is rated for a 12 kN/m² uniformly distributed load on its raised floor panels.
Increasing Demand for Flexible Office Layouts
Modern workplaces prioritize adaptable designs that support frequent layout changes, employee mobility, and technology integration. Raised floors help route power, telecom, and networking lines without structural modifications, which reduces renovation time. Organizations adopt these systems to support open-office concepts and hybrid work environments. Architectural firms also specify raised floors to enhance sustainability goals through reusable systems. The demand strengthens as companies focus on future-ready buildings with scalable infrastructure for evolving workspace needs.
- For instance, Haworth's TecCrete access floor system supports finished floor heights from 3 inches to 30 inches as standard for certain panel types, and can accommodate heights up to 64 inches (or sometimes 68 inches) via various pedestal and stringer systems.
Rise in Commercial Renovation and Retrofit Projects
A surge in renovation activity across corporate, retail, and transport infrastructure fuels market expansion. Builders choose raised access floors to upgrade wiring, increase cooling efficiency, and reduce downtime during modernization. Many aging buildings need improved IT capacity and energy management, which raises adoption. Retrofit-friendly panels allow quick installation over existing surfaces, supporting projects with strict timelines. This trend accelerates as businesses enhance digital connectivity and operational efficiency.
Key Trends and Opportunities
Adoption of Integrated Cooling and Cable Management Solutions
Next-generation raised floors integrate underfloor cooling, cable routing, and airflow controls to support advanced building automation. Data-intensive environments require precise temperature management, which boosts interest in floors that optimize understructure airflow. Manufacturers develop panels compatible with intelligent sensors and adaptive cooling systems. This alignment with smart-building technologies creates a strong opportunity for premium engineered flooring solutions across commercial and technology-led facilities.
- For instance, Polygroup’s GAMAFLOR raised access floors for transport terminals use standard 600 × 600 mm panels and are designed to work effectively with underfloor HVAC airflow paths.
Growth of Sustainable and Recyclable Flooring Materials
Sustainability initiatives push manufacturers toward low-emission, recyclable, and energy-efficient materials. Organizations prefer raised floors made from steel, aluminum, and calcium sulphate due to high durability and reusability. Green building certifications encourage the use of eco-friendly components that reduce lifecycle environmental impact. Demand rises as developers seek materials that support circular construction and long-term operational efficiency. This trend presents strong opportunities for suppliers offering certified sustainable systems.
- For instance, Nesite’s calcium sulphate raised floor panels use very high-density cores at 1,600 kg/m³, with thickness options such as 34 mm and 30 mm, and are EPD-certified for sustainable projects.
Increasing Adoption in Transportation and Public Infrastructure
Transport terminals, airports, and metro stations expand their use of raised floors to streamline maintenance and support digital systems. Passenger facilities require clean routing for communication networks, security systems, and power distribution, making raised floors ideal. With ongoing upgrades in transit infrastructure and smart-terminal projects, market participants gain new opportunities. These installations improve safety, service continuity, and long-term operational performance.
Key Challenges
High Installation and Material Costs
Raised access floors require skilled installation, precision leveling, and premium materials, which raise upfront costs. Budget-sensitive commercial projects may shift to alternative cable-routing methods to reduce expenditure. The cost barrier is stronger in small and mid-scale developments where flooring systems compete with simpler wiring solutions. This challenge limits adoption in price-critical markets and delays upgrades in older buildings with restricted budgets.
Limited Suitability in Certain Structural Designs
Some buildings lack the structural load capacity or height allowances needed for raised floor systems. Older facilities, low-ceiling environments, and compact commercial spaces may face restrictions that prevent installation. These limitations require redesign or reinforcement, which increases project complexity. Such constraints reduce market penetration across specific architectural layouts and restrict adoption in retrofit projects with tight spatial limitations.
Regional Analysis
North America
North America holds a 34% share of the raised access floor market, supported by strong adoption across data centers, corporate offices, and technology-driven facilities. Demand grows as enterprises upgrade network infrastructure and expand cloud operations. The region benefits from high investment in commercial renovation and retrofitting, which increases usage in office remodels and hybrid-work conversions. Advanced building standards also encourage use of modular flooring for efficient cabling and airflow management. Growth remains steady due to continued expansion of digital infrastructure and the need for flexible, service-friendly building layouts.
Europe
Europe accounts for a 28% share, driven by widespread adoption in commercial offices, transport hubs, and high-performance buildings. Strict energy-efficiency guidelines encourage developers to use raised floors to support optimized airflow and integrated building-automation systems. Demand increases as organizations pursue flexible layouts suited for rapid technology upgrades. Renovation of aging structures boosts installations in telecom, public facilities, and financial offices. Data center expansion across Germany, the Netherlands, and the Nordics also supports growth. The region remains a mature and innovation-focused market that prioritizes durable and sustainable flooring systems.
Asia Pacific
Asia Pacific holds a 25% share, driven by rapid growth in data centers, IT parks, and large commercial complexes. Strong construction activity in China, India, Japan, and Southeast Asia accelerates adoption. Developers choose raised floors to handle dense cabling, increasing cooling loads, and expanding digital services. The region benefits from major investments in smart buildings and urban infrastructure, which strengthens demand for modular flooring. Rising office space construction and expansion of multinational campuses further support the segment. Asia Pacific continues to emerge as a high-growth region with strong long-term potential.
Latin America
Latin America captures a 7% share, supported by steady expansion in commercial offices, telecom upgrades, and modernization of corporate facilities. Brazil and Mexico lead demand due to stronger investment in IT infrastructure and urban commercial projects. Adoption increases as companies upgrade wiring systems and integrate more digital equipment into workplaces. Growth remains moderate but stable, helped by rising interest in energy-efficient building designs. Airports and public buildings also add to demand as transport infrastructure improves. The region shows ongoing potential as renovation activities increase across major cities.
Middle East and Africa
Middle East and Africa account for a 6% share, driven by rising construction of commercial buildings, airports, and technology parks. Gulf countries lead with high investment in smart infrastructure, corporate campuses, and modern transport terminals. Growing data center development strengthens usage due to cooling and cable-management benefits. African markets see gradual adoption as urbanization expands and commercial facilities upgrade digital capacity. Demand grows in premium office projects requiring flexible layouts and concealed wiring. While the market is smaller, rising infrastructure spending supports steady long-term growth.
Market Segmentations:
By Type
- Steel Encapsulated
- Calcium Sulphate Board
- Aluminum Board
- Chipboard Encapsulated
By Application
- Data Center
- Commercial Office Space
- Passenger Transport Terminals
By Geography
- North America
- U.S.
- Canada
- Mexico
- Europe
- Germany
- France
- U.K.
- Italy
- Spain
- Rest of Europe
- Asia Pacific
- China
- Japan
- India
- South Korea
- South-east Asia
- Rest of Asia Pacific
- Latin America
- Brazil
- Argentina
- Rest of Latin America
- Middle East & Africa
- GCC Countries
- South Africa
- Rest of the Middle East and Africa
Competitive Landscape
Exyte Technologies, United Office Systems Pvt. Ltd., Eurodek, Everest Industries Limited Inc., Kingspan, Lindner Group, Comey, Gamma Industries, JVP, and Knauf represent the key participants shaping the competitive landscape of the raised access floor market. The market features strong product diversification, with companies focusing on durable panels, modular systems, and advanced load-bearing designs. Many suppliers invest in engineered materials that support heavy IT equipment and improve airflow paths for data-intensive environments. Competitors also strengthen portfolios with fire-resistant and acoustic-efficient boards to meet modern building standards. Several firms expand manufacturing capacity to reduce delivery times and support large commercial and technology projects. Digital tools for layout planning and installation continue to enhance customer engagement. Many participants emphasize sustainability, offering recyclable materials and low-emission components. The landscape grows more dynamic as players compete on product performance, installation speed, customization capability, and long-term system reliability across global markets.
Key Player Analysis
- Exyte Technologies
- United Office Systems Pvt. Ltd.
- Eurodek
- Everest Industries Limited Inc.
- Kingspan
- Lindner Group
- Comey
- Gamma Industries
- JVP
- Knauf
Recent Developments
- In 2025, Knauf India launched the GIFAfloor system, a gypsum-based raised flooring solution designed to be a fast, dry, and eco-friendly alternative to traditional wet construction methods.
- In 2025, Everest Industries has continued to develop its access floor systems focused on providing intelligent, manageable infrastructure solutions for flexible office layouts.
- In 2023, Kingspan Group launched the RMG600+, its lowest-ever embodied carbon raised access floor panel for commercial offices in the UK and Ireland, which delivers a 57% reduction in embodied carbon compared to standard panels.
Report Coverage
The research report offers an in-depth analysis based on Type, Application and Geography. It details leading market players, providing an overview of their business, product offerings, investments, revenue streams, and key applications. Additionally, the report includes insights into the competitive environment, SWOT analysis, current market trends, as well as the primary drivers and constraints. Furthermore, it discusses various factors that have driven market expansion in recent years. The report also explores market dynamics, regulatory scenarios, and technological advancements that are shaping the industry. It assesses the impact of external factors and global economic changes on market growth. Lastly, it provides strategic recommendations for new entrants and established companies to navigate the complexities of the market.
Future Outlook
- Demand will rise as data centers expand and require advanced airflow and cable-management systems.
- Commercial offices will adopt more modular floors to support flexible workspace designs.
- Renovation projects will drive steady installations across aging corporate and public buildings.
- Smart-building integration will increase the use of sensor-compatible flooring systems.
- Sustainable and recyclable flooring materials will gain stronger preference among developers.
- Transport hubs and airports will install more raised floors to support digital infrastructure.
- Lightweight and high-strength panels will gain traction in large technology-driven projects.
- Growth in hybrid work models will raise demand for adaptable wiring and power layouts.
- Increased edge computing sites will create new opportunities for raised floor installations.
- Faster construction cycles will encourage adoption of easy-to-install modular flooring solutions.
Request a Free Sample
Fill in your details and we'll send you a free sample report.
- Sample data tables & charts
- Research methodology
Need a Custom Version of This Report?
Tailor the scope, geography, or segments to your exact requirements.
- Custom geography or segment scope
- Direct access to our analyst team
Frequently Asked Questions
What is the current market size for Raised Access Floor Market, and what is its projected size in 2032?
At what Compound Annual Growth Rate is the Raised Access Floor Market projected to grow between 2025 and 2032?
Which Raised Access Floor Market segment held the largest share in 2024?
What are the primary factors fueling the growth of the Raised Access Floor Market?
Who are the leading companies in the Raised Access Floor Market?
Which region commanded the largest share of the Raised Access Floor Market in 2024?
Table of Content
Chapter 1. Report Introduction
- 1.1 Report Description & Purpose
- 1.1.1 Report Title & Market Definition
- 1.1.2 Unique Selling Propositions (USP) & Key Differentiators
- 1.1.3 Value Proposition for Stakeholders
- 1.2 Research Objectives
- 1.2.1 Market Sizing Objectives (Volume & Revenue) (Volume Where Applicable)
- 1.2.2 Segmentation Objectives
- 1.2.3 Competitive Intelligence Objectives
- 1.2.4 Forecast & Scenario Objectives
- 1.3 Report Scope
- 1.3.1 Raised Access Floor Scope – Segments & Subsegments Covered
- 1.3.2 Geographic Scope – Regions & Countries Covered
- 1.3.3 Historical Period, Base Year & Forecast Period (2024; forecast to 2032)
- 1.3.4 Inclusions & Exclusions
- 1.4 Industry Classification & Applicable Codes
- 1.5 Currency, Measurement Units & Valuation Basis
- 1.6 Target Stakeholders
- 1.7 Limitations & Assumptions
Chapter 2. Executive Summary
- 2.1 Global Raised Access Floor Market Snapshot
- 2.1.1 Market Size – Historical (2024) & Forecast (2024-2032) (2024: USD 2 Billion → 2032: USD 2.09 Billion)
- 2.1.2 Volume & Revenue – Global Totals (Volume Where Applicable)
- 2.1.3 Key Market Highlights – Top Five Facts
- 2.2 Raised Access Floor Market Segmentation Snapshot
- 2.2.1 Market Split by Region – 2024 vs. 2032
- 2.3 Competitive Snapshot
- 2.3.1 Top 10 Players by Revenue Share – 2024
- 2.3.2 Top 10 Players by Volume Share – 2024 (Volume Where Applicable)
- 2.3.3 Recent Strategic Developments (18-Month Summary)
- 2.4 Key Investment Highlights & Strategic Conclusions
Chapter 3. Raised Access Floor Market Dynamics & Industry Analysis
- 3.1 Market Overview & Context
- 3.1.1 Raised Access Floor Market Position in the Broader Industry Value Chain
- 3.1.2 Demand Structure & Purchasing Dynamics
- 3.1.3 Market Maturity & Development Stage by Region
- 3.2 Raised Access Floor Market Drivers
- 3.3 Raised Access Floor Market Restraints & Challenges
- 3.4 Raised Access Floor Market Opportunities
- 3.5 Porter's Five Forces Analysis
- 3.5.1 Threat of New Entrants
- 3.5.2 Bargaining Power of Suppliers
- 3.5.3 Bargaining Power of Buyers
- 3.5.4 Threat of Substitutes
- 3.5.5 Competitive Rivalry – Intensity Assessment
- 3.6 Raised Access Floor Value Chain Analysis
- 3.6.1 Upstream – Key Inputs, Resources & Suppliers
- 3.6.1.1 Key Input/Resource 1
- 3.6.1.2 Key Input/Resource 2
- 3.6.1.3 Key Input/Resource 3
- 3.6.2 Midstream – Core Operations & Value Creation
- 3.6.2.1 Operating Model & Process Overview
- 3.6.2.2 Key Operating Locations & Capabilities by Company
- 3.6.3 Downstream – Market Channels & End Users
- 3.6.3.1 Direct Sales & Customer Engagement Channels
- 3.6.3.2 Indirect Sales, Intermediaries & Partner Channels
- 3.6.4 Value Chain Profitability Analysis
- 3.6.1 Upstream – Key Inputs, Resources & Suppliers
- 3.7 PESTEL Analysis
- 3.7.1 Political Factors
- 3.7.2 Economic Factors
- 3.7.3 Social Factors
- 3.7.4 Technological Factors
- 3.7.5 Environmental Factors
- 3.7.6 Legal Factors
- 3.8 Raised Access Floor Supply Chain Analysis
- 3.8.1 Critical Input & Resource Availability Risk Assessment
- 3.8.2 Supplier & Operational Concentration Risk (Geographic Exposure)
- 3.8.3 Supply & Service Disruption Impact Analysis
- 3.9 Regulatory & Policy Landscape
Note: The regulatory and policy landscape section covers regulations based on their applicability to the market, Raised Access Floor category, geography, and scope of the study. Only regulatory frameworks with a material impact on operations, compliance, trade, sustainability, or market access are analyzed in detail.
Chapter 4. Key Investment Pockets & Opportunity Analysis
- 4.1 Raised Access Floor Market Attractiveness Analysis
- 4.1.1 By Region – Investment Attractiveness Matrix (Market Size × CAGR)
- 4.2 Absolute Revenue Growth Opportunity
- 4.2.1 By Region – Absolute Revenue Growth Through 2032
- 4.3 Incremental Demand Opportunity
- 4.3.1 By Region – Incremental Demand Through 2032
- 4.3.2 Segment – Incremental Demand
- 4.4 Emerging Submarket Opportunity Deep Dive (Subject to Applicability)
- 4.5 Priority Market Opportunity Scorecards
- 4.5.1 United States
- 4.5.2 Europe
- 4.5.3 Asia
- 4.5.4 Middle East & Africa
Note: Priority market opportunity scorecards reflect the geographic scope and strategic relevance of the study. Listed markets are indicative and may be adapted to the industry.
Chapter 5. Raised Access Floor Cross-Border Trade & Market Access Analysis
- 5.1 International Trade & Cross-Border Activity Overview
- 5.1.1 Global Export Value by Country (2024)
- 5.1.2 Global Export Volume by Country (2024) (Volume Where Applicable)
- 5.1.3 Global Import Value by Country (2024)
- 5.1.4 Global Import Volume by Country (2024) (Volume Where Applicable)
- 5.1.5 Net Trade Balance by Country (2024)
- 5.2 Export Analysis – Segment
- 5.2.1 Category 1 (Applicable Classification Code)
- 5.2.2 Category 2 (Applicable Classification Code)
- 5.2.3 Category 3 (Applicable Classification Code)
- 5.2.4 Category 4 (Applicable Classification Code)
- 5.2.5 Category 5 (Applicable Classification Code)
- 5.3 Import Analysis – Segment
- 5.3.1 Category 1 (Applicable Classification Code)
- 5.3.2 Category 2 (Applicable Classification Code)
- 5.3.3 Category 3 (Applicable Classification Code)
- 5.3.4 Category 4 (Applicable Classification Code)
- 5.3.5 Category 5 (Applicable Classification Code)
- 5.4 Cross-Border Pricing & Transaction Benchmarks
- 5.4.1 Export Pricing – Segment & Country
- 5.4.2 Import Pricing – Segment & Source Country
- 5.4.3 Price Trends (2024)
- 5.5 Key Cross-Border Trade & Delivery Routes
- 5.5.1 Cross-Border Trade/Delivery Route 1
- 5.5.2 Cross-Border Trade/Delivery Route 2
- 5.5.3 Cross-Border Trade/Delivery Route 3
- 5.5.4 Cross-Border Trade/Delivery Route 4
- 5.5.5 Cross-Border Trade/Delivery Route 5
- 5.6 Trade Policy & Market Access Impact Assessment
- 5.6.1 Tariff & Non-Tariff Barriers
- 5.6.2 Regional Trade & Economic Integration Frameworks
- 5.6.3 Bilateral & Multilateral Trade Agreements
- 5.6.4 Cross-Border Operating, Licensing & Localization Requirements
Note: This chapter applies where cross-border trade or delivery is relevant to Raised Access Floor. Goods, services, and digital offerings are assessed using applicable classifications and transaction measures. Import-export volumes, trade balances, and route analyses are included only where meaningful to the market.
Chapter 6. Competitive Landscape & Company Benchmarking
- 6.1 Raised Access Floor Market Concentration & Structure
- 6.1.1 Herfindahl-Hirschman Index (HHI) – vs. 2024
- 6.1.2 Leading, Mid-Sized & Emerging Player Structure
- 6.1.3 Global, Regional & Local Player Dynamics
- 6.2 Raised Access Floor Market Share Analysis – 2024
- 6.2.1 Global Revenue Share by Company
- 6.2.2 Global Volume Share by Company (Volume Where Applicable)
- 6.2.3 Regional Revenue Share
- 6.2.4 Market Share Evolution ( vs. 2024)
- 6.2.5 Company Market Share by Key Segment
- 6.2.6 Company Market Share by Customer Group
- 6.3 Operating Scale, Capacity & Infrastructure Analysis
- 6.3.1 Global Operating Scale & Supply Capacity
- 6.3.2 Resource Utilization & Operating Efficiency
- 6.3.3 Output, Service Delivery & Activity Metrics
- 6.3.4 Operating Footprint & Infrastructure Map
- 6.3.5 Planned Operational & Capacity Expansion
- 6.4 Raised Access Floor Competitive Benchmarking Matrix
- 6.4.1 Revenue, Growth, Profitability & Operating Metric Comparison
- 6.4.2 Channel Revenue Mix
- 6.4.3 Geographic Revenue Exposure
- 6.4.4 R&D Intensity
- 6.4.5 Sustainability Maturity
- 6.5 Strategic Developments in Raised Access Floor (Last 24 Months)
- 6.5.1 Mergers, Acquisitions & Divestments
- 6.5.2 New Products, Services & Solutions in Raised Access Floor
- 6.5.3 Operational & Infrastructure Expansions
- 6.5.4 Strategic Alliances, Joint Ventures & Partnerships
- 6.5.5 Distribution Expansion & Market Entry
- 6.5.6 Sustainability & ESG Initiatives
- 6.6 Competitive Strategy Mapping
- 6.6.1 Leader, Challenger, Follower & Niche Classification
- 6.6.2 Pricing Strategy Comparison
- 6.6.3 Channel Strategy Matrix
Note: Strategic developments are included based on their materiality and the availability of reliable information.
Chapter 7. Global Raised Access Floor Market – By Sales & Delivery Channel
- 7.1 Segment Overview
- 7.1.1 Volume & Revenue Split by Channel (2024 & 2032) (Volume Where Applicable)
- 7.1.2 Channel Mix Evolution (2024-2032)
Chapter 8. Regional Market Analysis – Global Overview
- 8.1 Global Regional Overview
- 8.1.1 Regional Volume Share (Volume Where Applicable)
- 8.1.2 Regional Revenue Share
- 8.1.3 Regional Volume by Region (Volume Where Applicable)
- 8.1.4 Regional Revenue by Region
- 8.1.5 Regional Forecast Through 2032
- 8.2 Cross-Regional Segment Analysis
- 8.2.1 By Sales & Delivery Channel
- 8.2.2 By Competitive Positioning & Price Tier
Chapter 9. North America Raised Access Floor Market
- 9.1 United States
- 9.2 Canada
- 9.3 Mexico
Chapter 10. Europe Raised Access Floor Market
- 10.1 Germany
- 10.2 France
- 10.3 Italy
- 10.4 United Kingdom
- 10.5 Spain
- 10.6 Poland
- 10.7 Russia
- 10.8 Netherlands
- 10.9 Belgium
- 10.10 Sweden
- 10.11 Denmark
- 10.12 Norway
- 10.13 Rest of Europe
Chapter 11. Asia Pacific Raised Access Floor Market
- 11.1 China
- 11.2 India
- 11.3 Japan
- 11.4 South Korea
- 11.5 Thailand
- 11.6 Indonesia
- 11.7 Vietnam
- 11.8 Malaysia
- 11.9 Australia
- 11.10 Rest of Asia Pacific
Chapter 12. Latin America Raised Access Floor Market
- 12.1 Brazil
- 12.2 Argentina
- 12.3 Colombia
- 12.4 Chile
- 12.5 Rest of Latin America
Chapter 13. Middle East Raised Access Floor Market
- 13.1 Saudi Arabia
- 13.2 United Arab Emirates
- 13.3 Turkey
- 13.4 Israel
- 13.5 Iran
- 13.6 Rest of the Middle East
Chapter 14. Africa Raised Access Floor Market
- 14.1 South Africa
- 14.2 Egypt
- 14.3 Nigeria
- 14.4 Morocco
- 14.5 Rest of Africa
Chapter 15. Raised Access Floor Company Profiles
- 15.1 [Company 01]
- 15.1.1 Company Overview
- 15.1.2 Key Management Personnel
- 15.1.3 Products & Services Portfolio
- 15.1.4 Financial Performance
- 15.1.5 Key Market Focus & Geographic Presence
- 15.1.6 Recent Developments & Strategic Initiatives
Note: The company profile list is preliminary and may change based on research findings, market developments, data availability, and client requirements.
Chapter 16. Appendices
- Appendix A – List of Abbreviations & Acronyms
- Appendix B – Industry Classification Code Reference – Full Series
- Appendix C – Supply, Output & Operating Capacity Data Tables
- Appendix D – End-Use & Demand Base Tables
- Appendix E – Demand, Adoption & Usage Assumptions
- Appendix F – Pricing & Revenue Metric Reference Tables
- Appendix G – Company Operations & Infrastructure Database
- Appendix H – Cross-Border Trade & Activity Data Tables (Where Applicable)
- Appendix I – Regulatory Summary Tables
- Appendix J – Primary Research Participant List (Anonymized)
- Appendix K – Primary Research Questionnaire Framework
- Appendix L – Data Sources & Bibliography
- Appendix M – Market Size Divergence & Source Comparison
Chapter 17. Research Methodology
- 17.1 Research Framework & Philosophy
- 17.2 Secondary Research – Sources, Hierarchy & Data Extraction
- 17.3 Data Modeling – Bottom-Up & Top-Down Market Sizing
- 17.4 Primary Research – Stakeholder Framework, LOI & Sample Sizes
- 17.5 Forecast Methodology – Regression, Scenario & Sensitivity Analysis
- 17.6 Quality Control – Four-Layer Validation Framework
- 17.7 Limitations & Standard Assumptions
- 17.8 Disclaimer
