
Market Overview
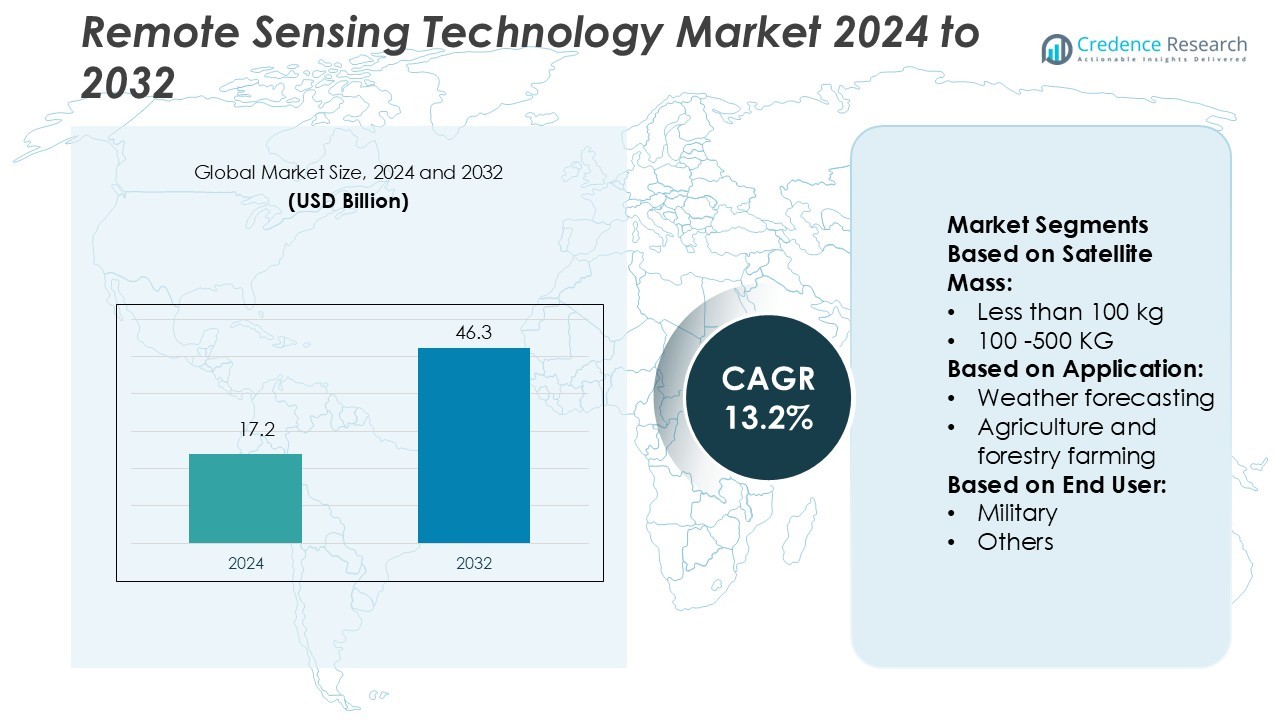
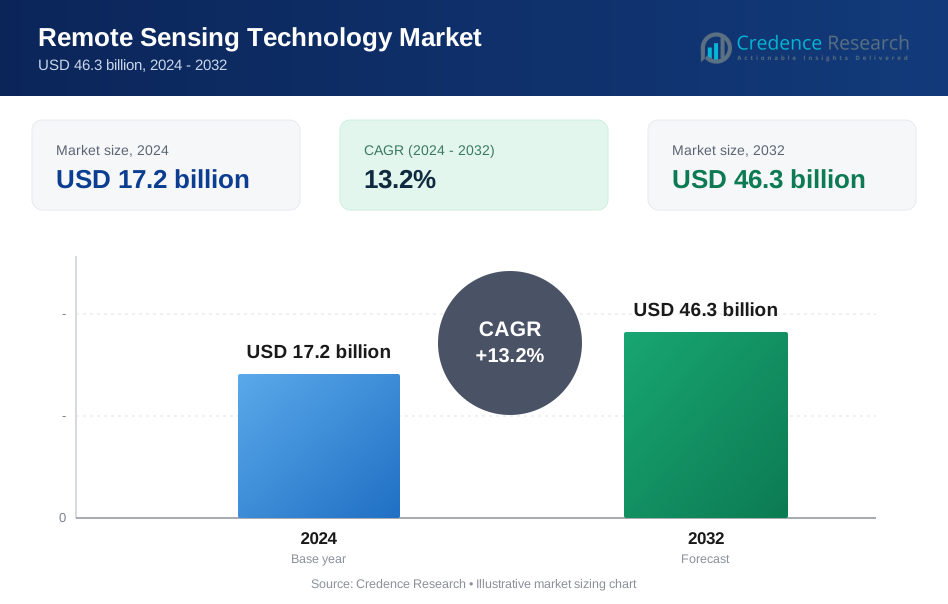
Remote Sensing Technology Market size was valued USD 17.2 billion in 2024 and is anticipated to reach USD 46.3 billion by 2032, at a CAGR of 13.2% during the forecast period.
| REPORT ATTRIBUTE | DETAILS |
|---|---|
| Historical Period | 2020-2023 |
| Base Year | 2024 |
| Forecast Period | 2025-2032 |
| Remote Sensing Technology Market Size 2024 | USD 17.2 Billion |
| Remote Sensing Technology Market, CAGR | 13.2% |
| Remote Sensing Technology Market Size 2032 | USD 46.3 Billion |
The remote sensing technology market is driven by top players including Dhruva Space, Boeing, EnduroSat, Airbus, INVAP, Blue Canyon Technologies, BAE Systems, Indian Space Research Organisation, Lockheed Martin, and Beijing Smart Satellite. These companies focus on enhancing satellite imaging, real-time data analytics, and advanced sensor technologies to strengthen their competitive positions. Strategic partnerships and investments in AI-driven platforms support expanded global coverage and faster data delivery. North America leads the market with a 36% share, supported by strong government funding, advanced infrastructure, and widespread adoption across defense, agriculture, and environmental monitoring applications. This leadership is reinforced by early technology integration and frequent satellite deployments.
Market Insights
- The remote sensing technology market was valued at USD 17.2 billion in 2024 and is projected to reach USD 46.3 billion by 2032, growing at a CAGR of 13.2%.
- Rising demand for climate monitoring, defense surveillance, and precision agriculture is driving strong adoption across both government and commercial sectors.
- AI-driven analytics and miniaturized satellite constellations are key trends enhancing data accuracy and lowering operational costs.
- The market is led by major players focusing on advanced imaging and strategic collaborations, with North America holding a 36% share and Europe 27%.
- Satellite imaging systems hold the largest segment share due to high demand for environmental, security, and infrastructure applications, while emerging regions like Asia Pacific are expected to record the fastest growth.
Market Segmentation Analysis:
By Satellite Mass
Satellites weighing 100–500 kg dominate the Remote Sensing Technology Market with the largest share. These satellites offer an optimal balance between launch cost, payload capacity, and imaging resolution. Medium-sized platforms support advanced sensors, including hyperspectral and synthetic aperture radar systems, which are ideal for environmental and agricultural monitoring. Their compatibility with multiple launch vehicles improves deployment flexibility. The strong demand from commercial and defense applications boosts their market position. Miniaturization of sensors and increased private sector launches further drive this sub-segment’s growth.
- For instance, Dhruva Space launched two Thybolt nanosatellites in November 2022, each weighing less than 750 grams. The mission was a technology demonstration for a store-and-forward communications payload for amateur radio operators.
By Application
Weather forecasting holds the leading share in the market, driven by rising demand for accurate climate monitoring. Advanced sensors provide real-time atmospheric data, supporting disaster management and agricultural planning. Continuous investments from national meteorological agencies and private operators enhance forecasting precision. High-resolution optical and radar imagery allows early detection of extreme weather events, improving preparedness. This segment benefits from improved satellite revisit rates and data integration with AI and cloud-based analytics platforms, strengthening its dominance across applications.
- For instance, Boeing’s contribution to the GOES‑15 weather satellite included a launch mass of 3,238 kg and a power system delivering about 2.3 kW at beginning-of-life.
By End-User
The government sector leads the end-user segment with a significant market share. Governments use remote sensing technologies for national security, infrastructure planning, and environmental monitoring. Public agencies invest heavily in advanced Earth observation constellations and geospatial data platforms. These systems enable efficient border surveillance, disaster management, and resource mapping. Strategic collaborations with private companies expand data access and enhance operational capabilities. Strong funding support and regulatory frameworks maintain government dominance in the end-user landscape.
Key Growth Drivers
Rising Demand for Climate and Environmental Monitoring
The growing need to track climate patterns and natural resources drives the adoption of remote sensing technology. Governments and private organizations use high-resolution satellite imagery for early warning systems, drought prediction, and land use monitoring. This technology supports disaster management, sustainable agriculture, and water resource planning. Enhanced imaging sensors and better spectral resolution improve the accuracy of real-time assessments. Increasing global climate challenges accelerate investments in satellite-based observation systems, making environmental monitoring one of the strongest market drivers.
- For instance, EnduroSat’s Gen3 satellite platform, unveiled in 2025, features a payload capacity of up to 70 kg for certain models (such as the FRAME SmallSat), peak power of up to 3.5 kW, and data throughput of 2 Gbps, enabling rapid transmission of high-resolution environmental data.
Expanding Use in Defense and Security Operations
Remote sensing technology plays a critical role in border surveillance, reconnaissance, and threat detection. Defense agencies use satellite and aerial imagery to track troop movements, detect unauthorized activities, and support strategic decision-making. The integration of AI with geospatial data enables faster analysis and more precise targeting. Growing geopolitical tensions and increased defense spending push governments to invest in advanced sensing systems. This steady demand from the military and defense sector fuels strong market expansion globally.
- For instance, Airbus' Pléiades Neo constellation consists of two active satellites (launched in 2021) and delivers 30 cm native resolution imagery. Each satellite weighs 920 kg, and the system provides a revisit time of twice a day at any point on Earth.
Technological Advancements and Cost Efficiency
Advancements in sensor miniaturization, cloud computing, and data processing are lowering operational costs. Modern satellites deliver higher-quality imagery at shorter revisit intervals, improving situational awareness across sectors. Open data initiatives and private satellite launches increase data availability, driving commercial adoption. Cloud-based analytics enable faster interpretation of large datasets, supporting industries such as agriculture, infrastructure, and energy. These advancements make remote sensing more accessible, cost-efficient, and scalable, accelerating its adoption across developed and emerging economies.
Key Trends & Opportunities
Growth of Commercial Satellite Constellations
Private companies are rapidly launching small satellite constellations to enhance global coverage. These networks provide near real-time imagery and offer high revisit rates for continuous monitoring. Businesses use this data for urban planning, environmental protection, and logistics optimization. Lower launch costs and shared satellite infrastructure are creating new opportunities for small and medium enterprises. This trend supports a strong commercial ecosystem, diversifying the market beyond traditional government applications.
- For instance, INVAP’s SAOCOM-1A and SAOCOM-1B satellites, launched in 2018 and 2020, each carry an L-band synthetic aperture radar with a 6.7 kW peak transmit power. Each satellite has a wet mass of around 1,600 kg and an overall launch mass of around 3,000 kg.
Integration of AI and Machine Learning in Data Analytics
AI and ML algorithms are transforming remote sensing data processing. These tools reduce manual analysis time and improve the accuracy of image classification and change detection. Automated pattern recognition helps industries such as agriculture, mining, and construction make faster operational decisions. Real-time analytics solutions enhance value-added services, driving demand for AI-integrated platforms. This integration creates new opportunities for analytics providers and technology developers.
- For instance, Blue Canyon Technologies offers the X-SAT Venus Class microsatellite platform, which supports a payload mass of 90 kg and has been used for various missions since its introduction.
Expansion in Precision Agriculture and Smart Infrastructure
Remote sensing supports efficient farm management and urban development. Farmers use satellite data for crop health monitoring, irrigation scheduling, and yield forecasting. Governments and private developers apply the technology for infrastructure planning and traffic management. Expanding adoption in precision agriculture and smart city projects is opening strong revenue opportunities. This growing commercial use is expected to strengthen the market’s long-term outlook.
Key Challenges
High Initial Investment and Operational Costs
Deploying remote sensing systems requires large capital investments for satellite manufacturing, launching, and maintenance. Data processing infrastructure and skilled labor also add to operational costs. These financial barriers limit adoption by smaller businesses and developing economies. While technology is becoming more affordable, the initial investment remains a significant challenge, especially for large-scale, high-resolution applications.
Data Privacy, Security, and Regulatory Restrictions
Data privacy and strict regulatory frameworks can restrict access to high-resolution imagery. Many countries impose limitations on satellite imaging over sensitive areas, affecting commercial use. Cybersecurity threats also raise concerns over the misuse of geospatial data. Navigating complex international regulations adds operational complexity for providers. These constraints can slow down market growth and limit expansion opportunities in sensitive regions.
Regional Analysis
North America
North America leads the remote sensing technology market with a 36% share, driven by strong investments in defense, environmental monitoring, and precision agriculture. The U.S. dominates regional growth through NASA, NOAA, and commercial satellite operators. High adoption of AI-driven analytics and advanced sensor technologies enhances the accuracy and speed of data interpretation. Strong regulatory frameworks and established infrastructure support large-scale satellite launches and data processing. Expanding applications in disaster management and urban planning further boost demand. Strategic collaborations between government agencies and private players strengthen North America’s leadership in the global market.
Europe
Europe holds a 27% share of the global market, supported by the European Space Agency’s Copernicus program and strong climate initiatives. Countries like Germany, France, and the U.K. are major contributors to satellite deployment and earth observation missions. The region emphasizes environmental protection, agricultural optimization, and urban sustainability. Robust R&D investments and collaborative space projects enhance data accuracy and availability. Growing commercial demand from infrastructure, forestry, and maritime sectors further supports market growth. Strict environmental regulations and climate monitoring policies make Europe a strategic hub for remote sensing technology development and adoption.
Asia Pacific
Asia Pacific accounts for a 22% share and is the fastest-growing region in the remote sensing technology market. China, India, and Japan are expanding satellite constellations and investing heavily in earth observation programs. Rapid urbanization, climate challenges, and agricultural modernization drive adoption across industries. National space agencies and private firms are deploying small satellites for crop monitoring, disaster response, and resource mapping. The rise of cloud-based data platforms improves access for commercial users. Strong government support and increasing private investments position Asia Pacific as a key growth engine in the global market.
Latin America
Latin America captures a 9% market share, driven by increasing use of satellite imagery for agriculture, mining, and environmental conservation. Brazil, Chile, and Argentina lead regional adoption with projects focused on deforestation control and natural resource mapping. Government agencies are partnering with international space organizations to access high-resolution data. The growing need for precision agriculture and natural disaster management strengthens market demand. Though infrastructure remains limited, expanding public-private initiatives and cloud technology are improving accessibility. This growing adoption supports steady expansion of remote sensing applications in key industries across Latin America.
Middle East & Africa
The Middle East & Africa region holds a 6% market share, with growing interest in remote sensing for resource management, defense, and infrastructure planning. Countries like the UAE, Saudi Arabia, and South Africa are investing in satellite programs to support national development goals. Applications include water resource mapping, land use monitoring, and urban development. Rising environmental challenges and climate adaptation programs create strong opportunities for market growth. While technical capacity is developing, increasing collaborations with international organizations and technology providers are accelerating the region’s participation in the global remote sensing landscape.
Market Segmentations:
By Satellite Mass:
- Less than 100 kg
- 100 -500 KG
By Application:
- Weather forecasting
- Agriculture and forestry farming
By End User:
- Military
- Others
By Geography
- North America
- U.S.
- Canada
- Mexico
- Europe
- Germany
- France
- U.K.
- Italy
- Spain
- Rest of Europe
- Asia Pacific
- China
- Japan
- India
- South Korea
- South-east Asia
- Rest of Asia Pacific
- Latin America
- Brazil
- Argentina
- Rest of Latin America
- Middle East & Africa
- GCC Countries
- South Africa
- Rest of the Middle East and Africa
Competitive Landscape
The competitive landscape of the remote sensing technology market is shaped by key players such as Dhruva Space, Boeing, EnduroSat, Airbus, INVAP, Blue Canyon Technologies, BAE Systems, Indian Space Research Organisation, Lockheed Martin, and Beijing Smart Satellite. The remote sensing technology market is defined by rapid innovation, strategic collaborations, and rising private sector participation. Companies are focusing on enhancing imaging resolution, reducing satellite weight, and integrating advanced AI-driven analytics to gain a competitive edge. Government and commercial partnerships are expanding satellite coverage and improving real-time data accessibility. Investment in small satellite constellations and cost-efficient launch solutions is increasing global market reach. Defense modernization, environmental monitoring, and agricultural applications are further accelerating demand. Strong R&D capabilities, robust infrastructure, and scalable technologies continue to shape competitive strategies across the industry.
Key Player Analysis
- Dhruva Space
- Boeing
- EnduroSat
- Airbus
- INVAP
- Blue Canyon Technologies
- BAE Systems
- Indian Space Research Organisation
- Lockheed Martin
- Beijing Smart Satellite
Recent Developments
- In March 2025, Comptroller and Auditor General (CAG) of India signed an agreement with the Bhaskaracharya National Institute of Space Application and Geo-informatics (BISAG-N) to leverage advanced technologies in geographic information systems and remote sensing.
- In January 2024, TeamViewer, in collaboration with Almer, introduced an innovative AR (Augmented Reality) bundle with a subscription-driven software/hardware bundle and combined marketing activities.
- In July 2023, Hexagon, a company in digital reality solutions, acquired HARD-LINE, a Canada-based automation company specializing in mining operations. This acquisition strengthened Hexagon's position in the mining industry and helped the company offer a more comprehensive suite of solutions for mine operators.
- In January 2023, Airbus Defence and Space signed a contract with Poland to deliver a complete geospatial intelligence system. This deal covers the creation, manufacturing, launch, and in-orbit delivery of two advanced optical Earth observation satellites.
Report Coverage
The research report offers an in-depth analysis based on Satellite Mass, Application, End-User and Geography. It details leading market players, providing an overview of their business, product offerings, investments, revenue streams, and key applications. Additionally, the report includes insights into the competitive environment, SWOT analysis, current market trends, as well as the primary drivers and constraints. Furthermore, it discusses various factors that have driven market expansion in recent years. The report also explores market dynamics, regulatory scenarios, and technological advancements that are shaping the industry. It assesses the impact of external factors and global economic changes on market growth. Lastly, it provides strategic recommendations for new entrants and established companies to navigate the complexities of the market.
Future Outlook
- The market will see strong growth with rising use in environmental and climate monitoring.
- Advanced satellite constellations will enhance global coverage and revisit rates.
- AI and machine learning integration will improve real-time data processing and decision-making.
- Defense and security applications will continue to drive major technology investments.
- Precision agriculture will emerge as a key commercial growth area.
- Cloud-based platforms will expand accessibility and reduce operational complexity.
- Public-private collaborations will increase innovation and lower launch costs.
- Miniaturized and modular satellites will enable flexible and cost-effective deployments.
- Regulatory frameworks will evolve to address data privacy and security challenges.
- Emerging economies will adopt remote sensing technology to support infrastructure and resource planning.
Request a Free Sample
Fill in your details and we'll send you a free sample report.
- Sample data tables & charts
- Research methodology
Need a Custom Version of This Report?
Tailor the scope, geography, or segments to your exact requirements.
- Custom geography or segment scope
- Direct access to our analyst team
Frequently Asked Questions
What is the current market size for the Remote Sensing Technology Market, and what is its projected size in 2032?
At what Compound Annual Growth Rate is the Remote Sensing Technology Market projected to grow between 2025 and 2032?
Which Remote Sensing Technology Market segment held the largest share in 2024?
What are the primary factors fueling the growth of the Remote Sensing Technology Market?
Who are the leading companies in the Remote Sensing Technology Market?
Which region commanded the largest share of the Remote Sensing Technology Market in 2024?
Table of Content
Chapter 1. Report Introduction
- 1.1 Report Description & Purpose
- 1.1.1 Report Title & Market Definition
- 1.1.2 Unique Selling Propositions (USP) & Key Differentiators
- 1.1.3 Value Proposition for Stakeholders
- 1.2 Research Objectives
- 1.2.1 Market Sizing Objectives (Volume & Revenue)
- 1.2.2 Segmentation Objectives
- 1.2.3 Competitive Intelligence Objectives
- 1.2.4 Forecast & Scenario Objectives
- 1.3 Report Scope
- 1.3.1 Remote Sensing Technology Scope – Types & Subtypes Covered
- 1.3.2 Geographic Scope – Regions & Countries Covered
- 1.3.3 Historical Period, Base Year & Forecast Period (2024; forecast to 2032)
- 1.3.4 Inclusions & Exclusions
- 1.4 HS Code & Classification Framework
- 1.5 Currency, Units & Pricing Basis
- 1.6 Target Stakeholders
- 1.7 Limitations & Assumptions
Chapter 2. Executive Summary
- 2.1 Global Remote Sensing Technology Market Snapshot
- 2.1.1 Market Size – Historical (2024) & Forecast (2024-2032) (2024: USD 17.2 billion → 2032: USD 46.3 billion)
- 2.1.2 Volume & Revenue – Global Totals
- 2.1.3 Key Market Highlights – Top Five Facts
- 2.2 Remote Sensing Technology Market Segmentation Snapshot
- 2.2.1 Market Split by Region – 2024 vs. 2032
- 2.3 Competitive Snapshot
- 2.3.1 Top 10 Players by Revenue Share – 2024
- 2.3.2 Top 10 Players by Volume Share – 2024
- 2.3.3 Recent Strategic Developments (18-Month Summary)
- 2.4 Key Investment Highlights & Strategic Conclusions
Chapter 3. Remote Sensing Technology Market Dynamics & Industry Analysis
- 3.1 Market Overview & Context
- 3.1.1 Remote Sensing Technology Market Position in the Broader Automotive Value Chain
- 3.1.2 OEM vs. Replacement Market Dynamics
- 3.1.3 Market Maturity & Development Stage by Region
- 3.2 Remote Sensing Technology Market Drivers
- 3.3 Remote Sensing Technology Market Restraints & Challenges
- 3.4 Remote Sensing Technology Market Opportunities
- 3.5 Porter's Five Forces Analysis
- 3.5.1 Threat of New Entrants
- 3.5.2 Bargaining Power of Suppliers
- 3.5.3 Bargaining Power of Buyers
- 3.5.4 Threat of Substitutes
- 3.5.5 Competitive Rivalry – Intensity Assessment
- 3.6 Remote Sensing Technology Value Chain Analysis
- 3.6.1 Upstream – Raw Material/Input Suppliers
- 3.6.1.1 Raw Material/Input 1
- 3.6.1.2 Raw Material/Input 2
- 3.6.1.3 Raw Material/Input 3
- 3.6.2 Midstream – Production/Manufacturing/Service Delivery
- 3.6.2.1 Production/Process Overview
- 3.6.2.2 Key Facility Locations & Capacity by Manufacturer
- 3.6.3 Downstream – Distribution & End Consumer
- 3.6.3.1 Primary Channel – B2B/OEM
- 3.6.3.2 Secondary Channels – Dealer, Retail, Online, Direct
- 3.6.4 Value Chain Profitability Analysis
- 3.6.1 Upstream – Raw Material/Input Suppliers
- 3.7 PESTEL Analysis
- 3.7.1 Political Factors
- 3.7.2 Economic Factors
- 3.7.3 Social Factors
- 3.7.4 Technological Factors
- 3.7.5 Environmental Factors
- 3.7.6 Legal Factors
- 3.8 Remote Sensing Technology Supply Chain Analysis
- 3.8.1 Raw Material/Input Supply Risk Assessment
- 3.8.2 Manufacturing Concentration Risk (Geographic Exposure)
- 3.8.3 Trade Disruption Impact Analysis
- 3.9 Regulatory & Policy Landscape
Note: The regulatory and policy landscape section covers regulations based on their applicability to the market, Remote Sensing Technology category, geography, and scope of the study. Only regulatory frameworks with a material impact on operations, compliance, trade, sustainability, or market access are analyzed in detail.
Chapter 4. Key Investment Pockets & Opportunity Analysis
- 4.1 Remote Sensing Technology Market Attractiveness Analysis
- 4.1.1 By Region – Investment Attractiveness Matrix (Volume × CAGR)
- 4.2 Absolute Revenue Growth Opportunity
- 4.2.1 By Region – Absolute USD Growth Through 2032
- 4.3 Incremental Volume Opportunity
- 4.3.1 By Region – Incremental Volume Through 2032
- 4.3.2 Segment – Incremental Volume
- 4.4 Emerging Submarket Opportunity Deep Dive (Subject to Applicability)
- 4.5 Emerging Market Opportunity Scorecards
- 4.5.1 United States
- 4.5.2 Europe
- 4.5.3 Asia
- 4.5.4 Middle East & Africa
Note: Emerging Market Opportunity Scorecards will be included based on relevance and strategic importance. Regions listed are indicative and may vary depending on data availability and market dynamics.
Chapter 5. Remote Sensing Technology Import-Export Analysis & Trade Flows
- 5.1 Global Trade Overview
- 5.1.1 Global Export Value by Country (2024)
- 5.1.2 Global Export Volume by Country (2024)
- 5.1.3 Global Import Value by Country (2024)
- 5.1.4 Global Import Volume by Country (2024)
- 5.1.5 Net Trade Balance by Country (2024)
- 5.2 Export Analysis – Segment
- 5.2.1 Type 1 (HS Code)
- 5.2.2 Type 2 (HS Code)
- 5.2.3 Type 3 (HS Code)
- 5.2.4 Type 4 (HS Code)
- 5.2.5 Type 5 (HS Code)
- 5.3 Import Analysis – Segment
- 5.3.1 Type 1 (HS Code)
- 5.3.2 Type 2 (HS Code)
- 5.3.3 Type 3 (HS Code)
- 5.3.4 Type 4 (HS Code)
- 5.3.5 Type 5 (HS Code)
- 5.4 Average Unit Trade Prices
- 5.4.1 Average Export Price – Segment & Country
- 5.4.2 Average Import Price – Segment & Source Country
- 5.4.3 Price Trends (2024)
- 5.5 Key Trade Route Analysis
- 5.5.1 Trade Route 1
- 5.5.2 Trade Route 2
- 5.5.3 Trade Route 3
- 5.5.4 Trade Route 4
- 5.5.5 Trade Route 5
- 5.6 Trade Policy Impact Assessment
- 5.6.1 US Anti-Dumping & Section 301 Tariffs
- 5.6.2 EU Customs Union Impact
- 5.6.3 Major Free Trade Agreements
- 5.6.4 USMCA Rules of Origin
Note: Trade policy analysis will be included only where relevant to the Remote Sensing Technology market.
Chapter 6. Competitive Landscape & Company Benchmarking
- 6.1 Remote Sensing Technology Market Concentration & Structure
- 6.1.1 Herfindahl-Hirschman Index (HHI) – vs. 2024
- 6.1.2 Tier 1, Tier 2 & Tier 3 Market Structure
- 6.1.3 Global, Regional & Local Player Dynamics
- 6.2 Remote Sensing Technology Market Share Analysis – 2024
- 6.2.1 Global Revenue Share by Company
- 6.2.2 Global Volume Share by Company
- 6.2.3 Regional Revenue Share
- 6.2.4 Market Share Evolution ( vs. 2024)
- 6.2.5 OEM Segment Share by Company
- 6.2.6 Replacement Segment Share by Company
- 6.3 Production/Delivery Capacity & Facility Analysis
- 6.3.1 Global Installed Capacity
- 6.3.2 Capacity Utilization Rates
- 6.3.3 Production/Output Volume
- 6.3.4 Facility Locations & Capacity Map
- 6.3.5 Planned Capacity Additions
- 6.4 Remote Sensing Technology Competitive Benchmarking Matrix
- 6.4.1 Revenue, Volume, CAGR & Profitability Comparison
- 6.4.2 Channel Revenue Mix
- 6.4.3 Geographic Revenue Exposure
- 6.4.4 R&D Intensity
- 6.4.5 Sustainability Maturity
- 6.5 Strategic Developments in Remote Sensing Technology (Last 24 Months)
- 6.5.1 Mergers, Acquisitions & Divestments
- 6.5.2 New Remote Sensing Technology Launches
- 6.5.3 Facility Expansions
- 6.5.4 Strategic Alliances, Joint Ventures & Partnerships
- 6.5.5 Distribution Expansion & Market Entry
- 6.5.6 Sustainability & ESG Initiatives
- 6.6 Competitive Strategy Mapping
- 6.6.1 Leader, Challenger, Follower & Niche Classification
- 6.6.2 Pricing Strategy Comparison
- 6.6.3 Channel Strategy Matrix
Note: Strategic developments are included based on their materiality and the availability of reliable information.
Chapter 7. Global Remote Sensing Technology Market – By Distribution Channel
- 7.1 Segment Overview
- 7.1.1 Volume & Revenue Split by Channel (2024 & 2032)
- 7.1.2 Channel Mix Evolution (2024-2032)
Chapter 8. Regional Market Analysis – Global Overview
- 8.1 Global Regional Overview
- 8.1.1 Regional Volume Share
- 8.1.2 Regional Revenue Share
- 8.1.3 Regional Volume by Region
- 8.1.4 Regional Revenue by Region
- 8.1.5 Regional Forecast Through 2032
- 8.2 Cross-Regional Segment Analysis
- 8.2.1 By Distribution Channel
- 8.2.2 By Brand/Price Tier
Chapter 9. North America Remote Sensing Technology Market
- 9.1 United States
- 9.2 Canada
- 9.3 Mexico
Chapter 10. Europe Remote Sensing Technology Market
- 10.1 Germany
- 10.2 France
- 10.3 Italy
- 10.4 United Kingdom
- 10.5 Spain
- 10.6 Poland
- 10.7 Russia
- 10.8 Netherlands
- 10.9 Belgium
- 10.10 Sweden
- 10.11 Denmark
- 10.12 Norway
- 10.13 Rest of Europe
Chapter 11. Asia Pacific Remote Sensing Technology Market
- 11.1 China
- 11.2 India
- 11.3 Japan
- 11.4 South Korea
- 11.5 Thailand
- 11.6 Indonesia
- 11.7 Vietnam
- 11.8 Malaysia
- 11.9 Australia
- 11.10 Rest of Asia Pacific
Chapter 12. Latin America Remote Sensing Technology Market
- 12.1 Brazil
- 12.2 Argentina
- 12.3 Colombia
- 12.4 Chile
- 12.5 Rest of Latin America
Chapter 13. Middle East Remote Sensing Technology Market
- 13.1 Saudi Arabia
- 13.2 United Arab Emirates
- 13.3 Turkey
- 13.4 Israel
- 13.5 Iran
- 13.6 Rest of the Middle East
Chapter 14. Africa Remote Sensing Technology Market
- 14.1 South Africa
- 14.2 Egypt
- 14.3 Nigeria
- 14.4 Morocco
- 14.5 Rest of Africa
Chapter 15. Remote Sensing Technology Company Profiles
- 15.1 [Company 01]
- 15.1.1 Company Overview
- 15.1.2 Key Management Personnel
- 15.1.3 Products & Services Portfolio
- 15.1.4 Financial Performance
- 15.1.5 Key Market Focus & Geographic Presence
- 15.1.6 Recent Developments & Strategic Initiatives
Note: The company profile list is preliminary and may change based on research findings, market developments, data availability, and client requirements.
Chapter 16. Appendices
- Appendix A – List of Abbreviations & Acronyms
- Appendix B – Industry Classification Code Reference – Full Series
- Appendix C – Production & Capacity Data Tables
- Appendix D – End-Use & Demand Base Tables
- Appendix E – Consumption & Replacement Rate Assumptions
- Appendix F – ASP Reference Tables
- Appendix G – Manufacturing & Facility Database
- Appendix H – Import-Export Data Tables
- Appendix I – Regulatory Summary Tables
- Appendix J – Primary Research Participant List (Anonymized)
- Appendix K – Primary Research Questionnaire Framework
- Appendix L – Data Sources & Bibliography
- Appendix M – Market Size Divergence & Source Comparison
Chapter 17. Research Methodology
- 17.1 Research Framework & Philosophy
- 17.2 Secondary Research – Sources, Hierarchy & Data Extraction
- 17.3 Data Modeling – Bottom-Up & Top-Down Market Sizing
- 17.4 Primary Research – Stakeholder Framework, LOI & Sample Sizes
- 17.5 Forecast Methodology – Regression, Scenario & Sensitivity Analysis
- 17.6 Quality Control – Four-Layer Validation Framework
- 17.7 Limitations & Standard Assumptions
- 17.8 Disclaimer
