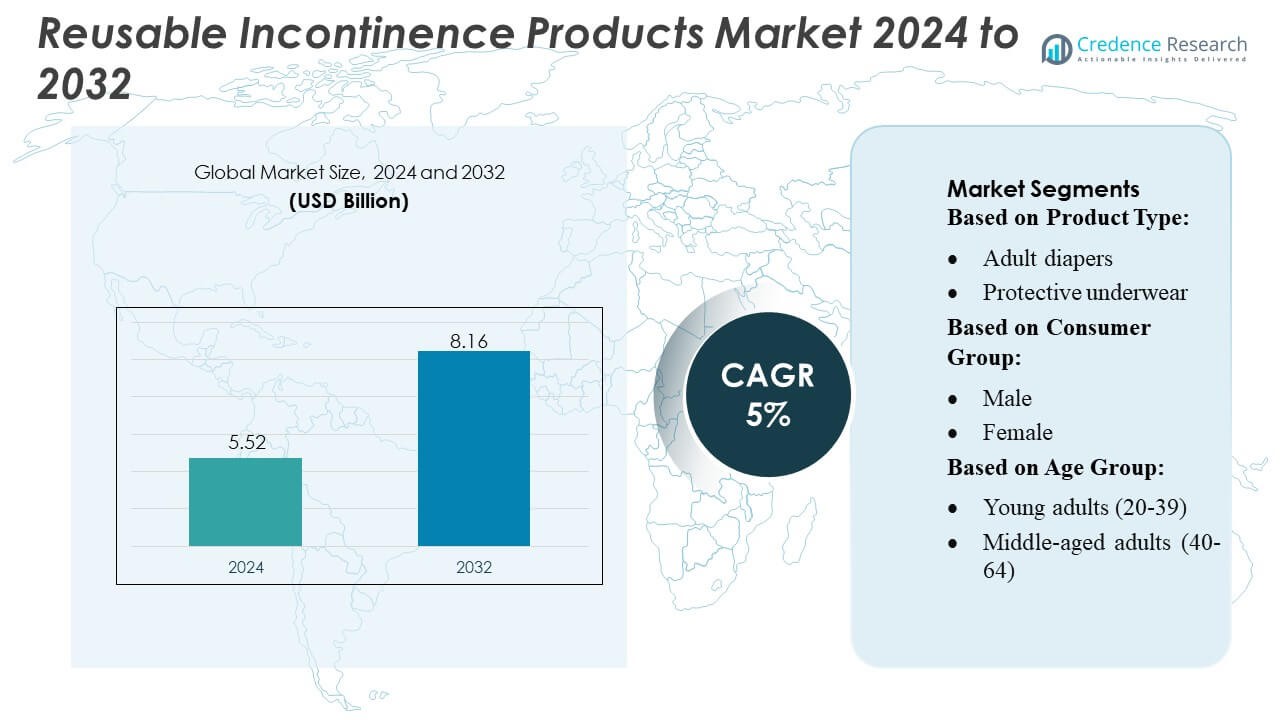
Home » Healthcare » Reusable Incontinence Products Market

Reusable Incontinence Products Market By Product Type (Adult Cloth Diaper, Reusable Incontinence Pads), By Sales Channel (Direct Sales, Hypermarkets/ Supermarkets, Convenience Stores)- Growth, Future Prospects & Competitive Analysis, 2023 – 2030

Price: $4999

Published: | Report ID: 20854 | Report Format : PDF

Key Highlights of the Report

The global Reusable Incontinence Products Market is divided into Product Type, End-User, Price Range, Size, Sales Channel, and Region. Adult cloth diapers are the most popular reusable incontinence products, with women reusable incontinence products and kids reusable incontinence products are being the two main products sectors. The most commonly utilized size and sales channel categories are medium reusable incontinence products and supermarket/hypermarket channels, respectively. The Mass/Economic (US$ 10-75) Reusable Incontinence Products category dominates the price range of the market, with North America dominating the market growth. The global reusable incontinence products market is driven by numerous factors, including product development and adult population growth. Furthermore, limited availability and disposable products pose a risk. However, the market confronts considerable hurdles, such as the Stigma, a lack of awareness, and competition from throwaway items. Nonetheless, the global Reusable incontinence products market provides considerable potential opportunities, owing to rising interest in eco-friendly solutions and an aging population. Furthermore, there is an increasing demand for low-cost incontinence control solutions for the future..

Market Overview

The global Reusable incontinence products market has witnessed steady growth in recent years and is expected to continue growing at a CAGR of 6.30% between 2023 and 2030. The market was valued at USD 515.9 Million in 2022 and is expected to reach USD 791.2 Million in 2030.

What Are the Primary Drivers of the Global Market for Reusable Incontinence Products?

Several factors influence the global market for reusable incontinence products, including product development and adult population growth.

What Are the Major Challenges Facing the Global Market for Reusable Incontinence Products?

The global market for reusable incontinence products confronts a number of obstacles, including stigma, a lack of awareness, and competition from disposable alternatives.

What Are the Global Growth Prospects for Reusable Incontinence Products?

The global market for reusable incontinence products is poised for tremendous development, thanks to rising interest in eco-friendly solutions and an aging population.

Reusable incontinence products market

Executive Summary

Overview of the Global Reusable Incontinence Products Market

The market for reusable incontinence products has been continuously developing due to increased awareness of incontinence and a desire for more eco-friendly and cost-effective alternatives. Products on the market include washable underwear, reusable pads, and cloth diapers, which can be used numerous times before being discarded. These items are intended to be comfy, absorbent, and simple to clean. An aging population, increased healthcare expenditures, and a growing tendency toward sustainability are driving the industry. The market is predicted to expand as more people become aware of reusable incontinence products and seek out more sustainable and cost-effective incontinence management options.

Design Element 2

Access crucial information at unmatched prices!

Request your free sample report today & start making informed decisions powered by Credence Research!

Download Free Sample
CTA Design Element 3

Market Definition

The reusable incontinence products market refers to the industry that manufactures and sells washable and reusable goods used to manage urine or fecal incontinence. Cloth diapers, reusable pads, and washable underwear are examples of these products. The market exists to satisfy the demands of people who have incontinence and seek more sustainable and cost-effective alternatives to throwaway items.

Market Insights

  • The global demand for Reusable incontinence products was valued at USD 515.9 Million in 2022 and is expected to reach USD 791.2 Million in 2030, growing at a CAGR of 6.30% between 2023 and 2030.
  • In 2022, reusable incontinence pads accounted for 32% of total sales, Adult cloth diapers are the market’s second most popular product.
  • The women’s reusable incontinence goods market governs global demand for reusable incontinence products, with the rest of the demand coming from the kids market.
  • While the Premium (US$ 75 & Above) Reusable Incontinence Products segment is predicted to have the industry’s highest CAGR (Compound Annual Growth Rate), the Mass/Economic (US$ 10-75) Reusable Incontinence Products segment dominates the reusable incontinence product market.
  • These items are often smaller in size than the Medium and Large Reusable Incontinence Goods sectors, but they have less absorbency. Despite having a smaller market share than larger segments, the medium-sized sector is the most in demand in the industry.
  • Hypermarkets/supermarkets sell the most reusable incontinence pads, accounting for 16.2% of total revenue. Convenience stores, as well as specialty stores, contribute to the demand for reusable incontinence supplies.
  • North America dominates the incontinence products market, accounting for around 40% of the global market share in 2022, the Asia Pacific area is predicted to be the fastest-growing region in the market.
  • Product Development and Adult Population Growth are the major drivers of the market.
  • Limited Availability and Disposable Products Pose a Risk are the main restraints.
  • Increasing Interest in Eco-Friendly Solutions and an Aging Population are the major opportunities in the market.

Segmentation by Product Type

  • In 2022, reusable incontinence pads accounted for 32% of total sales.
  • Adult cloth diapers are the market’s second most popular product.

Segmentation by End-User

  • The women’s reusable incontinence goods market governs global demand for reusable incontinence products.
  • The rest of the demand for reusable incontinence products comes from the kids market

Segmentation by Price Range

  • The Premium (US$ 75 & Above) Reusable Incontinence Products segment is expected to have the highest CAGR (Compound Annual Growth Rate) in the market.
  • The Mass/Economic (US$ 10-75) Reusable Incontinence Products segment dominates the reusable incontinence product market.

Segmentation by Size

  • These goods are usually smaller in size than the Medium and Large Reusable Incontinence goods sectors; however they have a lesser absorbency. Although a small segment may have a smaller market share than larger segments.
  • The medium-sized sector is the most in demand in the market.

Segmentation by Sales Channel

  • Reusable incontinence pads are most commonly sold in hypermarkets/supermarkets, accounting for 16.2% of total revenue.
  • Convenience stores and specialized stores, among others, add to the demand for reusable incontinence products.

Segmentation by Region

  • North America dominates the incontinence products market, accounting for around 40% of the global market share in 2022.
  • The Asia Pacific area is predicted to be the fastest-growing region in the market.
  • The rest of the World, including Latin America, The Middle East, and Africa, contributes the remainder to the demand for Reusable incontinence productss.

The growing demand for reusable incontinence products can be linked to product development and adult population growth. However, the market is constrained by limited availability, and disposable products pose a risk. The Asia Pacific area is predicted to be the fastest-growing region in the market due to rising healthcare expenditure, increased awareness of incontinence, and increased usage of home healthcare services. In addition, the region’s elderly population is boosting demand for incontinence goods. North America is the largest market for incontinence goods, owing to the region’s high prevalence of incontinence and the availability of modern healthcare infrastructure. Europe is another big market for incontinence goods, driven by an older population and a rising emphasis on sustainability. The Middle East and Africa area is expected to expand slowly due to a lack of healthcare infrastructure and a lack of knowledge about incontinence. However, due to rising healthcare costs and increased awareness of incontinence, the region is likely to present prospects for growth in the long run. Overall, the incontinence products market is predicted to rise in the next years due to a variety of demographic and industry variables. Companies competing in the market must be prepared to negotiate a variety of difficulties and opportunities in order to compete effectively and capture market share.

Product innovation

Because of the introduction of new and improved goods, incontinence products are quickly becoming a lucrative sector. The introduction of solutions with improved absorbency levels, odour control, and breathability has resulted in the removal of the taboo and social shame associated with adult incontinence and the usage of adult diapers. This is also raising awareness about incontinence products for overactive bladders and bowels. Patients are becoming more upfront about their requirements for secrecy, aesthetics, and comfort, prompting manufacturers to introduce new products suitable for a wide range of consumers. For example, Essity announced New ConfioAir Breathable Technology in November 2017, which will be used in the production of all of the company’s briefs, underwear, and other incontinente goods. Similar product launches are expected to fuel the growth of the incontinence care products market.

Adult Population Growth

Adults experience incontinence on a regular basis. One of the major factors driving the growth of the incontinence devices market is the growing geriatric population. By the end of 2050, there will be 2 Million individuals in the globe who are 60 years of age or older, up from 900 million in 2015. This, together with the rising prevalence of incontinence, is expected to drive the incontinence product market forward. Furthermore, rising internet channel and e-commerce penetration, as well as the growing adoption of home care services for aged care, are projected to favour the expansion of incontinence care goods.

Limited Availability

While there is an increasing need for eco-friendly and cost-effective incontinence management options, many locations still lack access to reusable items. This might impede market growth and make it difficult for enterprises to reach their intended audience. The restricted availability of reusable incontinence products can be attributed to a number of problems, including insufficient distribution channels, limited production capacity, and expensive costs. To accommodate rising demand, enterprises must work to extend their distribution networks and enhance production capacity. Additionally, they may need to investigate alternate manufacturing methods or materials in order to lower costs and make their products more accessible to a wider audience. Companies can contribute to fuel the growth of the reusable incontinence products market and meet the demands of those who experience incontinence by solving the issue of restricted supply.

Disposable Products Pose a Threat

While reusable items are more environmentally friendly and cost-effective for managing incontinence, disposable goods are more commonly available and may be more convenient for some people. This may hinder the growth of the market for reusable incontinence products and make it difficult for firms to reach their target audience. Disposable goods are generally more readily available in stores and online, making them a more appealing choice for people who have incontinence. Furthermore, disposable products are frequently more heavily marketed than reusable ones, making it difficult for reusable products to achieve market momentum. To overcome this obstacle, businesses must try to differentiate their products from disposable alternatives while also educating potential customers about the benefits of utilizing reusable items. This could involve emphasizing the financial savings and environmental advantages of adopting reusable goods, as well as their effectiveness and comfort. Companies can help to overcome the competition from disposable goods and boost the growth of the reusable incontinence products market by distinguishing their products and raising awareness of their benefits.

Growing Interest in Eco-Friendly Solutions

There is an increasing interest in reusable alternatives as people become more aware of the environmental impact of disposable products. This trend is fueling demand for reusable incontinence devices, which provide a more sustainable option for incontinence management. Reusable incontinence products are constructed of materials that can be washed and reused, lowering waste and the environmental effect of incontinence management. Furthermore, reusable items might be more cost-effective over time, making them an appealing choice for people who have incontinence. Companies must seek to develop high-quality, eco-friendly products that fulfill the needs of their target audience in order to benefit on this potential. This could include experimenting with different materials or production methods to lessen the environmental effect of their products, as well as engaging in marketing and education to raise knowledge of the benefits of adopting reusable items. Companies can help satisfy the growing demand for eco-friendly solutions and promote the growth of the reusable incontinence products market by concentrating on eco-friendliness and sustainability.

Increasingly Aging Population

The prevalence of incontinence is predicted to rise as the population ages, fueling demand for incontinence products. This trend is generating a big potential for reusable incontinence products, which provide a more cost-effective and long-term solution for incontinence management. Reusable incontinence devices are frequently less expensive than disposable options, making them an appealing option for people who have incontinence. Furthermore, reusable goods can be more comfortable and effective than disposable ones, which can assist enhance the quality of life for people who have incontinence. Companies must seek to develop high-quality, effective goods that address the needs of the aging population in order to profit on this potential. This might involve investing in R&D to increase the comfort and effectiveness of their products, as well as marketing and education to raise knowledge of the advantages of utilizing reusable items. Companies can help fulfill the growing demand for incontinence products and fuel the expansion of the reusable incontinence products market by concentrating on the demands of the aging population and providing high-quality, effective products.

Increased Healthcare Spending

The rising cost of healthcare is another big opportunity in the reusable incontinence products market. As healthcare costs rise, there is a greater need for cost-effective incontinence management solutions. This trend is boosting demand for reusable incontinence solutions, which provide a more cost-effective and long-term solution for incontinence management. Reusable incontinence devices are frequently less expensive than disposable options, making them an appealing option for people who have incontinence. Furthermore, reusable goods can be more comfortable and effective than disposable ones, which can assist enhance the quality of life for people who have incontinence. Companies must seek to develop high-quality, effective goods that fulfill the needs of the healthcare business in order to profit on this potential.

Competitive Landscape

Key Players

The global Reusable incontinence products market is highly competitive, with the presence of several key players. Some of the major players in the market and their market share are as follows:

  • Kimberly-Clark Corporation
  • The Proctor & Gamble Company
  • MediFabrik SRL
  • Cardinal Health, Inc.
  • Essity AB
  • Medline Industries, Inc.
  • Ontex International N.V.
  • Attindas Hygiene Partners
  • Activ Medical Disposable
  • Paul Hartmann AG
  • Nexwear
  • Prime Life Fibers
  • Royal Medical Solutions, Inc.
  • Abena Group
  • Unicharm Corporation
  • Prevail
  • Dryloch Technologies NV
  • Others

These companies focus on product innovation, expanding their Price Ranges, and mergers and acquisitions to stay ahead in the market. The major players in the global Reusable incontinence products market are constantly striving to stay ahead by introducing new products and innovations. Kimberly-Clark Corporation purchased a majority share in Thinx Inc. in February 2022. The latter is a disruptor and market leader in reusable period and incontinence underwear. In the long run, the acquisition has helped Kimberly-Clark to better handle bladder leak and incontinence issues. Royal Medical Solutions Inc. provides a variety of washable waterproof underpads and bed pads for incontinence control. These pads are specifically intended for those with disabilities or who have bodily dysfunctions. These pads are ideal for older individuals.

Shape Your Report to Specific Countries or Regions & Enjoy 30% Off!

Summary of Key Findings

  • Product Development and Adult Population Growth driving market growth
  • Market segmented by Product Type, End-User, Price Range, Size, Sales channel and region.
  • In 2022, reusable incontinence pads accounted for 32% of total sales.
  • The Premium (US$ 75 & Above) Reusable Incontinence Products segment is expected to have the highest CAGR (Compound Annual Growth Rate) in the market.
  • North America is leading market growth; the market is highly competitive with key players including Kimberly-Clark Corporation, The Proctor & Gamble Company, MediFabrik SRL, Cardinal Health, Inc.

Future Outlook

  • Reusable incontinence products are becoming increasingly popular.
  • Rising healthcare costs
  • The introduction of smart incontinence products
  • A growing emphasis on sustainability
  • Increased reliance on e-commerce
  • Growing public awareness of incontinence and its impact on quality of life
  • Technological developments propelling product innovation
  • Demand for incontinence products is being driven by an aging population.
  • Increased use of home healthcare services
  • Increasing demand for low-cost incontinence management solutions

Segmentation

By Product Type-

  • Adult Cloth Diaper
  • Reusable Incontinence Pads
  • Reusable Underpads

By End User-

  • Men Reusable Incontinence Products
  • Women Reusable Incontinence Products
  • Kids Reusable Incontinence Products

By Price Range-

  • Mass/Economic (US$ 10-75) Reusable Incontinence Products
  • Premium (US$ 75 & Above) Reusable Incontinence Products

By Size-

  • Small Reusable Incontinence Products
  • Medium Reusable Incontinence Products
  • Large Reusable Incontinence Products
  • X-Large Reusable Incontinence Products

By Sales Channel-

  • Direct Sales
  • Hypermarkets/ Supermarkets
  • Convenience Stores
  • Departmental Stores
  • Mono brand Stores
  • Specialty Stores
  • Drug Stores
  • Others

By Region

  • North America
    • Canada
    • Mexico
  • Europe
    • Germany
    • France
    • U.K.
    • Italy
    • Spain
    • Rest of Europe
  • Asia Pacific
    • China
    • Japan
    • India
    • South Korea
    • South-east Asia
    • Rest of Asia Pacific
  • Latin America
    • Brazil
    • Argentina
    • Rest of Latin America
  • Middle East & Africa
    • GCC Countries
    • South Africa
    • Rest of Middle East and Africa

1. Preface
1.1. Report Description
1.1.1. Purpose of the Report
1.1.2. Target Audience
1.1.3. USP and Key Offerings
1.2. Research Scope
1.3. Research Methodology
1.3.1. Phase I – Secondary Research
1.3.2. Phase II – Data Modelling
1.3.2.1. Company Share Analysis Model
1.3.2.2. Revenue Based Modelling
1.3.3. Phase III – Primary Research
1.3.4. Research Limitations
1.3.5. Assumptions
1.4. Market Introduction
1.5. Market Research Scope

2. Executive Summary
2.1. Market Snapshot: Global  Reusable incontinence products market
2.2. Global  Reusable incontinence products market, By Product Type
2.3. Global  Reusable incontinence products market, By End-User
2.4. Global  Reusable incontinence products market, By Price Range
2.5. Global  Reusable incontinence products market, By Size
2.6. Global  Reusable incontinence products market, By Sales Channel
2.7. Global  Reusable incontinence products market, By Region

3. Market Dynamics & Factors Analysis
3.1. Introduction
3.1.1.Global  Reusable incontinence products market Value, 2017-2030, (US$ Bn)
3.1.2.Y-o-Y Growth Trend Analysis
3.2. Market Dynamics
3.2.1.Market Drivers
3.2.2.Market Restraints
3.2.3.Market Opportunities
3.2.4.Major Industry Challenges
3.3. Growth and Development Patterns
3.4. Investment Feasibility Analysis
3.5. Market Opportunity Analysis
3.5.1.Type
3.5.2.End-User
3.5.3.Price Range
3.5.4.Size
3.5.5.Sales Channel
3.5.6.Geography

4. Premium Insights
4.1. STAR (Situation, Task, Action, Results) Analysis
4.2. Porter’s Five Forces Analysis
4.2.1.Threat of New Entrants
4.2.2.Bargaining Power of Buyers/Consumers
4.2.3.Bargaining Power of Suppliers
4.2.4.Threat of Substitute Types
4.2.5Intensity of Competitive Rivalry
4.3. Key Market Trends
4.3.1.Demand Side Trends
4.3.2.Supply Side Trends
4.4. Value Chain Analysis
4.5. Type Analysis
4.6. Analysis and Recommendations
4.7. Marketing Strategy Analysis
4.7.1.Direct Marketing
4.7.2.Indirect Marketing
4.7.3.Marketing Channel Development Trend

5.Market Positioning of Key Players, 2022
5.1. Company market share of key players, 2022
5.2. Competitive Benchmarking
5.3. Market Positioning of Key Vendors
5.4. Geographical Presence Analysis
5.5. Major Strategies Adopted by Key Players
5.5.1.Key Strategies Analysis
5.5.2.Mergers and Acquisitions
5.5.3.Partnerships
5.5.4.Type Launch
5.5.5.Geographical Expansion
5.5.6.Departmental Stores

6.Economic Impact Analysis
6.1. Recession Impact
6.1.1.North America
6.1.2.Europe
6.1.3.Asia Pacific
6.1.4.Latin America
6.1.5.Middle East and Africa
6.2. Ukraine-Russia War Impact
6.2.1.North America
6.2.2.Europe
6.2.3.Asia Pacific
6.2.4.Latin America
6.2.5.Middle East and Africa
6.3. COVID-19 Impact Analysis
6.3.1.North America
6.3.2.Europe
6.3.3. Asia Pacific
6.3.4.Latin America
6.3.5.Middle East and Africa

7.Global  Reusable incontinence products market, By Product Type
7.1. Global  Reusable incontinence products market Overview, By Product Type
7.1.1.Global Reusable incontinence products market Revenue Share, By Product Type, 2022 Vs 2030 (in %
7.2. Adult Cloth Diaper
7.2.1.Global  Reusable incontinence products market, By Region, 2017-2030 (US$ Bn)
7.3. Reusable Incontinence Pads
7.3.1.Global  Reusable incontinence products market, By Region, 2017-2030 (US$ Bn)
7.4. Reusable Underpads
7.4.1.Global  Reusable incontinence products market, By Region, 2017-2030 (US$ Bn)
7.5. Reusable Briefs
7.5.1.Global  Reusable incontinence products market, By Region, 2017-2030 (US$ Bn)
7.6. Reusable Incontinence Products Market
7.6.1.Global  Reusable incontinence products market, By Region, 2017-2030 (US$ Bn)

8. Global  Reusable incontinence products market, By End-User
8.1. Global  Reusable incontinence products market Overview, By End-User
8.1.1.Global Reusable incontinence products market, By End-User, 2022 vs. 2030 (in%)
8.2. Men Reusable Incontinence Products
8.2.1. Global  Reusable incontinence products market, By Region, 2017-2030 (US$ Bn)
8.3. Women Reusable Incontinence Products
8.3.1. Global  Reusable incontinence products market, By Region, 2017-2030 (US$ Bn)
8.4. Kids Reusable Incontinence Products
8.4.1. Global  Reusable incontinence products market, By Region, 2017-2030 (US$ Bn)

9. Global  Reusable incontinence products market, By Price Range, 2017-2030(US$ Bn)
9.1. Global  Reusable incontinence products market Overview, By Price Range
9.1.1. Global Reusable incontinence products market, By Price Range, 2022 vs 2030 (in%)
9.2. Mass/Economic (US$ 10-75) Reusable Incontinence Products
9.2.1. Global  Reusable incontinence products market, By Region, 2017-2030 (US$ Bn)
9.3. Premium (US$ 75 & Above) Reusable Incontinence Products
9.3.1. Global  Reusable incontinence products market, By Region, 2017-2030 (US$ Bn)

10. Global  Reusable incontinence products market, By Size, 2017-2030(US$ Bn)
10.1 Global  Reusable incontinence products market Overview, By Size
10.1.1. Global Reusable incontinence products market, By Size, 2022 vs 2030 (in %)
10.2. Small Reusable Incontinence Products
10.2.1. Global  Reusable incontinence products market, By Region, 2017-2030 (US$ Bn)
10.3. Medium Reusable Incontinence Products
10.3.1. Global  Reusable incontinence products market, By Region, 2017-2030 (US$ Bn)
10.4. Large Reusable Incontinence Products
10.4.1. Global  Reusable incontinence products market, By Region, 2017-2030 (US$ Bn)
10.5. X-Large Reusable Incontinence Products
10.5.1. Global  Reusable incontinence products market, By Region, 2017-2030 (US$ Bn)

11. Global  Reusable incontinence products market, By Sales Channel, 2017-2030(US$ Bn)
11.2. Global  Reusable incontinence products market Overview, By Sales Channel
11.2.1. Global Reusable incontinence products market, By Size, 2022 vs 2030 (in %)
11.3. Direct Sales
11.3.1. Global Reusable incontinence products market, By Region, 2017-2030 (US$ Bn)
11.4. Hypermarkets/ Supermarkets
11.4.1. Global  Reusable incontinence products market, By Region, 2017-2030 (US$ Bn)
11.5. Convenience Stores
11.5.1. Global  Reusable incontinence products market, By Region, 2017-2030 (US$ Bn)
11.6. Departmental Stores
11.6.1. Global  Reusable incontinence products market, By Region, 2017-2030 (US$ Bn)
11.7. Mono brand Stores
11.7.1. Global  Reusable incontinence products market, By Region, 2017-2030 (US$ Bn)
11.8. Specialty Stores
11.8.1. Global  Reusable incontinence products market, By Region, 2017-2030 (US$ Bn)
11.9. Drug Stores
11.9.1. Global  Reusable incontinence products market, By Region, 2017-2030 (US$ Bn)
11.10. Online Retailing
11.10.1. Global  Reusable incontinence products market, By Region, 2017-2030 (US$ Bn)
11.11. Others
11.11.1. Global  Reusable incontinence products market, By Region, 2017-2030 (US$ Bn)

12. Global  Reusable incontinence products market, By Region
12.2. Global  Reusable incontinence products market Overview, by Region
12.2.1. Global Reusable incontinence products market, By Region, 2022 vs 2030 (in%)
12.3. Type
12.3.1. Global  Reusable incontinence products market, By Product Type, 2017-2030 (US$ Bn)
12.4. End-User
12.4.1. Global  Reusable incontinence products market, By End-User, 2017-2030 (US$ Bn)
12.5. Price Range
12.5.1. Global  Reusable incontinence products market, By Price Range, 2017-2030 (US$ Bn)
12.6. Size
12.6.1. Global  Reusable incontinence products market, By Size, 2017-2030 (US$ Bn)
12.7. Sales Channel
12.7.1. Global  Reusable incontinence products market, By Sales Channel, 2017-2030 (US$ Bn)

13. North America  Reusable incontinence products market Analysis
13.2. North America  Reusable incontinence products market, By Product Type, 2017-2030(US$ Bn)
13.2.1. Overview
13.2.2. SRC Analysis
13.3. North America  Reusable incontinence products market, By End-User, 2017-2030(US$ Bn)
13.3.1. Overview
13.3.2. SRC Analysis
13.4. North America  Reusable incontinence products market, By Price Range, 2017-2030(US$ Bn)
13.4.1. Overview
13.4.2. SRC Analysis
13.5. North America  Reusable incontinence products market, By Size, 2017-2030(US$ Bn)
13.5.1. Overview
13.5.2. SRC Analysis
13.6. North America  Reusable incontinence products market, By Sales Channel, 2017-2030(US$ Bn)
13.6.1. Overview
13.6.2. SRC Analysis
13.7. North America  Reusable incontinence products market, by Country, 2017-2030(US$ Bn)
13.7.1. North America Reusable incontinence products market, by Country, 2022 Vs 2030 (in %)
13.7.2. U.S.
13.7.2.1. U.S.  Reusable incontinence products market Estimates and Forecast, 2017-2030(US$ Bn)
13.7.2.2. U.S.  Reusable incontinence products, By Product Type, 2017-2030(US$ Bn)
13.7.2.3. U.S.  Reusable incontinence products, By End-User, 2017-2030(US$ Bn)
13.7.2.4. U.S.  Reusable incontinence products, By Price Range, 2017-2030 (US$ Bn)
13.7.2.5. U.S.  Reusable incontinence products, By Size, 2017-2030 (US$ Bn)
13.7.2.6. Reusable incontinence products, By Sales Channel, 2017-2030 (US$ Bn)
13.7.3. Canada
13.7.3.1. Canada  Reusable incontinence products market Estimates and Forecast, 2017-2030(US$ Bn)
13.7.3.2. Canada  Reusable incontinence products, By Product Type, 2017-2030(US$ Bn)
13.7.3.3. Canada  Reusable incontinence products, By End-User, 2017-2030(US$ Bn)
13.7.3.4. Canada  Reusable incontinence products, By Price Range, 2017-2030 (US$ Bn)
13.7.3.5. Canada  Reusable incontinence products, By Size, 2017-2030 (US$ Bn)
13.7.3.6. Canada  Reusable incontinence products, By Sales Channel, 2017-2030 (US$ Bn)
13.7.4. Mexico
13.7.4.1. Mexico  Reusable incontinence products market Estimates and Forecast, 2017-2030 (US$ Bn)
13.7.4.2. Mexico  Reusable incontinence products, By Product Type, 2017-2030 (US$ Bn)
13.7.4.3. Mexico  Reusable incontinence products, By End-User, 2017-2030 (US$ Bn)
13.7.4.4. Mexico  Reusable incontinence products, By Material, 2017-2030 (US$ Bn)
13.7.4.5. Mexico  Reusable incontinence products, By Size, 2017-2030 (US$ Bn)
13.7.4.6. Mexico  Reusable incontinence products, By Sales Channel, 2017-2030 (US$ Bn)

14. Europe  Reusable incontinence products market Analysis
14.2. Europe  Reusable incontinence products market, By Product Type, 2017-2030(US$ Bn)
14.2.1. Overview
14.2.2. SRC Analysis
14.3. Europe  Reusable incontinence products market, By End-User, 2017-2030(US$ Bn)
14.3.1. Overview
14.3.2. SRC Analysis
14.4. Europe  Reusable incontinence products market, By Price Range, 2017-2030(US$ Bn)
14.4.1. Overview
14.4.2. SRC Analysis
14.5. Europe  Reusable incontinence products market, By Size, 2017-2030(US$ Bn)
14.5.1. Overview
14.5.2. SRC Analysis
14.6. Europe  Reusable incontinence products market, By Sales Channel, 2017-2030(US$ Bn)
14.6.1. Overview
14.6.2. SRC Analysis
14.7. Europe  Reusable incontinence products market, by Country, 2017-2030(US$ Bn)
14.7.1. Europe Reusable incontinence products market, by Country, 2022 Vs 2030 (in%)
14.7.2. Germany
14.7.2.1. Germany  Reusable incontinence products market Estimates and Forecast, 2017-2030(US$ Bn)
14.7.2.2. Germany  Reusable incontinence products, By Product Type, 2017-2030(US$ Bn)
14.7.2.3. Germany  Reusable incontinence products, By End-User, 2017-2030(US$ Bn)
14.7.3. Germany  Reusable incontinence products, By Price Range, 2017-2030 (US$ Bn)
14.7.4. Germany  Reusable incontinence products, By Size, 2017-2030 (US$ Bn)
14.7.5. Germany  Reusable incontinence products, By Sales Channel, 2017-2030 (US$ Bn)
14.7.6. France
14.7.6.1. France  Reusable incontinence products market Estimates and Forecast, 2017-2030(US$ Bn)
14.7.6.2. France  Reusable incontinence products, By Product Type, 2017-2030(US$ Bn)
14.7.6.3. France  Reusable incontinence products, By End-User, 2017-2030(US$ Bn)
14.7.6.4. France  Reusable incontinence products, By Price Range, 2017-2030 (US$ Bn)
14.7.6.5. France  Reusable incontinence products, By Size, 2017-2030 (US$ Bn)
14.7.6.6. France  Reusable incontinence products, By Sales Channel, 2017-2030 (US$ Bn)
14.7.7. UK
14.7.7.1. UK  Reusable incontinence products market Estimates and Forecast, 2017-2030(US$ Bn)
14.7.7.2. UK  Reusable incontinence products, By Product Type, 2017-2030(US$ Bn)
14.7.7.3. UK  Reusable incontinence products, By End-User, 2017-2030(US$ Bn)
14.7.7.4. UK  Reusable incontinence products, By Price Range, 2017-2030 (US$ Bn)
14.7.7.5. UK  Reusable incontinence products, By Size, 2017-2030 (US$ Bn)
14.7.7.6. UK  Reusable incontinence products, By Sales Channel, 2017-2030 (US$ Bn)
14.7.8. Italy
14.7.8.1. Italy  Reusable incontinence products market Estimates and Forecast, 2017-2030(US$ Bn)
14.7.8.2. Italy  Reusable incontinence products, By Product Type, 2017-2030(US$ Bn)
14.7.8.3. Italy  Reusable incontinence products, By End-User, 2017-2030(US$ Bn)
14.7.8.4. Italy  Reusable incontinence products, By Price Range, 2017-2030 (US$ Bn)
14.7.8.5. Italy  Reusable incontinence products, By Size, 2017-2030 (US$ Bn)
14.7.8.6. Italy  Reusable incontinence products, By Sales Channel, 2017-2030 (US$ Bn)
14.7.9. Spain
14.7.9.1. Spain  Reusable incontinence products market Estimates and Forecast, 2017-2030(US$ Bn)
14.7.9.2. Spain  Reusable incontinence products, By Product Type, 2017-2030(US$ Bn)
14.7.9.3. Spain  Reusable incontinence products, By End-User, 2017-2030(US$ Bn)
14.7.9.4. Spain  Reusable incontinence products, By Price Range, 2017-2030 (US$ Bn)
14.7.9.5. Spain  Reusable incontinence products, By Size, 2017-2030 (US$ Bn)
14.7.9.6. Spain  Reusable incontinence products, By Sales Channel, 2017-2030 (US$ Bn)
14.7.10. Rest of Europe
14.7.10.1. Rest of Europe  Reusable incontinence products market Estimates and Forecast, 2017-2030(US$ Bn)
14.7.10.2. Rest of Europe  Reusable incontinence products, By Product Type, 2017-2030(US$ Bn)
14.7.10.3. Rest of Europe  Reusable incontinence products, By End-User, 2017-2030(US$ Bn)
14.7.10.4. Rest of Europe  Reusable incontinence products, By Price Range, 2017-2030 (US$ Bn)
14.7.10.5. Rest of Europe  Reusable incontinence products, By Size, 2017-2030 (US$ Bn)
14.7.10.6. Rest of Europe  Reusable incontinence products, By Sales Channel, 2017-2030 (US$ Bn)

15. Asia Pacific  Reusable incontinence products market Analysis
15.2. Asia Pacific  Reusable incontinence products market, By Product Type, 2017-2030(US$ Bn)
15.2.1. Overview
15.2.2. SRC Analysis
15.3. Asia Pacific  Reusable incontinence products market, By End-User, 2017-2030(US$ Bn)
15.3.1. Overview15.3.2. SRC Analysis
15.4. Asia Pacific  Reusable incontinence products market, By Price Range, 2017-2030(US$ Bn)
15.4.1. Overview
15.4.2. SRC Analysis
15.5. Asia Pacific  Reusable incontinence products market, By Size, 2017-2030(US$ Bn
15.5.1. Overview
15.5.2. SRC Analysis
15.6. Asia Pacific  Reusable incontinence products market, By Sales Channel, 2017-2030(US$ Bn)
15.6.1. Overview
15.6.2. SRC Analysis
15.7. Asia Pacific  Reusable incontinence products market, by Country, 2017-2030(US$ Bn)
15.7.1. Asia Pacific Reusable incontinence products market, by Country, 2022 Vs 2030 (in%)
15.7.2. China
15.7.2.1. China  Reusable incontinence products market Estimates and Forecast, 2017-2030(US$ Bn)
15.7.2.2. China  Reusable incontinence products, By Product Type, 2017-2030(US$ Bn)
15.7.2.3. China  Reusable incontinence products, By End-User, 2017-2030(US$ Bn)
15.7.2.4. China  Reusable incontinence products, By Price Range, 2017-2030 (US$ Bn)
15.7.2.5. China  Reusable incontinence products, By Size, 2017-2030 (US$ Bn)
15.7.2.6. China  Reusable incontinence products, By Sales Channel, 2017-2030 (US$ Bn)
15.7.3. Japan
15.7.3.1. Japan  Reusable incontinence products market Estimates and Forecast, 2017-2030(US$ Bn)
15.7.3.2. Japan  Reusable incontinence products, By Product Type, 2017-2030(US$ Bn)
15.7.3.3. Japan  Reusable incontinence products, By End-User, 2017-2030(US$ Bn)
15.7.3.4. Japan  Reusable incontinence products, By Price Range, 2017-2030 (US$ Bn)
15.7.3.5. Japan  Reusable incontinence products, By Size, 2017-2030 (US$ Bn)
15.7.3.6. Japan  Reusable incontinence products, By Sales Channel, 2017-2030 (US$ Bn)
15.7.4. India
15.7.4.1. India  Reusable incontinence products market Estimates and Forecast, 2017-2030(US$ Bn)
15.7.4.2. India  Reusable incontinence products, By Product Type, 2017-2030(US$ Bn)
15.7.4.3. India  Reusable incontinence products, By End-User, 2017-2030(US$ Bn)
15.7.4.4. India  Reusable incontinence products, By Price Range, 2017-2030 (US$ Bn)
15.7.4.5. India  Reusable incontinence products, By Size, 2017-2030 (US$ Bn)
15.7.4.6. India  Reusable incontinence products, By Sales Channel, 2017-2030 (US$ Bn)
15.7.5. South Korea
15.7.5.1. South Korea  Reusable incontinence products market Estimates and Forecast, 2017-2030(US$ Bn)
15.7.5.2. South Korea  Reusable incontinence products, By Product Type, 2017-2030(US$ Bn)
15.7.5.3. South Korea  Reusable incontinence products, By End-User, 2017-2030(US$ Bn)
15.7.5.4. South Korea  Reusable incontinence products, By Price Range, 2017-2030 (US$ Bn)
15.7.5.5. South Korea  Reusable incontinence products, By Size, 2017-2030 (US$ Bn)
15.7.5.6. South Korea  Reusable incontinence products, By Sales Channel, 2017-2030 (US$ Bn)
15.7.6. South-East Asia
15.7.6.1. South-East Asia  Reusable incontinence products market Estimates and Forecast, 2017-2030(US$ Bn)
15.7.6.2. South-East Asia  Reusable incontinence products, By Product Type, 2017-2030(US$ Bn)
15.7.6.3. South-East Asia  Reusable incontinence products, By End-User, 2017-2030(US$ Bn)
15.7.6.4. South-East Asia  Reusable incontinence products, By Price Range, 2017-2030 (US$ Bn)
15.7.6.5. South-East Asia  Reusable incontinence products, By Size, 2017-2030 (US$ Bn)
15.7.6.6. South-East Asia  Reusable incontinence products, By Sales Channel, 2017-2030 (US$ Bn)
15.7.7. Rest of Asia Pacific
15.7.7.1. Rest of Asia Pacific  Reusable incontinence products market Estimates and Forecast, 2017-2030(US$ Bn)
15.7.7.2. Rest of Asia Pacific  Reusable incontinence products, By Product Type, 2017-2030(US$ Bn)
15.7.7.3. Rest of Asia Pacific  Reusable incontinence products, By End-User, 2017-2030(US$ Bn)
15.7.7.4. Rest of Asia Pacific  Reusable incontinence products, By Price Range, 2017-2030 (US$ Bn)
15.7.7.5. Rest of Asia Pacific  Reusable incontinence products, By Size, 2017-2030 (US$ Bn)
15.7.7.6. Rest of Asia Pacific  Reusable incontinence products, By Sales Channel, 2017-2030 (US$ Bn)

16. Latin America  Reusable incontinence products market Analysis
16.2. Latin America  Reusable incontinence products market, By Product Type, 2017-2030(US$ Bn)
16.2.1. Overview
16.2.2. SRC Analysis
16.3. Latin America  Reusable incontinence products market, By End-User, 2017-2030(US$ Bn)
16.3.1. Overview
16.3.2. SRC Analysis
16.4. Latin America  Reusable incontinence products market, By Price Range, 2017-2030(US$ Bn)
16.4.1. Overview
16.4.2. SRC Analysis
16.5. Latin America  Reusable incontinence products market, By Size, 2017-2030(US$ Bn)
16.5.1. Overview
16.5.2. SRC Analysis
16.6. Latin America  Reusable incontinence products market, By Sales Channel, 2017-2030(US$ Bn)
16.6.1. Overview
16.6.2. SRC Analysis
16.7. Latin America  Reusable incontinence products market, by Country, 2017-2030(US$ Bn)
16.7.1. Latin America Reusable incontinence products market, by Country, 2022 Vs 2030 (in%)
16.7.2. Brazil
16.7.2.1. Brazil  Reusable incontinence products market Estimates and Forecast, 2017-2030(US$ Bn)
16.7.2.2. Brazil  Reusable incontinence products, By Product Type, 2017-2030(US$ Bn)
16.7.2.3. Brazil  Reusable incontinence products, By End-User, 2017-2030(US$ Bn)
16.7.2.4. Brazil  Reusable incontinence products, By Price Range, 2017-2030 (US$ Bn)
16.7.2.5. Brazil  Reusable incontinence products, By Size, 2017-2030 (US$ Bn)
16.7.2.6. Brazil  Reusable incontinence products, By Sales Channel, 2017-2030 (US$ Bn)
16.7.3. Argentina
16.7.3.1. Argentina Reusable incontinence products market Estimates and Forecast, 2017-2030(US$ Bn)
16.7.3.2. Argentina Reusable incontinence products, By Product Type, 2017-2030(US$ Bn)
16.7.3.3. Argentina Reusable incontinence products, By End-User, 2017-2030(US$ Bn)
16.7.3.4. Argentina Reusable incontinence products, By Price Range, 2017-2030 (US$ Bn)
16.7.3.5. Argentina Reusable incontinence products, By Size, 2017-2030 (US$ Bn)
16.7.3.6. Argentina Reusable incontinence products, By Sales Channel, 2017-2030 (US$ Bn)
16.7.4. Rest of Latin America
16.7.4.1. Rest of Latin America  Reusable incontinence products market Estimates and Forecast, 2017-2030(US$ Bn)
16.7.4.2. Rest of Latin America  Reusable incontinence products, By Product Type, 2017-2030(US$ Bn)
16.7.4.3. Rest of Latin America  Reusable incontinence products, By End-User, 2017-2030(US$ Bn)
16.7.4.4. Rest of Latin America  Reusable incontinence products, By Price Range, 2017-2030 (US$ Bn)
16.7.4.5. Rest of Latin America  Reusable incontinence products, By Size, 2017-2030 (US$ Bn)
16.7.4.6. Rest of Latin America  Reusable incontinence products, By Sales Channel, 2017-2030 (US$ Bn)

17. Middle East and Africa  Reusable incontinence products market Analysis
17.2. Middle East and Africa  Reusable incontinence products market, By Product Type, 2017-2030(US$ Bn)
17.2.1. Overview
17.2.2. SRC Analysis
17.3. Middle East and Africa  Reusable incontinence products market, By End-User, 2017-2030(US$ Bn)
17.3.1. Overview
17.3.2. SRC Analysis
17.4. Middle East and Africa  Reusable incontinence products market, By Price Range, 2017-2030(US$ Bn)
17.4.1. Overview
17.4.2. SRC Analysis
17.5. Middle East and Africa  Reusable incontinence products market, By Size, 2017-2030(US$ Bn)
17.5.1. Overview
17.5.2. SRC Analysis
17.6. Middle East and Africa  Reusable incontinence products market, By Sales Channel, 2017-2030(US$ Bn)
17.6.1. Overview
17.6.2. SRC Analysis
17.7. Middle East and Africa  Reusable incontinence products market, by Country, 2017-2030(US$ Bn)
17.7.1. Middle East and Africa Reusable incontinence products market, by Country, 2022 Vs 2030 (in%)
17.7.2. GCC Countries
17.7.2.1. GCC Countries  Reusable incontinence products market Estimates and Forecast, 2017-2030(US$ Bn)
17.7.2.2. GCC Countries  Reusable incontinence products, By Product Type, 2017-2030(US$ Bn)
17.7.2.3. GCC Countries  Reusable incontinence products, By End-User, 2017-2030(US$ Bn)
17.7.2.4. GCC Countries  Reusable incontinence products, By Price Range, 2017-2030 (US$ Bn)
17.7.2.5. GCC Countries  Reusable incontinence products, By Size, 2017-2030 (US$ Bn)
17.7.2.6. GCC Countries  Reusable incontinence products, By Sales Channel, 2017-2030 (US$ Bn)
17.7.2.7. Bn)
17.7.3. South Africa
17.7.3.1. South Africa  Reusable incontinence products market Estimates and Forecast, 2017-2030(US$ Bn)
17.7.3.2. South Africa  Reusable incontinence products, By Product Type, 2017-2030(US$ Bn)
17.7.3.3. South Africa  Reusable incontinence products, By End-User, 2017-2030(US$ Bn)
17.7.3.4. South Africa  Reusable incontinence products, By Price Range, 2017-2030 (US$ Bn)
17.7.3.5. South Africa  Reusable incontinence products, By Size, 2017-2030 (US$ Bn)
17.7.3.6. South Africa  Reusable incontinence products, By Sales Channel, 2017-2030 (US$ Bn)
17.7.4. Rest of Middle East and Africa
17.7.4.1. Rest of Middle East and Africa  Reusable incontinence products market Estimates and Forecast, 2017-2030(US$ Bn)
17.7.4.2. Rest of Middle East and Africa  Reusable incontinence products, By Product Type, 2017-2030(US$ Bn)
17.7.4.3. Rest of Middle East and Africa  Reusable incontinence products, By End-User, 2017-2030(US$ Bn)
17.7.4.4. Rest of Middle East and Africa  Reusable incontinence products, By Price Range, 2017-2030 (US$ Bn)
17.7.4.5. Rest of Middle East and Africa  Reusable incontinence products, By Size, 2017-2030 (US$ Bn)
17.7.4.6. Rest of Middle East and Africa  Reusable incontinence products, By Sales Channel, 2017-2030 (US$ Bn)

18. Company Profiles
18.1. Kimberly-Clark Corporation
18.1.1. Company Overview
18.1.2. Type/Services Portfolio
18.1.3. Geographical Presence
18.1.4. Financial Summary
18.1.4.1. Market Revenue and Net Profit (2019-2022)
18.1.4.2. Business Segment Revenue Analysis
18.1.4.3. Geographical Revenue Analysis
18.2. The Proctor & Gamble Company
18.3. MediFabrik SRL
18.4. Cardinal Health, Inc.
18.5. Essity AB
18.6. Medline Industries, Inc.
18.7. Ontex International N.V.
18.8. Attindas Hygiene Partners
18.9. Activ Medical Disposable
18.10. Paul Hartmann AG
18.11. Nexwear
18.12. Prime Life Fibers
18.13. Royal Medical Solutions, Inc.
18.14. Abena Group
18.15. Unicharm Corporation
18.16. Prevail
18.17. Dryloch Technologies NV,

List of Figures

FIG. 1 Global  Reusable incontinence products market: Research Methodology
FIG. 2 Market Size Estimation – Top Down & Bottom up Approach
FIG. 3 Global  Reusable incontinence products market Segmentation
FIG. 4 Global  Reusable incontinence products market, By Product Type, 2022(US$ Bn)
FIG. 5 Global  Reusable incontinence products market, By End-User, 2022(US$ Bn)
FIG. 6 Global  Reusable incontinence products market, By Price Range, 2022 (US$ Bn)
FIG. 7 Global  Reusable incontinence products market, By Size, 2022 (US$ Bn)
FIG. 8 Global  Reusable incontinence products market, By Sales Channel, 2022 (US$ Bn)
FIG. 9 Global  Reusable incontinence products market, by Geography, 2022(US$ Bn)
FIG. 10 Attractive Investment Proposition, By Product Type, 2022
FIG. 11 Attractive Investment Proposition, By End-User, 2022
FIG. 12 Attractive Investment Proposition, By Price Range, 2022
FIG. 13 Attractive Investment Proposition, By Size, 2022
FIG. 14 Attractive Investment Proposition, By Sales Channel, 2022
FIG. 15 Attractive Investment Proposition, by Geography, 2022
FIG. 16 Global Market Share Analysis of Key  Reusable incontinence products market Manufacturers, 2022
FIG. 17 Global Market Positioning of Key  Reusable incontinence products market Manufacturers, 2022
FIG. 18 Global  Reusable incontinence products market Value Contribution, By Product Type, 2022&2030 (Value %)
FIG. 19 Global  Reusable incontinence productsMarket, by Adult Cloth Diaper, Value, 2017-2030(US$ Bn)
FIG. 20 Global  Reusable incontinence productsMarket, by Reusable Incontinence Pads, Value, 2017-2030(US$ Bn)
FIG. 21 Global  Reusable incontinence productsMarket, by Reusable Underpads, Value, 2017-2030(US$ Bn)
FIG. 22 Global  Reusable incontinence productsMarket, by Reusable Briefs, Value, 2017-2030(US$ Bn)
FIG. 23 Global  Reusable incontinence productsMarket, by Reusable Incontinence Products Market, Value, 2017-2030(US$ Bn)
FIG. 24 Global  Reusable incontinence products market, by Men Reusable Incontinence Products, Value, 2017-2030(US$ Bn)
FIG. 25 Global  Reusable incontinence products market, by Women Reusable Incontinence Products, 2017-2030(US$ Bn)
FIG. 26 Global  Reusable incontinence products market, by Kids Reusable Incontinence Products, 2017-2030(US$ Bn)
FIG. 27 Global  Reusable incontinence products market Value Contribution, By Price Range, 2022 & 2030 (Value %)
FIG. 28 Global  Reusable incontinence products market, by Mass/Economic (US$ 10-75) Reusable Incontinence Products, Value, 2017-2030 (US$ Bn)
FIG. 29 Global  Reusable incontinence products market, by Premium (US$ 75 & Above) Reusable Incontinence Products, 2017-2030 (US$ Bn)
FIG. 30 Global  Reusable incontinence products market Value Contribution, By Size, 2022 & 2030 (Value %)
FIG. 31 Global  Reusable incontinence products market, by Small Reusable Incontinence Products, Value, 2017-2030 (US$ Bn)
FIG. 32 Global  Reusable incontinence products market, by Medium Reusable Incontinence Products, Value, 2017-2030 (US$ Bn)
FIG. 33 Global  Reusable incontinence products market, by Large Reusable Incontinence Products, Value, 2017-2030 (US$ Bn)
FIG. 34 Global  Reusable incontinence products market, by X-Large Reusable Incontinence
FIG. 35 Global  Reusable incontinence products market Value Contribution, By Sales Channel, 2022 & 2030 (Value %)
FIG. 36 Global  Reusable incontinence products market, by Direct Sales, Value, 2017-2030 (US$ Bn)
FIG. 37 Global  Reusable incontinence products market, by Hypermarkets/ Supermarkets, Value, 2017-2030 (US$ Bn)
FIG. 38 Global  Reusable incontinence products market, by Convenience Stores, Value, 2017-2030 (US$ Bn)
FIG. 39 Global  Reusable incontinence products market, by Departmental Stores, Value, 2017-2030 (US$ Bn)
FIG. 40 Global  Reusable incontinence products market, by Mono brand Stores, Value, 2017-2030 (US$ Bn)
FIG. 41 Global  Reusable incontinence products market, by Specialty Stores, Value, 2017-2030 (US$ Bn)
FIG. 42 Global  Reusable incontinence products market, by Drug Stores, Value, 2017-2030 (US$ Bn)
FIG. 43 Global  Reusable incontinence products market, by o Online Retailing, Value, 2017-2030 (US$ Bn)
FIG. 44 Global  Reusable incontinence products market, by Others, Value, 2017-2030 (US$ Bn)
FIG. 45 North America  Reusable incontinence products market, 2017-2030 (US$ Bn)
FIG. 46 U.S.  Reusable incontinence products market, 2017-2030(US$ Bn)
FIG. 47 Canada  Reusable incontinence products market, 2017-2030(US$ Bn)
FIG. 48 Europe  Reusable incontinence products market, 2017-2030 (US$ Bn)
FIG. 49 Germany  Reusable incontinence products market, 2017-2030(US$ Bn)
FIG. 50 France Reusable incontinence products market, 2017-2030(US$ Bn)
FIG. 51 U.K.  Reusable incontinence products market, 2017-2030(US$ Bn)
FIG. 52 Italy Reusable incontinence products market, 2017-2030(US$ Bn)
FIG. 53 Spain  Reusable incontinence products market, 2017-2030(US$ Bn)
FIG. 54 Rest of Europe  Reusable incontinence products market, 2017-2030(US$ Bn)
FIG. 55 Asia Pacific  Reusable incontinence products market, 2017-2030 (US$ Bn)
FIG. 56 China  Reusable incontinence products market, 2017-2030(US$ Bn)
FIG. 57 Japan  Reusable incontinence products market, 2017-2030(US$ Bn)
FIG. 58 India Reusable incontinence products market, 2017-2030(US$ Bn)
FIG. 59 South Korea Reusable incontinence products market, 2017-2030(US$ Bn)
FIG. 60 South-East Asia Reusable incontinence products market, 2017-2030(US$ Bn)
FIG. 61 Rest of Asia Pacific  Reusable incontinence products market, 2017-2030(US$ Bn)
FIG. 62 Latin America Reusable incontinence products market, 2017-2030(US$ Bn)
FIG. 63 Brazil  Reusable incontinence products market, 2017-2030(US$ Bn)
FIG. 64 Mexico  Reusable incontinence products market, 2017-2030(US$ Bn)
FIG. 65 Rest of Latin America Reusable incontinence products market, 2017-2030(US$ Bn)
FIG. 66 Middle East & Africa Reusable incontinence products market, 2017-2030(US$ Bn)
FIG. 67 GCC Countries Reusable incontinence products market, 2017-2030(US$ Bn)
FIG. 68 South Africa Reusable incontinence products market, 2017-2030(US$ Bn)
FIG. 69 Rest of Middle East and Africa Reusable incontinence products market, 2017-2030(US$ Bn)

List of Tables

TABLE 1 Market Snapshot: Global  Reusable incontinence products market
TABLE 2 Global  Reusable incontinence products market: Market Drivers Impact Analysis
TABLE 3 Global  Reusable incontinence products market: Market Restraints Impact Analysis
TABLE 4 Global  Reusable incontinence products market, by Competitive Benchmarking,2022
TABLE 5 Global  Reusable incontinence products market, by Geographical Presence Analysis, 2022
TABLE 6 Global  Reusable incontinence products market, by Key Strategies Analysis, 2022
TABLE 7 Global  Reusable incontinence products market, by Adult Cloth Diaper, By Region, 2017-2022(US$ Bn)
TABLE 8 Global  Reusable incontinence products market, by Reusable Incontinence Pads, By Region, 2023-2030(US$ Bn)
TABLE 9 Global  Reusable incontinence products market, by Men Reusable Incontinence Products, By Region, 2017-2022(US$ Bn)
TABLE 10 Global  Reusable incontinence products market, by Men Reusable Incontinence Products, By Region, 2023-2030(US$ Bn)
TABLE 11 Global  Reusable incontinence products market, by Women Reusable Incontinence Products, By Region, 2017-2022(US$ Bn)
TABLE 12 Global  Reusable incontinence products market, by Women Reusable Incontinence Products, By Region, 2023-2030(US$ Bn)
TABLE 13 Global  Reusable incontinence products market, by Mass/Economic (US$ 10-75) Reusable Incontinence Products, By Region, 2017-2022(US$ Bn)
TABLE 14 Global  Reusable incontinence products market, by Mass/Economic (US$ 10-75) Reusable Incontinence Products, By Region, 2023-2030(US$ Bn)
TABLE 15 Global  Reusable incontinence products market, by Premium (US$ 75 & Above) Reusable Incontinence Products, By Region, 2017-2022(US$ Bn)
TABLE 16 Global  Reusable incontinence products market, by Premium (US$ 75 & Above) Reusable Incontinence Products, By Region, 2023-2030(US$ Bn)
TABLE 17 Global  Reusable incontinence products market, By Product Type, 2017-2022(US$ Bn)
TABLE 18 Global  Reusable incontinence products market, By Product Type, 2023-2030(US$ Bn)
TABLE 19 Global  Reusable incontinence products market, By End-User, 2017-2022(US$ Bn)
TABLE 20 Global  Reusable incontinence products market, By End-User, 2023-2030(US$ Bn)
TABLE 21 Global  Reusable incontinence products market, By Price Range, 2017-2022(US$ Bn)
TABLE 22 Global  Reusable incontinence products market, By Price Range, 2023-2030 (US$ Bn)
TABLE 23 Global  Reusable incontinence products market, By Size, 2017-2022(US$ Bn)
TABLE 24 Global  Reusable incontinence products market, By Size, 2023-2030(US$ Bn
TABLE 25 Global  Reusable incontinence products market, By Sales Channel, 2017-2022(US$ Bn)
TABLE 26 Global  Reusable incontinence products market, By Sales Channel, 2023-2030(US$ Bn)
TABLE 27 Global Reusable incontinence products market, by Region, 2017-2022(US$ Bn)
TABLE 28 Global Reusable incontinence products market, by Region, 2023-2030(US$ Bn)
TABLE 29 North America Reusable incontinence products market, By Product Type, 2017-2022(US$ Bn)
TABLE 30 North America  Reusable incontinence products market, By Product Type, 2023-2030(US$ Bn)
TABLE 31 North America Reusable incontinence products market, By End-User, 2017-2022(US$ Bn)
TABLE 32 North America Reusable incontinence products market, By End-User, 2023-2030(US$ Bn)
TABLE 33 North America Reusable incontinence products market, By Price Range, 2017-2022(US$ Bn)
TABLE 34 North America Reusable incontinence products market, By Price Range, 2023-2030(US$ Bn)
TABLE 35 North America Reusable incontinence products market, By Size, 2017-2022(US$ Bn)
TABLE 36 North America Reusable incontinence products market, By Size, 2023-2030(US$ Bn)
TABLE 37 North America Reusable incontinence products market, By Sales Channel, 2017-2022(US$ Bn)
TABLE 38 North America Reusable incontinence products market, By Sales Channel, 2023-2030(US$ Bn)
TABLE 39 North America Reusable incontinence products market, by Country, 2017-2022(US$ Bn)
TABLE 40 North America Reusable incontinence products market, by Country, 2023-2030(US$ Bn)
TABLE 41 United States Reusable incontinence products market, By Product Type, 2017-2022(US$ Bn)
TABLE 42 United States  Reusable incontinence products market, By Product Type, 2023-2030(US$ Bn)
TABLE 43 United States Reusable incontinence products market, By End-User, 2017-2022(US$ Bn)
TABLE 44 United States Reusable incontinence products market, By End-User, 2023-2030(US$ Bn)
TABLE 45 United States Reusable incontinence products market, By Price Range, 2017-2022(US$ Bn)
TABLE 46 United States Reusable incontinence products market, By Price Range, 2023-2030(US$ Bn)
TABLE 47 United States Reusable incontinence products market, By Size, 2017-2022(US$ Bn)
TABLE 48 United States Reusable incontinence products market, By Size, 2023-2030(US$ Bn)
TABLE 49 United States Reusable incontinence products market, By Sales Channel, 2017-2022(US$ Bn)
TABLE 50 United States Reusable incontinence products market, By Sales Channel, 2023-2030(US$ Bn)
TABLE 51 Canada Reusable incontinence products market, By Product Type, 2017-2022(US$ Bn)
TABLE 52 Canada  Reusable incontinence products market, By Product Type, 2023-2030(US$ Bn)
TABLE 53 Canada Reusable incontinence products market, by End-User, 2017-2022(US$ Bn)
TABLE 54 Canada Reusable incontinence products market, by End-User, 2023-2030(US$ Bn)
TABLE 55 Canada Reusable incontinence products market, By Price Range, 2017-2022(US$ Bn)
TABLE 56 Canada Reusable incontinence products market, By Price Range, 2023-2030(US$ Bn)
TABLE 57 Canada Reusable incontinence products market, By Size, 2017-2022(US$ Bn)
TABLE 58 Canada Reusable incontinence products market, By Size, 2023-2030(US$ Bn)
TABLE 59 Canada Reusable incontinence products market, By Sales Channel, 2017-2022(US$ Bn)
TABLE 60 Canada Reusable incontinence products market, By Sales Channel, 2023-2030(US$ Bn)
TABLE 61 Mexico Reusable incontinence products market, By Product Type, 2017-2022(US$ Bn)
TABLE 62 Mexico  Reusable incontinence products market, By Product Type, 2023-2030(US$ Bn)
TABLE 63 Mexico Reusable incontinence products market, by End-User, 2017-2022(US$ Bn)
TABLE 64 Mexico Reusable incontinence products market, by End-User, 2023-2030(US$ Bn)
TABLE 65 Mexico Reusable incontinence products market, By Price Range, 2017-2022(US$ Bn)
TABLE 66 Mexico Reusable incontinence products market, By Price Range, 2023-2030(US$ Bn)
TABLE 67 Mexico Reusable incontinence products market, By Size, 2017-2022(US$ Bn)
TABLE 68 Mexico Reusable incontinence products market, By Size, 2023-2030(US$ Bn)
TABLE 69 Mexico Reusable incontinence products market, By Sales Channel, 2017-2022(US$ Bn)
TABLE 70 Mexico Reusable incontinence products market, By Sales Channel, 2023-2030(US$ Bn)
TABLE 71 Europe Reusable incontinence products market, By Product Type, 2017-2022(US$ Bn)
TABLE 72 Europe  Reusable incontinence products market, By Product Type, 2023-2030(US$ Bn)
TABLE 73 Europe Reusable incontinence products market, by End-User, 2017-2022(US$ Bn)
TABLE 74 Europe Reusable incontinence products market, by End-User, 2023-2030(US$ Bn)
TABLE 75 Europe Reusable incontinence products market, By Price Range, 2017-2022(US$ Bn)
TABLE 76 Europe Reusable incontinence products market, By Price Range, 2023-2030(US$ Bn)
TABLE 77 Europe Reusable incontinence products market, By Size, 2017-2022(US$ Bn)
TABLE 78 Europe Reusable incontinence products market, By Size, 2023-2030(US$ Bn)
TABLE 79 Europe Reusable incontinence products market, By Sales Channel, 2017-2022(US$ Bn)
TABLE 80 Europe Reusable incontinence products market, By Sales Channel, 2023-2030(US$ Bn)
TABLE 81 Germany Reusable incontinence products market, By Product Type, 2017-2022(US$ Bn)
TABLE 82 Germany  Reusable incontinence products market, By Product Type, 2023-2030(US$ Bn)
TABLE 83 Germany Reusable incontinence products market, by End-User, 2017-2022(US$ Bn)
TABLE 84 Germany Reusable incontinence products market, by End-User, 2023-2030(US$ Bn)
TABLE 85 Germany Reusable incontinence products market, By Price Range, 2017-2022(US$ Bn)
TABLE 86 Germany Reusable incontinence products market, By Price Range, 2023-2030(US$ Bn)
TABLE 87 Germany Reusable incontinence products market, By Size, 2017-2022(US$ Bn)
TABLE 88 Germany Reusable incontinence products market, By Size, 2023-2030(US$ Bn)
TABLE 89 Germany Reusable incontinence products market, By Sales Channel, 2017-2022(US$ Bn)
TABLE 90 Germany Reusable incontinence products market, By Sales Channel, 2023-2030(US$ Bn)
TABLE 91 France Reusable incontinence products market, By Product Type, 2017-2022(US$ Bn)
TABLE 92 France  Reusable incontinence products market, By Product Type, 2023-2030(US$ Bn)
TABLE 93 France Reusable incontinence products market, by End-User, 2017-2022(US$ Bn)
TABLE 94 France Reusable incontinence products market, by End-User, 2023-2030(US$ Bn)
TABLE 95 France Reusable incontinence products market, By Price Range, 2017-2022(US$ Bn)
TABLE 96 France Reusable incontinence products market, By Price Range, 2023-2030(US$ Bn)
TABLE 97 France Reusable incontinence products market, By Size, 2017-2022(US$ Bn)
TABLE 98 France Reusable incontinence products market, By Size, 2023-2030(US$ Bn)
TABLE 99 France Reusable incontinence products market, By Sales Channel, 2017-2022(US$ Bn)
TABLE 100 France Reusable incontinence products market, By Sales Channel, 2023-2030(US$ Bn)
TABLE 101 United Kingdom Reusable incontinence products market, By Product Type, 2017-2022(US$ Bn)
TABLE 102 United Kingdom  Reusable incontinence products market, By Product Type, 2023-2030(US$ Bn)
TABLE 103 United Kingdom Reusable incontinence products market, by End-User, 2017-2022(US$ Bn)
TABLE 104 United Kingdom Reusable incontinence products market, by End-User, 2023-2030(US$ Bn)
TABLE 105 United Kingdom Reusable incontinence products market, By Price Range, 2017-2022(US$ Bn)
TABLE 106 United Kingdom Reusable incontinence products market, By Price Range, 2023-2030(US$ Bn)
TABLE 107 United Kingdom Reusable incontinence products market, By Size, 2017-2022(US$ Bn)
TABLE 108 United Kingdom Reusable incontinence products market, By Size, 2023-2030(US$ Bn)
TABLE 109 United Kingdom Reusable incontinence products market, By Sales Channel, 2017-2022(US$ Bn)
TABLE 110 United Kingdom Reusable incontinence products market, By Sales Channel, 2023-2030(US$ Bn)
TABLE 111 Italy Reusable incontinence products market, By Product Type, 2017-2022(US$ Bn)
TABLE 112 Italy  Reusable incontinence products market, By Product Type, 2023-2030(US$ Bn)
TABLE 113 Italy Reusable incontinence products market, by End-User, 2017-2022(US$ Bn)
TABLE 114 Italy Reusable incontinence products market, by End-User, 2023-2030(US$ Bn)
TABLE 115 Italy Reusable incontinence products market, By Price Range, 2017-2022(US$ Bn)
TABLE 116 Italy Reusable incontinence products market, By Price Range, 2023-2030(US$ Bn)
TABLE 117 Italy Reusable incontinence products market, By Size, 2017-2022(US$ Bn)
TABLE 118 Italy Reusable incontinence products market, By Size, 2023-2030(US$ Bn)
TABLE 119 Italy Reusable incontinence products market, By Sales Channel, 2017-2022(US$ Bn)
TABLE 120 Italy Reusable incontinence products market, By Sales Channel, 2023-2030(US$ Bn)
TABLE 121 Spain Reusable incontinence products market, By Product Type, 2017-2022(US$ Bn)
TABLE 122 Spain  Reusable incontinence products market, By Product Type, 2023-2030(US$ Bn)
TABLE 123 Spain Reusable incontinence products market, by End-User, 2017-2022(US$ Bn)
TABLE 124 Spain Reusable incontinence products market, by End-User, 2023-2030(US$ Bn)
TABLE 125 Spain Reusable incontinence products market, By Price Range, 2017-2022(US$ Bn)
TABLE 126 Spain Reusable incontinence products market, By Price Range, 2023-2030(US$ Bn)
TABLE 127 Spain Reusable incontinence products market, By Size, 2017-2022(US$ Bn)
TABLE 128 Spain Reusable incontinence products market, By Size, 2023-2030(US$ Bn)
TABLE 129 Spain Reusable incontinence products market, By Sales Channel, 2017-2022(US$ Bn)
TABLE 130 Spain Reusable incontinence products market, By Sales Channel, 2023-2030(US$ Bn)
TABLE 131 Rest of Europe Reusable incontinence products market, By Product Type, 2017-2022(US$ Bn)
TABLE 132 Rest of Europe  Reusable incontinence products market, By Product Type, 2023-2030(US$ Bn)
TABLE 133 Rest of Europe Reusable incontinence products market, by End-User, 2017-2022(US$ Bn)
TABLE 134 Rest of Europe Reusable incontinence products market, by End-User, 2023-2030(US$ Bn)
TABLE 135 Rest of Europe Reusable incontinence products market, By Price Range, 2017-2022(US$ Bn)
TABLE 136 Rest of Europe Reusable incontinence products market, By Price Range, 2023-2030(US$ Bn)
TABLE 137 Rest of Europe Reusable incontinence products market, By Size, 2017-2022(US$ Bn)
TABLE 138 Rest of Europe Reusable incontinence products market, By Size, 2023-2030(US$ Bn)
TABLE 139 Rest of Europe Reusable incontinence products market, By Sales Channel, 2017-2022(US$ Bn)
TABLE 140 Rest of Europe Reusable incontinence products market, By Sales Channel, 2023-2030(US$ Bn)
TABLE 141 Asia Pacific Reusable incontinence products market, By Product Type, 2017-2022(US$ Bn)
TABLE 142 Asia Pacific  Reusable incontinence products market, By Product Type, 2023-2030(US$ Bn)
TABLE 143 Asia Pacific Reusable incontinence products market, by End-User, 2017-2022(US$ Bn)
TABLE 144 Asia Pacific Reusable incontinence products market, by End-User, 2023-2030(US$ Bn)|
TABLE 145 Asia Pacific Reusable incontinence products market, By Price Range, 2017-2022(US$ Bn)
TABLE 146 Asia Pacific Reusable incontinence products market, By Price Range, 2023-2030(US$ Bn)
TABLE 147 Asia Pacific Reusable incontinence products market, By Size, 2017-2022(US$ Bn)
TABLE 148 Asia Pacific Reusable incontinence products market, By Size, 2023-2030(US$ Bn)
TABLE 149 Asia Pacific Reusable incontinence products market, By Sales Channel, 2017-2022(US$ Bn)
TABLE 150 Asia Pacific Reusable incontinence products market, By Sales Channel, 2023-2030(US$ Bn)
TABLE 151 China Reusable incontinence products market, By Product Type, 2017-2022(US$ Bn)
TABLE 152 China  Reusable incontinence products market, By Product Type, 2023-2030(US$ Bn)
TABLE 153 China Reusable incontinence products market, by End-User, 2017-2022(US$ Bn)
TABLE 154 China Reusable incontinence products market, by End-User, 2023-2030(US$ Bn)
TABLE 155 China Reusable incontinence products market, By Price Range, 2017-2022(US$ Bn)
TABLE 156 China Reusable incontinence products market, By Price Range, 2023-2030(US$ Bn)
TABLE 157 China Reusable incontinence products market, By Size, 2017-2022(US$ Bn)
TABLE 158 China Reusable incontinence products market, By Size, 2023-2030(US$ Bn)
TABLE 159 China Reusable incontinence products market, By Sales Channel, 2017-2022(US$ Bn)
TABLE 160 China Reusable incontinence products market, By Sales Channel, 2023-2030(US$ Bn)
TABLE 161 Japan Reusable incontinence products market, By Product Type, 2017-2022(US$ Bn)
TABLE 162 Japan  Reusable incontinence products market, By Product Type, 2023-2030(US$ Bn)
TABLE 163 Japan Reusable incontinence products market, by End-User, 2017-2022(US$ Bn)
TABLE 164 Japan Reusable incontinence products market, by End-User, 2023-2030(US$ Bn)
TABLE 165 Japan Reusable incontinence products market, By Price Range, 2017-2022(US$ Bn)
TABLE 166 Japan Reusable incontinence products market, By Price Range, 2023-2030(US$ Bn)
TABLE 167 Japan Reusable incontinence products market, By Size, 2017-2022(US$ Bn)
TABLE 168 Japan Reusable incontinence products market, By Size, 2023-2030(US$ Bn)
TABLE 169 Japan Reusable incontinence products market, By Sales Channel, 2017-2022(US$ Bn)
TABLE 170 Japan Reusable incontinence products market, By Sales Channel, 2023-2030(US$ Bn)
TABLE 171 India Reusable incontinence products market, By Product Type, 2017-2022(US$ Bn)
TABLE 172 India  Reusable incontinence products market, By Product Type, 2023-2030(US$ Bn)
TABLE 173 India Reusable incontinence products market, by End-User, 2017-2022(US$ Bn)
TABLE 174 India Reusable incontinence products market, by End-User, 2023-2030(US$ Bn)
TABLE 175 India Reusable incontinence products market, By Price Range, 2017-2022(US$ Bn)
TABLE 176 India Reusable incontinence products market, By Price Range, 2023-2030(US$ Bn)
TABLE 177 India Reusable incontinence products market, By Size, 2017-2022(US$ Bn)
TABLE 178 India Reusable incontinence products market, By Size, 2023-2030(US$ Bn)
TABLE 179 India Reusable incontinence products market, By Sales Channel, 2017-2022(US$ Bn)
TABLE 180 India Reusable incontinence products market, By Sales Channel, 2023-2030(US$ Bn)
TABLE 181 South Korea Reusable incontinence products market, By Product Type, 2017-2022(US$ Bn)
TABLE 182 South Korea  Reusable incontinence products market, By Product Type, 2023-2030(US$ Bn)
TABLE 183 South Korea Reusable incontinence products market, by End-User, 2017-2022(US$ Bn)
TABLE 184 South Korea Reusable incontinence products market, by End-User, 2023-2030(US$ Bn)
TABLE 185 South Korea Reusable incontinence products market, By Price Range, 2017-2022(US$ Bn)
TABLE 186 South Korea Reusable incontinence products market, By Price Range, 2023-2030(US$ Bn)
TABLE 187 South Korea Reusable incontinence products market, By Size, 2017-2022(US$ Bn)
TABLE 188 South Korea Reusable incontinence products market, By Size, 2023-2030(US$ Bn)
TABLE 189 South Korea Reusable incontinence products market, By Sales Channel, 2017-2022(US$ Bn)
TABLE 190 South Korea Reusable incontinence products market, By Sales Channel, 2023-2030(US$ Bn)
TABLE 191 South-East Asia Reusable incontinence products market, By Product Type, 2017-2022(US$ Bn)
TABLE 192 South-East Asia  Reusable incontinence products market, By Product Type, 2023-2030(US$ Bn)
TABLE 193 South-East Asia Reusable incontinence products market, by End-User, 2017-2022(US$ Bn)
TABLE 194 South-East Asia Reusable incontinence products market, by End-User, 2023-2030(US$ Bn)
TABLE 195 South-East Asia Reusable incontinence products market, By Price Range, 2017-2022(US$ Bn)
TABLE 196 South-East Asia Reusable incontinence products market, By Price Range, 2023-2030(US$ Bn)
TABLE 197 South-East Asia Reusable incontinence products market, By Size, 2017-2022(US$ Bn)
TABLE 198 South-East Asia Reusable incontinence products market, By Size, 2023-2030(US$ Bn)
TABLE 199 South-East Asia Reusable incontinence products market, By Sales Channel, 2017-2022(US$ Bn)
TABLE 200 South-East Asia Reusable incontinence products market, By Sales Channel, 2023-2030(US$ Bn)
TABLE 201 Rest of Asia Pacific Reusable incontinence products market, By Product Type, 2017-2022(US$ Bn)
TABLE 202 Rest of Asia Pacific  Reusable incontinence products market, By Product Type, 2023-2030(US$ Bn)
TABLE 203 Rest of Asia Pacific Reusable incontinence products market, by End-User, 2017-2022(US$ Bn)
TABLE 204 Rest of Asia Pacific Reusable incontinence products market, by End-User, 2023-2030(US$ Bn)
TABLE 205 Rest of Asia Pacific Reusable incontinence products market, By Price Range, 2017-2022(US$ Bn)
TABLE 206 Rest of Asia Pacific Reusable incontinence products market, By Price Range, 2023-2030(US$ Bn)
TABLE 207 Rest of Asia Pacific Reusable incontinence products market, By Size, 2017-2022(US$ Bn)
TABLE 208 Rest of Asia Pacific Reusable incontinence products market, By Size, 2023-2030(US$ Bn)
TABLE 209 Rest of Asia Pacific Reusable incontinence products market, By Sales Channel, 2017-2022(US$ Bn)
TABLE 210 Rest of Asia Pacific Reusable incontinence products market, By Sales Channel, 2023-2030(US$ Bn)
TABLE 211 Latin America Reusable incontinence products market, By Product Type, 2017-2022(US$ Bn
TABLE 212 Latin America  Reusable incontinence products market, By Product Type, 2023-2030(US$ Bn)}
TABLE 213 Latin America Reusable incontinence products market, by End-User, 2017-2022(US$ Bn)
TABLE 214 Latin America Reusable incontinence products market, by End-User, 2023-2030(US$ Bn)
TABLE 215 Latin America Reusable incontinence products market, By Price Range, 2017-2022(US$ Bn
TABLE 216 Latin America Reusable incontinence products market, By Price Range, 2023-2030(US$ Bn)
TABLE 217 Latin America Reusable incontinence products market, By Size, 2017-2022(US$ Bn)
TABLE 218 Latin America Reusable incontinence products market, By Size, 2023-2030(US$ Bn)
TABLE 219 Latin America Reusable incontinence products market, By Sales Channel, 2017-2022(US$ Bn)
TABLE 220 Latin America Reusable incontinence products market, By Sales Channel, 2023-2030(US$ Bn)
TABLE 221 Brazil Reusable incontinence products market, By Product Type, 2017-2022(US$ Bn)
TABLE 222 Brazil  Reusable incontinence products market, By Product Type, 2023-2030(US$ Bn)
TABLE 223 Brazil Reusable incontinence products market, by End-User, 2017-2022(US$ Bn)
TABLE 224 Brazil Reusable incontinence products market, by End-User, 2023-2030(US$ Bn)
TABLE 225 Brazil Reusable incontinence products market, By Price Range, 2017-2022(US$ Bn)
TABLE 226 Brazil Reusable incontinence products market, By Price Range, 2023-2030(US$ Bn)
TABLE 227 Brazil Reusable incontinence products market, By Size, 2017-2022(US$ Bn)
TABLE 228 Brazil Reusable incontinence products market, By Size, 2023-2030(US$ Bn)
TABLE 229 Brazil Reusable incontinence products market, By Sales Channel, 2017-2022(US$ Bn)
TABLE 230 Brazil Reusable incontinence products market, By Sales Channel, 2023-2030(US$ Bn)
TABLE 231 Argentina Reusable incontinence products market, By Product Type, 2017-2022(US$ Bn)
TABLE 232 Argentina  Reusable incontinence products market, By Product Type, 2023-2030(US$ Bn)
TABLE 233 Argentina Reusable incontinence products market, by End-User, 2017-2022(US$ Bn)
TABLE 234 Argentina Reusable incontinence products market, by End-User, 2023-2030(US$ Bn)
TABLE 235 Argentina Reusable incontinence products market, By Price Range, 2017-2022(US$ Bn)
TABLE 236 Argentina Reusable incontinence products market, By Price Range, 2023-2030(US$ Bn)
TABLE 237 Argentina Reusable incontinence products market, By Size, 2017-2022(US$ Bn)
TABLE 238 Argentina Reusable incontinence products market, By Size, 2023-2030(US$ Bn)
TABLE 239 Argentina Reusable incontinence products market, By Sales Channel, 2017-2022(US$ Bn)
TABLE 240 Argentina Reusable incontinence products market, By Sales Channel, 2023-2030(US$ Bn)
TABLE 241 Rest of Latin America Reusable incontinence products market, By Product Type, 2017-2022(US$ Bn)
TABLE 242 Rest of Latin America  Reusable incontinence products market, By Product Type, 2023-2030(US$ Bn)
TABLE 243 Rest of Latin America Reusable incontinence products market, by End-User, 2017-2022(US$ Bn)
TABLE 244 Rest of Latin America Reusable incontinence products market, by End-User, 2023-2030(US$ Bn)
TABLE 245 Rest of Latin America Reusable incontinence products market, By Price Range, 2017-2022(US$ Bn)
TABLE 246 Rest of Latin America Reusable incontinence products market, By Price Range, 2023-2030(US$ Bn)
TABLE 247 Rest of Latin America Reusable incontinence products market, By Size , 2017-2022(US$ Bn)
TABLE 248 Rest of Latin America Reusable incontinence products market, By Size, 2023-2030(US$ Bn)
TABLE 249 Rest of Latin America Reusable incontinence products market, By Sales Channel , 2017-2022(US$ Bn)
TABLE 250 Rest of Latin America Reusable incontinence products market, By Sales Channel, 2023-2030(US$ Bn)
TABLE 251 Middle East and Africa Reusable incontinence products market, By Product Type, 2017-2022(US$ Bn)
TABLE 252 Middle East and Africa  Reusable incontinence products market, By Product Type, 2023-2030(US$ Bn)
TABLE 253 Middle East and Africa Reusable incontinence products market, by End-User, 2017-2022(US$ Bn)
TABLE 254 Middle East and Africa Reusable incontinence products market, by End-User, 2023-2030(US$ Bn)
TABLE 255 Middle East and Africa Reusable incontinence products market, By Price Range, 2017-2022(US$ Bn)
TABLE 256 Middle East and Africa Reusable incontinence products market, By Price Range, 2023-2030(US$ Bn)
TABLE 257 Middle East and Africa Reusable incontinence products market, By Size, 2017-2022(US$ Bn)
TABLE 258 Middle East and Africa Reusable incontinence products market, By Sales Channel, 2023-2030(US$ Bn)
TABLE 259 Middle East and Africa Reusable incontinence products market, By Sales Channel, 2017-2022(US$ Bn)
TABLE 260 GCC Countries Reusable incontinence products market, By Product Type, 2017-2022(US$ Bn)
TABLE 261 GCC Countries  Reusable incontinence products market, By Product Type, 2023-2030(US$ Bn)
TABLE 262 GCC Countries Reusable incontinence products market, by End-User, 2017-2022(US$ Bn)
TABLE 263 GCC Countries Reusable incontinence products market, by End-User, 2023-2030(US$ Bn)
TABLE 264 GCC Countries Reusable incontinence products market, By Price Range, 2017-2022(US$ Bn)
TABLE 265 GCC Countries Reusable incontinence products market, By Price Range, 2023-2030(US$ Bn)
TABLE 266 GCC Countries Reusable incontinence products market, By Size, 2017-2022(US$ Bn)
TABLE 267 GCC Countries Reusable incontinence products market, By Size, 2023-2030(US$ Bn)
TABLE 268 GCC Countries Reusable incontinence products market, By Sales Channel, 2017-2022(US$ Bn)
TABLE 269 GCC Countries Reusable incontinence products market, By Sales Channel, 2023-2030(US$ Bn)
TABLE 270 South Africa Reusable incontinence products market, By Product Type, 2017-2022(US$ Bn)
TABLE 271 South Africa  Reusable incontinence products market, By Product Type, 2023-2030(US$ Bn)
TABLE 272 South Africa Reusable incontinence products market, by End-User, 2017-2022(US$ Bn)
TABLE 273 South Africa Reusable incontinence products market, by End-User, 2023-2030(US$ Bn)
TABLE 274 South Africa Reusable incontinence products market, By Price Range, 2017-2022(US$ Bn)
TABLE 275 South Africa Reusable incontinence products market, By Price Range, 2023-2030(US$ Bn)
TABLE 276 South Africa Reusable incontinence products market, By Size, 2017-2022(US$ Bn)
TABLE 277 South Africa Reusable incontinence products market, By Size, 2023-2030(US$ Bn)
TABLE 278 South Africa Reusable incontinence products market, By Sales Channel, 2017-2022(US$ Bn)
TABLE 279 South Africa Reusable incontinence products market, By Sales Channel, 2023-2030(US$ Bn)
TABLE 280 Rest of Middle East and Africa Reusable incontinence products market, By Product Type, 2017-2022(US$ Bn)
TABLE 281 Rest of Middle East and Africa  Reusable incontinence products market, By Product Type, 2023-2030(US$ Bn)
TABLE 282 Rest of Middle East and Africa Reusable incontinence products market, by End-User, 2017-2022(US$ Bn)
TABLE 283 Rest of Middle East and Africa Reusable incontinence products market, by End-User, 2023-2030(US$ Bn)
TABLE 284 Rest of Middle East and Africa Reusable incontinence products market, By Price Range, 2017-2022(US$ Bn)
TABLE 285 Rest of Middle East and Africa Reusable incontinence products market, By Price Range, 2023-2030(US$ Bn)
TABLE 286 Rest of Middle East and Africa Reusable incontinence products market, By Size, 2017-2022(US$ Bn)
TABLE 287 Rest of Middle East and Africa Reusable incontinence products market, By Size, 2023-2030(US$ Bn)
TABLE 288 Rest of Middle East and Africa Reusable incontinence products market, By Sales Channel, 2017-2022(US$ Bn)
TABLE 289 Rest of Middle East and Africa Reusable incontinence products market, By Sales Channel, 2023-2030(US$ Bn)

Frequently Asked Questions

What is the current size of the global Reusable incontinence products market?

The global Reusable incontinence products market was valued at USD 515.9 Million in 2022.

What is the expected growth rate of the Reusable incontinence products market between 2023 and 2030?

The Reusable incontinence products market is expected to grow at a CAGR of 6.30% between 2023 and 2030, reaching USD 791.2 Million in 2030.

Which segment is leading the market share in terms of Product Type?

In 2022, reusable incontinence pads accounted for 32% of total sales.

Which End-User segment governs the demand for Reusable incontinence productss in the world?

The women’s reusable incontinence goods market governs global demand for reusable incontinence products.

Which segment is expected to post the highest CAGR during the forecast period?

The Premium (US$ 75 & Above) Reusable Incontinence Products segment is expected to have the highest CAGR (Compound Annual Growth Rate) in the market.

Which region is fueling the growth of the Reusable incontinence products industry?

North America dominates the incontinence products market, accounting for around 40% of the global market share in 2022.

Who are the major players in the global Reusable incontinence products market?

The top players include Kimberly-Clark Corporation, The Proctor & Gamble Company, MediFabrik SRL, Cardinal Health, Inc. Other major players include Royal Medical Solutions, Inc., Abena Group, Unicharm Corporation, Prevail, and Dryloch Technologies NV, among others.

What are the major market drivers of the Reusable incontinence products industry?

Product Development and Adult Population Growth are the major market drivers.

What are the major market restraints of the Reusable incontinence products industry?

Limited Availability and Disposable Products Pose a Risk are the major market restraints.

What are the major market opportunities of the Reusable incontinence products industry?

Increasing Interest in Eco-Friendly Solutions and an Aging Population are the major opportunities in the Reusable incontinence products industry.

Endoscopic Submucosal Dissection (ESD) Market

Published:
Report ID: 37490

Hyperthermia Cancer Treatment Market

Published:
Report ID: 37492

Australia Veterinary Imaging Market

Published:
Report ID: 37574

Japan’s Pharmacy Automation Market

Published:
Report ID: 37511

Syringes Market

Published:
Report ID: 37485

Sterile Active Pharmaceutical Ingredient Market

Published:
Report ID: 37476

Organ Preservation Solutions Market

Published:
Report ID: 37472

Middle East and Africa Veterinary Vaccines Market

Published:
Report ID: 37309

North America Cancer Therapy Market

Published:
Report ID: 37315

Liver Health Supplements Market

Published:
Report ID: 37298

Asia Pacific Stem Cell Therapy Market

Published:
Report ID: 37280

Walking Assist Devices Market

Published:
Report ID: 37276

Purchase Options

$2999
Delivery Format: Excel.
$4999
Designed for the individual purchaser.
$6999
Users located at a single corporate site or regional office.
$7999
Allowed for unlimited sharing globally within one company.
Smallform of Sample request

Have a question?

User Profile

Don’t settle for less – trust Mitul to help you find the best solution.

Report delivery within 24 to 48 hours

– Other Info –

What people say?-

User Review

I am very impressed with the information in this report. The author clearly did their research when they came up with this product and it has already given me a lot of ideas.

Jana Schmidt
CEDAR CX Technologies

– Connect with us –

Phone

+91 6232 49 3207


support

24/7 Research Support


sales@credenceresearch.com

– Research Methodology –

Going beyond the basics: advanced techniques in research methodology

– Trusted By –

Pepshi, LG, Nestle
Motorola, Honeywell, Johnson and johnson
LG Chem, SIEMENS, Pfizer
Unilever, Samsonite, QIAGEN