Market Overview:
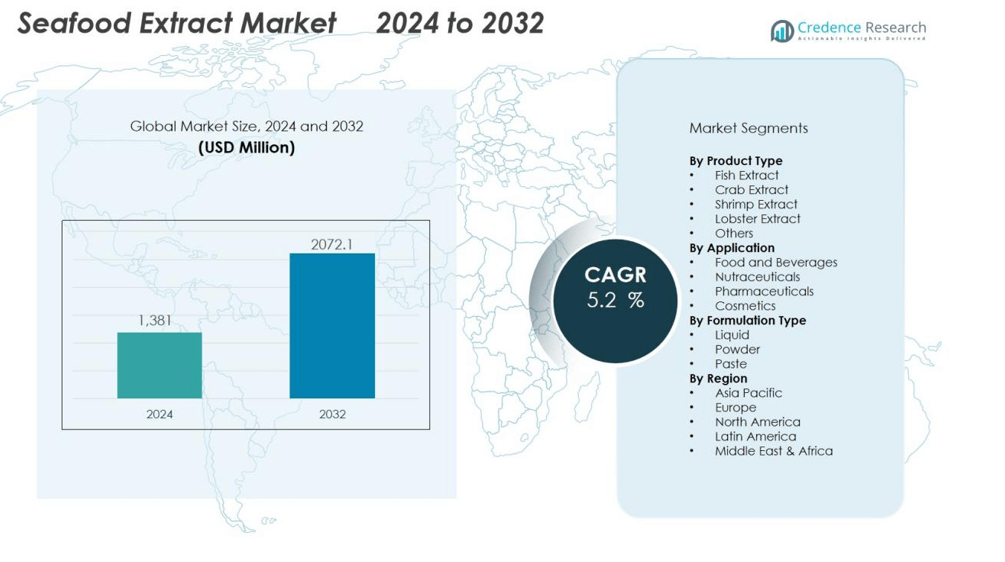
The seafood extract market size was valued at USD 1,381 million in 2024 and is anticipated to reach USD 2072.1 million by 2032, at a CAGR of 5.2 % during the forecast period (2024-2032).
| REPORT ATTRIBUTE |
DETAILS |
| Historical Period |
2020-2023 |
| Base Year |
2024 |
| Forecast Period |
2025-2032 |
| Seafood Extract Market Size 2024 |
USD 1,381 million |
| Seafood Extract Market, CAGR |
5.2% |
| Seafood Extract Market Size 2032 |
USD 2072.1 million |
Key market drivers include the growing focus on protein-rich diets and natural flavoring agents. Increasing awareness of health benefits, such as omega-3 fatty acids, minerals, and antioxidants, strengthens demand across dietary supplements and fortified foods. The rise in processed food consumption, combined with innovation in extraction technologies, further boosts product adoption across diverse applications.
Regionally, Asia-Pacific dominates the market due to abundant raw material availability and high seafood consumption. North America follows, driven by demand for clean-label ingredients and seafood-based nutraceuticals. Europe shows consistent growth, supported by strong seafood processing industries and consumer preference for natural additives. Meanwhile, the Middle East, Africa, and Latin America are emerging markets, fueled by expanding food processing sectors and rising disposable incomes.
Market Insights:
- The seafood extract market was valued at USD 1,381 million in 2024 and is expected to reach USD 1 million by 2032, growing at a CAGR of 5.2 % (2024–2032).
- Rising focus on protein-rich diets and natural flavoring agents supports steady market expansion.
- Increasing awareness of omega-3, minerals, and antioxidants drives demand in dietary supplements and fortified foods.
- Technological innovations such as enzymatic hydrolysis and membrane filtration improve yield, purity, and product quality.
- Asia-Pacific holds 40% share, supported by high seafood consumption, raw material supply, and strong processing capacity.
- North America holds 25% share, led by clean-label demand, dietary supplement growth, and advanced processing industries.
- Europe holds 20% share, supported by strict food safety regulations, consumer preference for natural additives, and sustainability initiatives.
Access crucial information at unmatched prices!
Request your sample report today & start making informed decisions powered by Credence Research Inc.!
Download Sample
Market Drivers:
Rising Demand for Natural Flavor Enhancers:
The seafood extract market benefits from a shift toward natural and clean-label food ingredients. Consumers increasingly prefer seafood-derived extracts over synthetic flavorings in soups, sauces, and ready-to-eat meals. It provides authentic taste profiles that improve product acceptance across diverse cuisines. Food manufacturers use extracts to meet demand for transparency in labeling and natural sourcing.
Expanding Use in Nutraceutical and Dietary Supplements:
Nutritional value strengthens the adoption of seafood extracts in health-focused products. It supplies essential nutrients, including amino acids, omega-3 fatty acids, and trace minerals that support immunity and overall wellness. The rising consumer focus on preventive health care increases demand for seafood-based supplements. Manufacturers are investing in research to create concentrated extracts with targeted health benefits.
- For instance, DSM’s life’s™Omega 60 algal oil provides a minimum of 300 mg/g DHA and 150 mg/g EPA—totaling at least 500 mg/g of combined omega-3 fatty acids in a single-source marine-derived ingredient 500 mg/g.
Advancements in Extraction Technologies Enhancing Quality:
The seafood extract market gains from innovation in extraction methods that improve yield and preserve nutrients. Advanced technologies such as enzymatic hydrolysis and membrane filtration enhance purity and flavor concentration. It allows producers to meet strict quality and safety standards in food and pharmaceutical applications. Continuous improvement in processing methods reduces waste and strengthens cost efficiency.
Regional Growth Supported by Seafood Consumption Patterns:
High seafood consumption in Asia-Pacific directly supports strong regional demand for extracts. It creates a steady supply chain that benefits local producers and exporters. North America and Europe follow with rising demand in functional foods and dietary supplements. Growing awareness of health benefits linked to seafood-based ingredients expands market penetration across emerging regions.
- For Instances, DSM, a provider of nutritional ingredients, has utilized microencapsulation technology for its omega-3 concentrates. The process of microencapsulation, which can involve particle size reduction, is a standard industry practice used to enhance the stability, delivery, and bioavailability of omega-3s.
Market Trends:
Growing Integration of Seafood Extracts in Functional and Convenience Foods:
The seafood extract market shows strong adoption in functional foods and convenience products. Consumers seek nutrient-dense options that combine flavor with health benefits, making seafood extracts highly attractive. It is increasingly used in soups, sauces, instant noodles, and fortified snacks to provide natural taste and added nutrition. Rising demand for protein-rich and omega-3 enriched products fuels this trend further. Food manufacturers highlight clean-label and sustainable sourcing to align with evolving consumer values. Expansion of quick-service restaurants and ready-to-eat meals continues to reinforce the need for seafood-based flavor enhancers.
- For instance, Trident Seafoods’ Motley, Minnesota facility is North America’s largest surimi producer with an annual capacity exceeding 100 million pounds, supplying protein-rich seafood extracts for use in various ready-to-eat and quick-service food products.
Technological Innovations and Product Diversification Supporting Market Expansion:
Continuous advancements in extraction processes support higher-quality outputs with improved flavor intensity and nutrient retention. The seafood extract market benefits from product diversification into capsules, powders, and liquid forms, which cater to food, nutraceutical, and cosmetic industries. It enables flexible use across a wide variety of formulations, expanding the scope for innovation. Sustainability remains a growing trend, with manufacturers focusing on by-product utilization and eco-friendly processing. Rising global awareness of marine-sourced health benefits strengthens opportunities for premium seafood-derived products. This trend pushes companies to invest in research and marketing that highlight both functionality and sustainability.
- In 2019, Marine Harvest changed its name to Mowi and launched its premium MOWI-branded Atlantic salmon line, emphasizing its high omega-3 content and sustainable farming practices. This was part of a broader shift to focus on high-end, value-added salmon products like fillets, steaks, and smoked salmon, rather than a large portfolio of specific seafood extracts like collagen powders.
Market Challenges Analysis:
Supply Chain Vulnerabilities and Seasonal Dependency:
The seafood extract market faces challenges from unstable supply chains and seasonal raw material availability. Harvest fluctuations, overfishing concerns, and strict fishing regulations often disrupt production capacity. It raises costs for manufacturers and creates inconsistency in meeting global demand. Dependence on specific marine species further increases vulnerability to environmental changes and climate effects. Limited cold storage and processing infrastructure in some regions adds pressure to maintain quality standards. These factors create uncertainty for both producers and buyers.
High Production Costs and Regulatory Constraints:
Extracting seafood-derived compounds requires advanced processing methods that drive up operational expenses. The seafood extract market often struggles with balancing cost efficiency and product quality, particularly in nutraceutical and pharmaceutical applications. It must also comply with stringent food safety and labeling regulations, which vary across regions. Meeting these requirements demands significant investment in technology and certification. High competition from plant-based and synthetic alternatives adds pressure on market pricing. Together, these barriers restrict scalability and limit smaller players from expanding their operations.
Market Opportunities:
Rising Demand for Functional Foods and Nutraceuticals:
The seafood extract market presents strong opportunities in the growing functional food and nutraceutical sectors. Consumers increasingly seek natural sources of protein, omega-3, and bioactive compounds for preventive health care. It positions seafood extracts as valuable ingredients in supplements, fortified beverages, and dietary products. Expanding awareness of marine-based nutrition opens doors for new formulations targeting immunity, brain health, and cardiovascular support. Global shifts toward healthier lifestyles create consistent demand for clean-label, nutrient-dense options. These factors push manufacturers to explore innovative product launches in health-focused categories.
Expanding Applications Across Cosmetics and Pharmaceuticals:
The use of seafood extracts in cosmetics and pharmaceuticals creates new avenues for revenue growth. It is recognized for properties that support skin hydration, anti-aging, and wound healing, driving adoption in personal care formulations. Pharmaceutical applications also expand, supported by research into bioactive compounds with anti-inflammatory and antimicrobial benefits. Rising consumer acceptance of natural and marine-derived ingredients strengthens trust in such products. Growing investment in sustainable sourcing and advanced extraction technologies further broadens opportunities. This trend allows companies to diversify offerings while meeting evolving industry requirements.
Market Segmentation Analysis:
By Product Type:
The seafood extract market by product type includes fish, crab, shrimp, lobster, and others. Fish-based extracts dominate due to wide availability and strong nutritional value. Shrimp and crab extracts hold demand in soups, sauces, and snacks for their distinct taste. Lobster extracts are positioned in premium food applications, catering to niche consumer groups. It ensures versatility across both mass-market and specialty products.
- For instance, Omega Protein Corporation’s Reedville, Virginia Health and Science Center processes up to 100 metric tons of fish oil per day using state-of-the-art refining, bleaching, fractionation, and deodorization equipment (HSC capacity: 100 t/day)
By Application:
The seafood extract market by application covers food and beverages, nutraceuticals, pharmaceuticals, and cosmetics. Food and beverages lead the segment, with extracts used to enhance flavors in noodles, sauces, and ready meals. Nutraceuticals follow with strong demand for omega-3 enriched and protein-based supplements. It supports growth in capsules, powders, and fortified drinks. Cosmetics benefit from extracts with anti-aging and moisturizing properties, while pharmaceuticals explore bioactive compounds for therapeutic uses.
- For instance, oral supplementation with Low-Molecular-Weight Collagen Peptide (LMWCP) at 1 g/day increased skin hydration by 7.23-fold over placebo after 6 weeks in a randomized, double-blind trial20.
By Formulation Type:
The seafood extract market by formulation type includes liquid, powder, and paste forms. Powdered extracts are widely used for their stability, easy storage, and long shelf life. Liquid extracts remain popular in instant meals and sauces for concentrated taste. Paste extracts continue to serve traditional recipes and specialty foods. It provides flexibility across diverse applications while meeting different manufacturing needs.
Segmentations:
By Product Type:
- Fish Extract
- Crab Extract
- Shrimp Extract
- Lobster Extract
- Others
By Application:
- Food and Beverages
- Nutraceuticals
- Pharmaceuticals
- Cosmetics
By Formulation Type:
By Region:
- North America
- Europe
- UK
- France
- Germany
- Italy
- Spain
- Russia
- Belgium
- Netherlands
- Austria
- Sweden
- Poland
- Denmark
- Switzerland
- Rest of Europe
- Asia Pacific
- China
- Japan
- South Korea
- India
- Australia
- Thailand
- Indonesia
- Vietnam
- Malaysia
- Philippines
- Taiwan
- Rest of Asia Pacific
- Latin America
- Brazil
- Argentina
- Peru
- Chile
- Colombia
- Rest of Latin America
- Middle East
- UAE
- KSA
- Israel
- Turkey
- Iran
- Rest of Middle East
- Africa
- Egypt
- Nigeria
- Algeria
- Morocco
- Rest of Africa
Regional Analysis:
Asia-Pacific:
Asia-Pacific holds 40% market share, making it the leading region for the seafood extract market. The region benefits from high seafood consumption, abundant raw material availability, and strong processing capabilities. It supports large-scale production and export to international markets. Countries such as China, Japan, and Thailand drive growth with established seafood industries and rising demand for functional food products. Nutraceutical applications are expanding rapidly in the region due to growing health awareness. Government support for sustainable fisheries strengthens supply stability and ensures long-term growth opportunities.
North America:
North America accounts for 25% market share, reflecting strong demand for natural food ingredients and nutraceuticals. Consumers prioritize clean-label, protein-rich, and omega-3 fortified products, which drives steady uptake of seafood extracts. It also benefits from the region’s advanced food processing sector and strong focus on dietary supplements. The United States leads the market due to innovation in functional food and supplement formulations. Canada supports growth with seafood-based exports and increasing interest in marine-derived skincare products. Rising investment in research on bioactive compounds further supports expansion.
Europe:
Europe holds 20% market share, supported by a strong seafood processing industry and preference for natural additives. The seafood extract market in the region benefits from strict food safety regulations that favor clean-label sourcing. It finds steady application in nutraceuticals, functional foods, and cosmetics, driven by health-conscious consumers. Countries such as Germany, France, and the United Kingdom show consistent adoption across multiple industries. Sustainability initiatives in fisheries and processing strengthen regional supply chains. Growing demand for eco-friendly and marine-derived ingredients further reinforces the market’s expansion potential.
Shape Your Report to Specific Countries or Regions & Enjoy 30% Off!
Key Player Analysis:
- Nikken Foods
- Agri Bio Care India
- Acadian Seaplants Ltd
- Kakusan Foods Co. Ltd
- Sar Agrochemicals & Fertilizers Pvt. Ltd
- Sushil Corporation
- Suboneyo Chemicals Pharmaceuticals (P) Limited
- Canada Oceanic
Competitive Analysis:
The seafood extract market is shaped by a mix of global and regional players focusing on product quality, innovation, and sustainable sourcing. Key companies include Nikken Foods, Agri Bio Care India, Acadian Seaplants Ltd, Kakusan Foods Co. Ltd, Sar Agrochemicals & Fertilizers Pvt. Ltd, and Sushil Corporation. These firms compete by expanding product portfolios across food, nutraceutical, and cosmetic applications. It strengthens competitiveness by investing in advanced extraction technologies that enhance nutrient preservation and flavor intensity. Companies also emphasize sustainable supply chains to align with consumer demand for eco-friendly products. Strategic partnerships, research initiatives, and regional expansions are key approaches adopted to build market presence. With rising global demand for natural and functional ingredients, competition is expected to intensify among established brands and emerging players.
Recent Developments:
- In June 2025, Acadian Seaplants Limited reaffirmed its commitment to the UN Global Compact by submitting its 2025 Communication on Progress, emphasizing sustainable seaweed solutions and continued industry innovation.
- In August 2025, Canada Oceanic completed an off-market private share transaction on August 12, 2025, involving the sale of 12,480,125 common shares to several purchasers, including insiders, without changing the total number of issued and outstanding shares.
Report Coverage:
The research report offers an in-depth analysis based on Product Type, Application, Formulation Type and Region. It details leading Market players, providing an overview of their business, product offerings, investments, revenue streams, and key applications. Additionally, the report includes insights into the competitive environment, SWOT analysis, current Market trends, as well as the primary drivers and constraints. Furthermore, it discusses various factors that have driven Market expansion in recent years. The report also explores Market dynamics, regulatory scenarios, and technological advancements that are shaping the industry. It assesses the impact of external factors and global economic changes on Market growth. Lastly, it provides strategic recommendations for new entrants and established companies to navigate the complexities of the Market.
Future Outlook:
- Rising demand for natural flavor enhancers will continue to support wider adoption of seafood extracts.
- Expanding applications in nutraceuticals will strengthen opportunities in health supplements and fortified foods.
- Technological advancements in extraction methods will improve yield, quality, and nutrient preservation.
- Increasing focus on clean-label and sustainable products will shape future production strategies.
- Growth in functional beverages and protein-enriched snacks will create new revenue streams.
- Rising popularity of marine-based skincare and personal care products will expand cosmetic applications.
- Pharmaceutical research on bioactive properties will drive usage in immunity and therapeutic formulations.
- Strengthening supply chains and sustainable fisheries will ensure stability in raw material sourcing.
- Expansion of e-commerce platforms will increase consumer access to seafood-based ingredients globally.
- Growing awareness of marine nutrition benefits will push manufacturers to invest in product innovation.



