
Market Overview
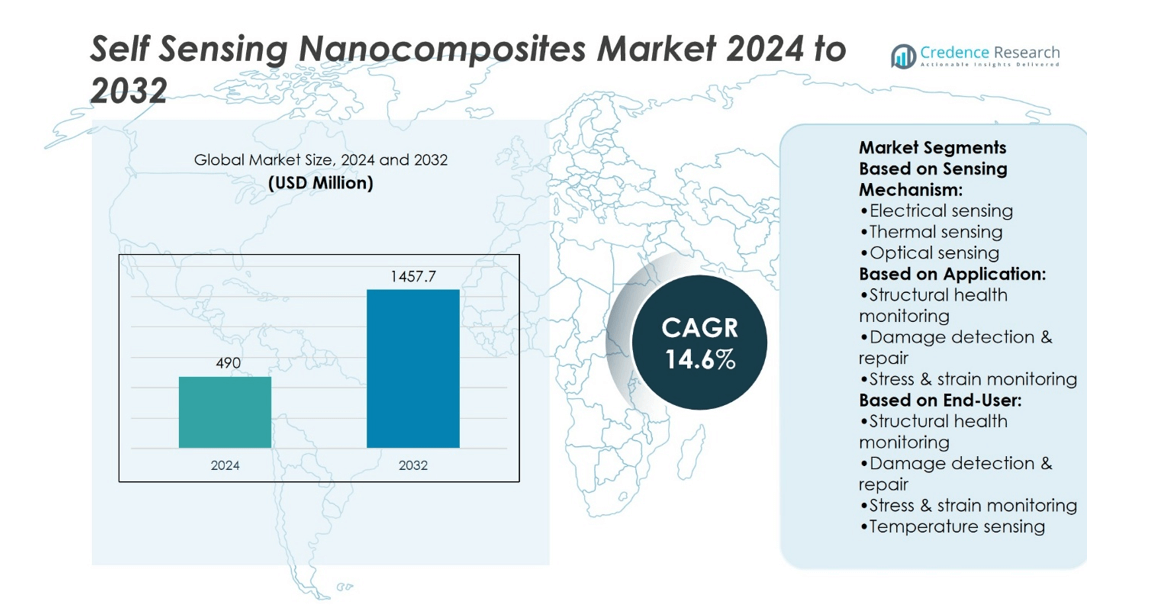
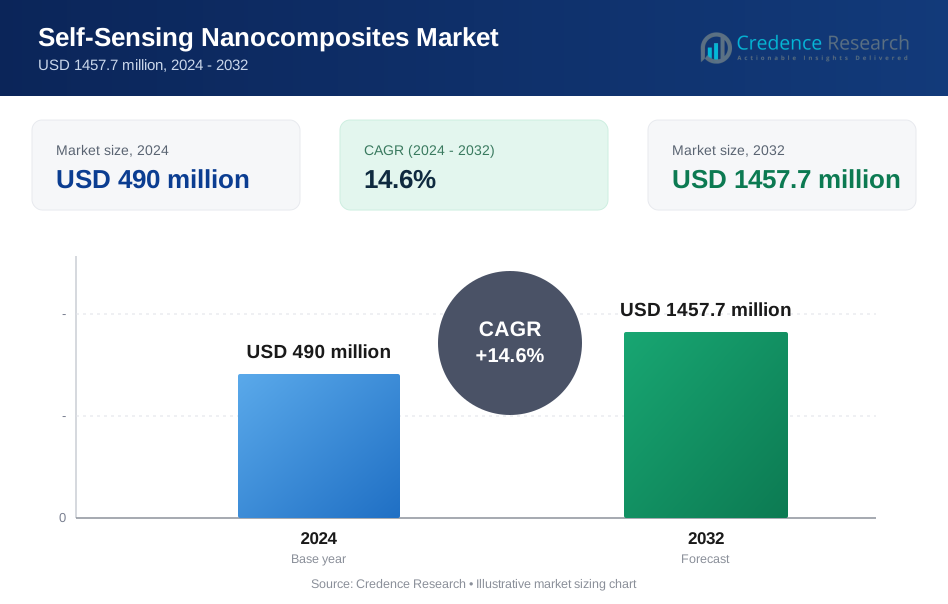
Self-Sensing Nanocomposites Market size was valued at USD 490 million in 2024 and is anticipated to reach USD 1457.7 million by 2032, at a CAGR of 14.6% during the forecast period.
| REPORT ATTRIBUTE | DETAILS |
|---|---|
| Historical Period | 2020-2023 |
| Base Year | 2024 |
| Forecast Period | 2025-2032 |
| Self-Sensing Nanocomposites Market Size 2024 | USD 490 million |
| Self-Sensing Nanocomposites Market, CAGR | 14.6% |
| Self-Sensing Nanocomposites Market Size 2032 | USD 1457.7 million |
The Self-Sensing Nanocomposites Market is driven by rising demand for advanced materials that combine structural strength with real-time monitoring functions. Industries such as aerospace, automotive, and civil infrastructure adopt these composites to enhance safety, extend lifespan, and reduce maintenance costs. Strong research in carbon nanotubes, graphene, and hybrid fillers improves conductivity and sensing precision. Trends highlight growing integration into smart infrastructure, electric mobility, and renewable energy systems. It supports predictive maintenance and sustainability goals, while multifunctional designs expand opportunities across electronics, defense, and industrial sectors, positioning Self-Sensing nanocomposites as essential materials for next-generation applications.
The Self-Sensing Nanocomposites Market shows strong presence across North America, Europe, Asia-Pacific, Latin America, and the Middle East & Africa, with North America leading through advanced aerospace and automotive adoption, and Asia-Pacific growing rapidly with infrastructure and electronics demand. Europe benefits from sustainability initiatives and strong R&D programs. Key players shaping the market include Arkema S.A., Evonik Industries AG, Showa Denko K.K., Cabot Corporation, Zyvex Technologies Inc., Nanocyl SA, RTP Company, Nanophase Technologies Corporation, Nanocor Inc., and DuPont.
Market Insights
- The Self-Sensing Nanocomposites Market size was valued at USD 490 million in 2024 and is projected to reach USD 1457.7 million by 2032, at a CAGR of 14.6%.
- Rising demand for materials combining structural strength with real-time monitoring drives adoption across multiple industries.
- Key trends include integration into smart infrastructure, electric mobility, renewable energy systems, and advanced electronics.
- Competition remains strong with focus on innovation, scalability, and sustainable nanomaterials for high-performance applications.
- Market restraints include high production costs, technical barriers in scaling, and lack of standardization across regions.
- North America leads with aerospace and automotive applications, while Asia-Pacific expands rapidly through infrastructure and electronics demand.
- Europe emphasizes sustainability and strong R&D support, while Latin America and the Middle East & Africa grow steadily in energy and infrastructure projects.
Market Drivers
Rising Demand for Structural Health Monitoring Across Industries
The Self-Sensing Nanocomposites Market benefits from growing emphasis on real-time monitoring in aerospace, automotive, and civil infrastructure. These composites integrate conductive nanomaterials that allow detection of stress, strain, and damage without external sensors. Companies prioritize materials that combine mechanical strength with embedded sensing features. Engineers deploy them in bridges, aircraft, and vehicle components to track performance under varying loads. It improves safety standards by identifying potential failures at early stages. Governments and industry stakeholders adopt these solutions to reduce downtime and extend operational life of assets. This trend positions Self-Sensing materials as vital to next-generation monitoring systems.
- For instance, Nanocyl SA (Belgium) developed the NC7000™ multiwall carbon nanotube with an average diameter of 9.5 nm and a specific surface area of 250 m²/g, enabling epoxy composites to achieve electrical percolation thresholds below 0.1 wt% and stable conductivity above 10² S/m for structural monitoring systems.
Technological Advancements in Nanomaterials and Fabrication Techniques
Progress in carbon nanotubes, graphene, and metallic nanofillers strengthens the capabilities of Self-Sensing composites. The Self-Sensing Nanocomposites Market evolves with advanced dispersion methods that improve conductivity and reliability. Research institutions and manufacturers invest in scalable processes that balance cost with high-quality performance. It enables production of composites with precise sensitivity levels for different applications. New hybrid nanostructures provide improved thermal stability alongside electrical responsiveness. These advancements drive integration into critical sectors where predictive maintenance is essential. Growing patents and pilot projects demonstrate the industry’s push toward widespread adoption.
- For instance, Nanophase Technologies Corporation (U.S.) was issued U.S. Patent No. 7,303,891, titled "Surface Treatment of Nanoparticles to Control Interfacial Properties and Method of Manufacture.
Expanding Applications in Smart Infrastructure and Mobility
Smart cities and electric mobility projects accelerate use of Self-Sensing composites. The Self-Sensing Nanocomposites Market responds to the need for advanced materials in roads, tunnels, and rail systems. It supports embedded sensing networks that deliver continuous structural data. Automotive firms adopt these composites in lightweight parts to improve efficiency and track wear in real time. Aerospace programs integrate them into wings and fuselages for safety-critical monitoring. Urban infrastructure projects increasingly specify materials with built-in sensing features. This expansion signals broad acceptance of Self-Sensing technologies across high-value sectors.
Growing Focus on Sustainability and Lifecycle Cost Reduction
Sustainability priorities reinforce the appeal of Self-Sensing composites in industrial design. The Self-Sensing Nanocomposites Market aligns with efforts to extend material lifespan and reduce waste. It lowers maintenance frequency by enabling predictive diagnostics and early repair. Industries emphasize total lifecycle value, making these composites attractive alternatives to conventional solutions. Eco-friendly nanofillers and recyclable matrices strengthen market relevance in green construction and mobility. Companies highlight reduced energy use during maintenance cycles through embedded sensing functions. This focus ensures steady momentum for adoption in both developed and emerging markets.
Market Trends
Integration of Smart Materials into Next-Generation Infrastructure
The Self-Sensing Nanocomposites Market reflects growing adoption of smart materials in civil and industrial projects. Governments specify composites with sensing functions for bridges, tunnels, and public utilities. It allows real-time monitoring of stress and durability without separate sensor systems. Construction firms recognize the efficiency benefits of embedding sensing directly into structural materials. Research highlights enhanced accuracy in damage detection, even in large-scale infrastructure. Demand strengthens for long-lasting and safer materials that reduce inspection complexity. This integration represents a major trend shaping investment in advanced infrastructure.
- For instance, Arkema’s Graphistrength® C100 multiwall carbon nanotubes feature diameters of approximately 10–15 nm and lengths around 1–10 µm. These nanotubes deliver high electrical conductivity up to 10⁵ S/cm and possess a high tensile modulus of approximately 1,000 GPa at the nanotube level, enabling the enhancement of electrical and mechanical properties in epoxy composites for various applications.
Rising Adoption in Automotive and Aerospace Lightweighting Strategies
Automotive and aerospace sectors lead in exploring Self-Sensing composites for structural and performance improvements. The Self-Sensing Nanocomposites Market gains traction as companies focus on lightweight yet functional materials. It enables vehicles and aircraft to incorporate safety monitoring without added weight. Automakers design panels and body parts that self-diagnose cracks during use. Aerospace engineers integrate sensing composites into wings and fuselage components for continuous monitoring. The combination of weight reduction and active sensing aligns with industry priorities. This adoption signals deeper integration of nanocomposites in mobility solutions.
- For instance, Evonik’s NANOPOX® HP 100 epoxy concentrate contains 40 wt% silica nanoparticles, with dynamic viscosity of 60,000 mPa·s at 25 °C. When incorporated into VARTM resin systems at typical nanosilica loadings, it delivers notably improved modulus, fracture toughness, and thermal and electrical performance—without altering the base resin chemistry.
Expansion of Research into Multifunctional Nanocomposite Systems
Academic and industrial research emphasizes multifunctional composites that provide sensing alongside other properties. The Self-Sensing Nanocomposites Market benefits from advances in hybrid fillers and polymer matrices. It allows development of materials with electrical conductivity, thermal stability, and mechanical strength combined. Universities collaborate with industry to scale production methods for multifunctional designs. Pilot studies show composites capable of detecting both strain and temperature variations simultaneously. Manufacturers view such versatility as critical for broad applications across energy, transport, and electronics. This expansion highlights the push for materials with multiple integrated functions.
Growing Alignment with Sustainability and Circular Economy Goals
Sustainability influences design strategies across the nanocomposites sector. The Self-Sensing Nanocomposites Market responds with bio-based fillers and recyclable polymers. It supports reduced environmental impact while maintaining sensing performance. Industry reports indicate strong interest in composites that extend service life and minimize waste. Renewable nanomaterials such as cellulose-based fillers attract research funding and pilot use. Companies emphasize end-of-life recyclability of composite components in mobility and infrastructure. This alignment with circular economy principles strengthens market acceptance across regions.
Market Challenges Analysis
High Production Costs and Technical Barriers in Large-Scale Adoption
The Self-Sensing Nanocomposites Market faces challenges linked to high production costs and technical complexity. Advanced nanomaterials such as carbon nanotubes and graphene require precision processing, which increases expenses. It limits adoption in cost-sensitive sectors like construction and consumer goods. Manufacturing consistency remains a concern, as dispersion of nanofillers affects conductivity and sensing accuracy. Scaling laboratory successes into industrial production continues to be a hurdle for many companies. Industry stakeholders highlight the need for reliable, repeatable quality control to expand market reach. These factors slow broader penetration despite strong demand for sensing materials.
Limited Standardization and Regulatory Uncertainty Across Regions
Unclear regulatory frameworks create uncertainty for producers and end-users. The Self-Sensing Nanocomposites Market struggles with limited standardization in testing methods and performance benchmarks. It complicates product certification and slows acceptance in aerospace, automotive, and infrastructure projects. Regional variations in safety and environmental guidelines add complexity for global suppliers. Industry reports emphasize the gap between rapid innovation and regulatory adaptation. Stakeholders face delays when aligning product design with evolving rules and standards. Without clear guidelines, adoption rates risk lagging behind technological progress.
Market Opportunities
Expanding Role in Smart Infrastructure and Mobility Projects
The Self-Sensing Nanocomposites Market presents strong opportunities in infrastructure monitoring and smart mobility. Urban development projects demand materials that combine durability with embedded sensing capabilities. It enables continuous tracking of structural integrity in bridges, railways, and tunnels without external devices. Electric and autonomous vehicle programs also encourage integration of Self-Sensing composites in lightweight components. The dual role of structural strength and real-time diagnostics aligns with government investments in resilient infrastructure. Growth in smart city initiatives creates consistent demand for multifunctional materials. These applications position Self-Sensing composites as central to future engineering systems.
Emerging Potential in Renewable Energy and Electronics Industries
Renewable energy systems highlight opportunities for self-healing and Self-Sensing nanocomposites. The Self-Sensing Nanocomposites Market supports wind turbine blades, solar panels, and energy storage units that require predictive maintenance. It reduces downtime while extending service life of expensive energy assets. Electronics and wearable device manufacturers explore nanocomposites for flexible circuits and sensors. Their capacity to detect strain and restore conductivity provides a pathway for innovation in consumer technologies. Companies invest in R&D partnerships to scale production for these high-value applications. These sectors create long-term growth prospects for the adoption of sensing composites.
Market Segmentation Analysis:
By Sensing Mechanism
The Self-Sensing Nanocomposites Market divides into electrical, thermal, optical, magnetic, and acoustic sensing mechanisms. Electrical sensing dominates research and adoption due to its ability to detect strain and stress with high sensitivity through conductive fillers such as carbon nanotubes or graphene. It enables real-time structural monitoring in aerospace and civil engineering applications. Thermal sensing gains traction where heat exposure impacts material reliability, particularly in automotive and energy sectors. Optical sensing offers accuracy for detecting microstructural changes, making it relevant in precision engineering. Magnetic and acoustic sensing remain emerging categories, with potential in niche applications such as vibration monitoring and advanced manufacturing systems. Each mechanism plays a role in matching performance needs across different industries.
- For instance, Powdermet Inc. produces metal and ceramic nanoparticles with sizes ranging from approximately 20 nm to 300 nm in diameter by manipulating process conditions and chemical kinetics.
By Application
Applications reflect the broad functional value of these materials. Structural health monitoring accounts for strong adoption, as nanocomposites provide early detection of microcracks in bridges, tunnels, and aircraft. Damage detection and repair emerge as critical for industries requiring reduced downtime and maintenance costs. Stress and strain monitoring drive demand in aerospace and automotive sectors, where material fatigue must be tracked continuously. Temperature sensing develops for electronics and energy storage systems that require stability across extreme conditions. Pressure sensing supports advanced mechanical systems in industrial machinery and defense equipment. Other applications include wearable devices and flexible electronics, which highlight new growth opportunities.
- For instance, Elementis’ CHARGUARD™ 1000 fire-retardant synergist is recommended at dosing levels of 3.5% to 5% of total formulation weight. It requires a twin-screw extruder with a minimum screw length-to-diameter ratio greater than 40 L/D for optimal dispersion. While processing temperatures depend on the specific thermoplastic, extended exposure to temperatures exceeding 200°C should be avoided to prevent discoloration and degradation.
By End User
End-user segmentation overlaps with application fields but highlights industry-driven demand. Structural health monitoring end users include governments, civil infrastructure authorities, and aerospace operators seeking safer, longer-lasting assets. Damage detection and repair remain priorities for energy producers and automotive manufacturers where unplanned failures are costly. Stress and strain monitoring attracts aerospace and defense industries that require precise reliability under high loads. Temperature sensing finds relevance in electronics and renewable energy firms focusing on efficiency and safety. Pressure sensing appeals to heavy industry and advanced machinery, where operational consistency is vital. Each end-user category reflects how nanocomposites adapt to industry-specific challenges and reinforce the market’s expansion.
Segments:
Based on Sensing Mechanism:
- Electrical sensing
- Thermal sensing
- Optical sensing
Based on Application:
- Structural health monitoring
- Damage detection & repair
- Stress & strain monitoring
Based on End-User:
- Structural health monitoring
- Damage detection & repair
- Stress & strain monitoring
- Temperature sensing
Based on the Geography:
- North America
- U.S.
- Canada
- Mexico
- Europe
- UK
- France
- Germany
- Italy
- Spain
- Russia
- Belgium
- Netherlands
- Austria
- Sweden
- Poland
- Denmark
- Switzerland
- Rest of Europe
- Asia Pacific
- China
- Japan
- South Korea
- India
- Australia
- Thailand
- Indonesia
- Vietnam
- Malaysia
- Philippines
- Taiwan
- Rest of Asia Pacific
- Latin America
- Brazil
- Argentina
- Peru
- Chile
- Colombia
- Rest of Latin America
- Middle East
- UAE
- KSA
- Israel
- Turkey
- Iran
- Rest of Middle East
- Africa
- Egypt
- Nigeria
- Algeria
- Morocco
- Rest of Africa
Regional Analysis
North America
North America holds a significant market share of the Self-Sensing Nanocomposites Market, estimated at 34%. Strong demand is supported by advanced aerospace, automotive, and defense industries that require high-performance materials with embedded sensing capabilities. The United States leads in adoption due to major investments in smart infrastructure and innovation programs that integrate nanotechnology. It benefits from collaboration between universities, research laboratories, and commercial players that accelerate development and commercialization. Canada contributes to growth with adoption in renewable energy projects, particularly in wind and hydro infrastructure, where predictive maintenance reduces long-term costs. Mexico focuses on automotive integration, leveraging nanocomposites in lightweight and safety-critical components. Regional presence of global nanomaterial manufacturers further strengthens the role of North America as a hub for innovation and early adoption.
Europe
Europe accounts for 28% of the Self-Sensing Nanocomposites Market, driven by strong policy support for sustainable infrastructure and advanced materials research. Countries such as Germany, France, and the United Kingdom lead in deploying nanocomposites for structural health monitoring in bridges, tunnels, and transportation networks. The European Union funds numerous research initiatives under Horizon programs that enhance industrial scalability of multifunctional composites. Aerospace manufacturers adopt Self-Sensing composites to meet strict safety and efficiency requirements. Automotive OEMs explore nanocomposites to align with electrification and lightweighting goals. It benefits from advanced R&D facilities and public-private collaborations that prioritize eco-friendly nanomaterials. Europe’s emphasis on circular economy principles further supports adoption across industries.
Asia-Pacific
Asia-Pacific holds a market share of 25%, reflecting rapid growth in infrastructure development, automotive production, and electronics manufacturing. China drives strong adoption due to large-scale construction projects and government-backed initiatives in smart cities and advanced materials. Japan leads in electronics and robotics applications, integrating nanocomposites into sensors and flexible devices. South Korea invests heavily in aerospace and renewable energy, creating opportunities for smart composites with built-in diagnostic functions. India expands use in infrastructure projects such as highways, bridges, and smart rail systems. It also gains momentum from local investments in nanotechnology research centers. Regional demand benefits from a combination of industrial expansion and rising awareness of material efficiency in emerging economies.
Latin America
Latin America represents 7% of the Self-Sensing Nanocomposites Market, with adoption concentrated in Brazil, Mexico, and Argentina. Infrastructure upgrades and energy projects form the core of demand. Brazil uses nanocomposites in large construction and hydropower facilities where real-time monitoring improves durability. Mexico leverages Self-Sensing composites in automotive manufacturing, particularly for export markets that require compliance with international safety standards. Argentina explores potential in renewable energy systems, including wind power and solar projects. Limited funding and slower technology transfer remain challenges, but partnerships with international players support gradual growth. It positions Latin America as an emerging participant in the global market.
Middle East & Africa
The Middle East & Africa hold a combined market share of 6%, with opportunities driven by energy and infrastructure. Gulf countries such as the United Arab Emirates and Saudi Arabia invest in nanocomposites for large-scale infrastructure, including bridges and smart city developments. South Africa shows adoption in mining and energy sectors where stress monitoring and predictive diagnostics are critical. Oil and gas industries apply Self-Sensing composites in pipelines and offshore structures to improve reliability. Regional governments encourage advanced material adoption through innovation hubs and industrial diversification plans. It shows gradual progress as investments in high-value infrastructure and industrial projects grow.
Key Player Analysis
- RTP Company (U.S.)
- Nanocyl SA (Belgium)
- DuPont (U.S.)
- Cabot Corporation (U.S.)
- Showa Denko K.K. (Japan)
- Zyvex Technologies Inc. (U.S.)
- Nanophase Technologies Corporation (U.S.)
- Arkema S.A. (France)
- Nanocor Inc. (U.S.)
- Evonik Industries AG (Germany)
Competitive Analysis
The Self-Sensing Nanocomposites Market features including Arkema S.A., Evonik Industries AG, Showa Denko K.K., Cabot Corporation, Zyvex Technologies Inc., Nanocyl SA, RTP Company, Nanophase Technologies Corporation, Nanocor Inc., and DuPont. The Self-Sensing Nanocomposites Market remains highly competitive, shaped by continuous innovation in nanomaterial technologies and application development. Companies focus on advancing carbon nanotube, graphene, and hybrid filler systems to enhance conductivity, durability, and multifunctional sensing performance. Strategic collaborations between material producers, research institutes, and end-use industries accelerate product validation in aerospace, automotive, energy, and infrastructure sectors. Firms prioritize scaling production methods to achieve cost efficiency while maintaining quality and reliability in sensing performance. Competition intensifies as new entrants target niche applications such as wearable electronics and renewable energy systems. The market favors players that invest in sustainable solutions, regulatory compliance, and tailored nanocomposites designed for industry-specific challenges.
Recent Developments
- In May 2025, Nanoco Group plc established a new two-year pact with its major Asian chemical partner to enhance and upscale their second-generation quantum dot materials for infrared sensing applications before transitioning to commercial nanomaterials distribution for sensing markets.
- In October 2024, the world's largest graphene nanotube manufacturer OCSiAl stated that they maintain a Serbian production facility which produces sixty tonnes of nanotubes annually and anticipates reaching one hundred twenty tonnes of annual capacity in 2025.
- In May 2024, DuPont Tedlar exhibited its range of solutions for easy-to-clean, durable, customizable, and safe airplane interiors at the Aircraft Interiors Expo (AIX) 2024 in Hamburg, Germany. The company collaborated with other DuPont businesses.
- In May 2024, Cabot Corporation launched the REPLASBLAK universal circular black masterbatches, produced from certified sustainable materials through EVOLVE Sustainable Solutions. The product enabled Cabot to maintain its reputation for delivering high-performance, high-quality, and reliable solutions to the plastics industry, while meeting the growing demand for large-scale certified circular products.
Report Coverage
The research report offers an in-depth analysis based on Sensing Mechanism, Application, End-User and Geography. It details leading market players, providing an overview of their business, product offerings, investments, revenue streams, and key applications. Additionally, the report includes insights into the competitive environment, SWOT analysis, current market trends, as well as the primary drivers and constraints. Furthermore, it discusses various factors that have driven market expansion in recent years. The report also explores market dynamics, regulatory scenarios, and technological advancements that are shaping the industry. It assesses the impact of external factors and global economic changes on market growth. Lastly, it provides strategic recommendations for new entrants and established companies to navigate the complexities of the market.
Future Outlook
- Demand will rise for materials that combine structural strength with embedded sensing capabilities.
- Adoption will expand in aerospace and automotive industries seeking lightweight multifunctional solutions.
- Infrastructure projects will integrate Self-Sensing composites for real-time monitoring of bridges and tunnels.
- Energy systems will deploy nanocomposites in wind, solar, and storage units for predictive maintenance.
- Electronics and wearables will adopt flexible sensing composites for durability and performance monitoring.
- Research will advance hybrid nanomaterials that deliver electrical, thermal, and mechanical sensing functions.
- Manufacturers will focus on scalable production methods to lower costs and improve consistency.
- Sustainability will influence material design through bio-based fillers and recyclable polymer matrices.
- Global collaborations will increase between universities, industries, and governments to accelerate commercialization.
- Market growth will favor companies that align innovation with regulatory standards and lifecycle efficiency.
Request a Free Sample
Fill in your details and we'll send you a free sample report.
- Sample data tables & charts
- Research methodology
Need a Custom Version of This Report?
Tailor the scope, geography, or segments to your exact requirements.
- Custom geography or segment scope
- Direct access to our analyst team
Frequently Asked Questions
What is the current market size for the Self-Sensing Nanocomposites Market, and what is its projected size in 2032?
At what Compound Annual Growth Rate is the Self-Sensing Nanocomposites Market projected to grow between 2025 and 2032
What are the primary factors fueling the growth of the Self-Sensing Nanocomposites Market?
Who are the leading companies in the Self-Sensing Nanocomposites Market?
Table of Content
Chapter 1. Report Introduction
- 1.1 Report Description & Purpose
- 1.1.1 Report Title & Market Definition
- 1.1.2 Unique Selling Propositions (USP) & Key Differentiators
- 1.1.3 Value Proposition for Stakeholders
- 1.2 Research Objectives
- 1.2.1 Market Sizing Objectives (Volume & Revenue)
- 1.2.2 Segmentation Objectives
- 1.2.3 Competitive Intelligence Objectives
- 1.2.4 Forecast & Scenario Objectives
- 1.3 Report Scope
- 1.3.1 Self-Sensing Nanocomposites Scope – Types & Subtypes Covered
- 1.3.2 Geographic Scope – Regions & Countries Covered
- 1.3.3 Historical Period, Base Year & Forecast Period (2024; forecast to 2032)
- 1.3.4 Inclusions & Exclusions
- 1.4 HS Code & Classification Framework
- 1.5 Currency, Units & Pricing Basis
- 1.6 Target Stakeholders
- 1.7 Limitations & Assumptions
Chapter 2. Executive Summary
- 2.1 Global Self-Sensing Nanocomposites Market Snapshot
- 2.1.1 Market Size – Historical (2024) & Forecast (2024-2032) (2024: USD 490 million → 2032: USD 1457.7 million)
- 2.1.2 Volume & Revenue – Global Totals
- 2.1.3 Key Market Highlights – Top Five Facts
- 2.2 Self-Sensing Nanocomposites Market Segmentation Snapshot
- 2.2.1 Market Split by Region – 2024 vs. 2032
- 2.3 Competitive Snapshot
- 2.3.1 Top 10 Players by Revenue Share – 2024
- 2.3.2 Top 10 Players by Volume Share – 2024
- 2.3.3 Recent Strategic Developments (18-Month Summary)
- 2.4 Key Investment Highlights & Strategic Conclusions
Chapter 3. Self-Sensing Nanocomposites Market Dynamics & Industry Analysis
- 3.1 Market Overview & Context
- 3.1.1 Self-Sensing Nanocomposites Market Position in the Broader Automotive Value Chain
- 3.1.2 OEM vs. Replacement Market Dynamics
- 3.1.3 Market Maturity & Development Stage by Region
- 3.2 Self-Sensing Nanocomposites Market Drivers
- 3.3 Self-Sensing Nanocomposites Market Restraints & Challenges
- 3.4 Self-Sensing Nanocomposites Market Opportunities
- 3.5 Porter's Five Forces Analysis
- 3.5.1 Threat of New Entrants
- 3.5.2 Bargaining Power of Suppliers
- 3.5.3 Bargaining Power of Buyers
- 3.5.4 Threat of Substitutes
- 3.5.5 Competitive Rivalry – Intensity Assessment
- 3.6 Self-Sensing Nanocomposites Value Chain Analysis
- 3.6.1 Upstream – Raw Material/Input Suppliers
- 3.6.1.1 Raw Material/Input 1
- 3.6.1.2 Raw Material/Input 2
- 3.6.1.3 Raw Material/Input 3
- 3.6.2 Midstream – Production/Manufacturing/Service Delivery
- 3.6.2.1 Production/Process Overview
- 3.6.2.2 Key Facility Locations & Capacity by Manufacturer
- 3.6.3 Downstream – Distribution & End Consumer
- 3.6.3.1 Primary Channel – B2B/OEM
- 3.6.3.2 Secondary Channels – Dealer, Retail, Online, Direct
- 3.6.4 Value Chain Profitability Analysis
- 3.6.1 Upstream – Raw Material/Input Suppliers
- 3.7 PESTEL Analysis
- 3.7.1 Political Factors
- 3.7.2 Economic Factors
- 3.7.3 Social Factors
- 3.7.4 Technological Factors
- 3.7.5 Environmental Factors
- 3.7.6 Legal Factors
- 3.8 Self-Sensing Nanocomposites Supply Chain Analysis
- 3.8.1 Raw Material/Input Supply Risk Assessment
- 3.8.2 Manufacturing Concentration Risk (Geographic Exposure)
- 3.8.3 Trade Disruption Impact Analysis
- 3.9 Regulatory & Policy Landscape
Note: The regulatory and policy landscape section covers regulations based on their applicability to the market, Self-Sensing Nanocomposites category, geography, and scope of the study. Only regulatory frameworks with a material impact on operations, compliance, trade, sustainability, or market access are analyzed in detail.
Chapter 4. Key Investment Pockets & Opportunity Analysis
- 4.1 Self-Sensing Nanocomposites Market Attractiveness Analysis
- 4.1.1 By Region – Investment Attractiveness Matrix (Volume × CAGR)
- 4.2 Absolute Revenue Growth Opportunity
- 4.2.1 By Region – Absolute USD Growth Through 2032
- 4.3 Incremental Volume Opportunity
- 4.3.1 By Region – Incremental Volume Through 2032
- 4.3.2 Segment – Incremental Volume
- 4.4 Emerging Submarket Opportunity Deep Dive (Subject to Applicability)
- 4.5 Emerging Market Opportunity Scorecards
- 4.5.1 United States
- 4.5.2 Europe
- 4.5.3 Asia
- 4.5.4 Middle East & Africa
Note: Emerging Market Opportunity Scorecards will be included based on relevance and strategic importance. Regions listed are indicative and may vary depending on data availability and market dynamics.
Chapter 5. Self-Sensing Nanocomposites Import-Export Analysis & Trade Flows
- 5.1 Global Trade Overview
- 5.1.1 Global Export Value by Country (2024)
- 5.1.2 Global Export Volume by Country (2024)
- 5.1.3 Global Import Value by Country (2024)
- 5.1.4 Global Import Volume by Country (2024)
- 5.1.5 Net Trade Balance by Country (2024)
- 5.2 Export Analysis – Segment
- 5.2.1 Type 1 (HS Code)
- 5.2.2 Type 2 (HS Code)
- 5.2.3 Type 3 (HS Code)
- 5.2.4 Type 4 (HS Code)
- 5.2.5 Type 5 (HS Code)
- 5.3 Import Analysis – Segment
- 5.3.1 Type 1 (HS Code)
- 5.3.2 Type 2 (HS Code)
- 5.3.3 Type 3 (HS Code)
- 5.3.4 Type 4 (HS Code)
- 5.3.5 Type 5 (HS Code)
- 5.4 Average Unit Trade Prices
- 5.4.1 Average Export Price – Segment & Country
- 5.4.2 Average Import Price – Segment & Source Country
- 5.4.3 Price Trends (2024)
- 5.5 Key Trade Route Analysis
- 5.5.1 Trade Route 1
- 5.5.2 Trade Route 2
- 5.5.3 Trade Route 3
- 5.5.4 Trade Route 4
- 5.5.5 Trade Route 5
- 5.6 Trade Policy Impact Assessment
- 5.6.1 US Anti-Dumping & Section 301 Tariffs
- 5.6.2 EU Customs Union Impact
- 5.6.3 Major Free Trade Agreements
- 5.6.4 USMCA Rules of Origin
Note: Trade policy analysis will be included only where relevant to the Self-Sensing Nanocomposites market.
Chapter 6. Competitive Landscape & Company Benchmarking
- 6.1 Self-Sensing Nanocomposites Market Concentration & Structure
- 6.1.1 Herfindahl-Hirschman Index (HHI) – vs. 2024
- 6.1.2 Tier 1, Tier 2 & Tier 3 Market Structure
- 6.1.3 Global, Regional & Local Player Dynamics
- 6.2 Self-Sensing Nanocomposites Market Share Analysis – 2024
- 6.2.1 Global Revenue Share by Company
- 6.2.2 Global Volume Share by Company
- 6.2.3 Regional Revenue Share
- 6.2.4 Market Share Evolution ( vs. 2024)
- 6.2.5 OEM Segment Share by Company
- 6.2.6 Replacement Segment Share by Company
- 6.3 Production/Delivery Capacity & Facility Analysis
- 6.3.1 Global Installed Capacity
- 6.3.2 Capacity Utilization Rates
- 6.3.3 Production/Output Volume
- 6.3.4 Facility Locations & Capacity Map
- 6.3.5 Planned Capacity Additions
- 6.4 Self-Sensing Nanocomposites Competitive Benchmarking Matrix
- 6.4.1 Revenue, Volume, CAGR & Profitability Comparison
- 6.4.2 Channel Revenue Mix
- 6.4.3 Geographic Revenue Exposure
- 6.4.4 R&D Intensity
- 6.4.5 Sustainability Maturity
- 6.5 Strategic Developments in Self-Sensing Nanocomposites (Last 24 Months)
- 6.5.1 Mergers, Acquisitions & Divestments
- 6.5.2 New Self-Sensing Nanocomposites Launches
- 6.5.3 Facility Expansions
- 6.5.4 Strategic Alliances, Joint Ventures & Partnerships
- 6.5.5 Distribution Expansion & Market Entry
- 6.5.6 Sustainability & ESG Initiatives
- 6.6 Competitive Strategy Mapping
- 6.6.1 Leader, Challenger, Follower & Niche Classification
- 6.6.2 Pricing Strategy Comparison
- 6.6.3 Channel Strategy Matrix
Note: Strategic developments are included based on their materiality and the availability of reliable information.
Chapter 7. Global Self-Sensing Nanocomposites Market – By Distribution Channel
- 7.1 Segment Overview
- 7.1.1 Volume & Revenue Split by Channel (2024 & 2032)
- 7.1.2 Channel Mix Evolution (2024-2032)
Chapter 8. Regional Market Analysis – Global Overview
- 8.1 Global Regional Overview
- 8.1.1 Regional Volume Share
- 8.1.2 Regional Revenue Share
- 8.1.3 Regional Volume by Region
- 8.1.4 Regional Revenue by Region
- 8.1.5 Regional Forecast Through 2032
- 8.2 Cross-Regional Segment Analysis
- 8.2.1 By Distribution Channel
- 8.2.2 By Brand/Price Tier
Chapter 9. North America Self-Sensing Nanocomposites Market
- 9.1 United States
- 9.2 Canada
- 9.3 Mexico
Chapter 10. Europe Self-Sensing Nanocomposites Market
- 10.1 Germany
- 10.2 France
- 10.3 Italy
- 10.4 United Kingdom
- 10.5 Spain
- 10.6 Poland
- 10.7 Russia
- 10.8 Netherlands
- 10.9 Belgium
- 10.10 Sweden
- 10.11 Denmark
- 10.12 Norway
- 10.13 Rest of Europe
Chapter 11. Asia Pacific Self-Sensing Nanocomposites Market
- 11.1 China
- 11.2 India
- 11.3 Japan
- 11.4 South Korea
- 11.5 Thailand
- 11.6 Indonesia
- 11.7 Vietnam
- 11.8 Malaysia
- 11.9 Australia
- 11.10 Rest of Asia Pacific
Chapter 12. Latin America Self-Sensing Nanocomposites Market
- 12.1 Brazil
- 12.2 Argentina
- 12.3 Colombia
- 12.4 Chile
- 12.5 Rest of Latin America
Chapter 13. Middle East Self-Sensing Nanocomposites Market
- 13.1 Saudi Arabia
- 13.2 United Arab Emirates
- 13.3 Turkey
- 13.4 Israel
- 13.5 Iran
- 13.6 Rest of the Middle East
Chapter 14. Africa Self-Sensing Nanocomposites Market
- 14.1 South Africa
- 14.2 Egypt
- 14.3 Nigeria
- 14.4 Morocco
- 14.5 Rest of Africa
Chapter 15. Self-Sensing Nanocomposites Company Profiles
- 15.1 [Company 01]
- 15.1.1 Company Overview
- 15.1.2 Key Management Personnel
- 15.1.3 Products & Services Portfolio
- 15.1.4 Financial Performance
- 15.1.5 Key Market Focus & Geographic Presence
- 15.1.6 Recent Developments & Strategic Initiatives
Note: The company profile list is preliminary and may change based on research findings, market developments, data availability, and client requirements.
Chapter 16. Appendices
- Appendix A – List of Abbreviations & Acronyms
- Appendix B – Industry Classification Code Reference – Full Series
- Appendix C – Production & Capacity Data Tables
- Appendix D – End-Use & Demand Base Tables
- Appendix E – Consumption & Replacement Rate Assumptions
- Appendix F – ASP Reference Tables
- Appendix G – Manufacturing & Facility Database
- Appendix H – Import-Export Data Tables
- Appendix I – Regulatory Summary Tables
- Appendix J – Primary Research Participant List (Anonymized)
- Appendix K – Primary Research Questionnaire Framework
- Appendix L – Data Sources & Bibliography
- Appendix M – Market Size Divergence & Source Comparison
Chapter 17. Research Methodology
- 17.1 Research Framework & Philosophy
- 17.2 Secondary Research – Sources, Hierarchy & Data Extraction
- 17.3 Data Modeling – Bottom-Up & Top-Down Market Sizing
- 17.4 Primary Research – Stakeholder Framework, LOI & Sample Sizes
- 17.5 Forecast Methodology – Regression, Scenario & Sensitivity Analysis
- 17.6 Quality Control – Four-Layer Validation Framework
- 17.7 Limitations & Standard Assumptions
- 17.8 Disclaimer
