Home » Energy » Oil & Gas » Service Operation Vessels (SOV) Sales Market

Service Operation Vessels (SOV) Sales Market By Type (Hybrid SOVs, Non-Hybrid SOVs); By Technology (Automation Systems, Fuel-Efficient Engines, Safety Technologies, Remote Monitoring & Predictive Maintenance); By Operation Type (Installation Vessels, Maintenance Vessels); By Size and Capacity (Small-sized Vessels, Medium-sized Vessels, Large-sized Vessels); By End-User (Offshore Wind Operators, Offshore Oil & Gas Operators, Renewable Energy Companies, Government & Public Sector) – Growth, Share, Opportunities & Competitive Analysis, 2024 – 2032

Report ID: 101586 | Report Format : Excel, PDF

Market Overview:

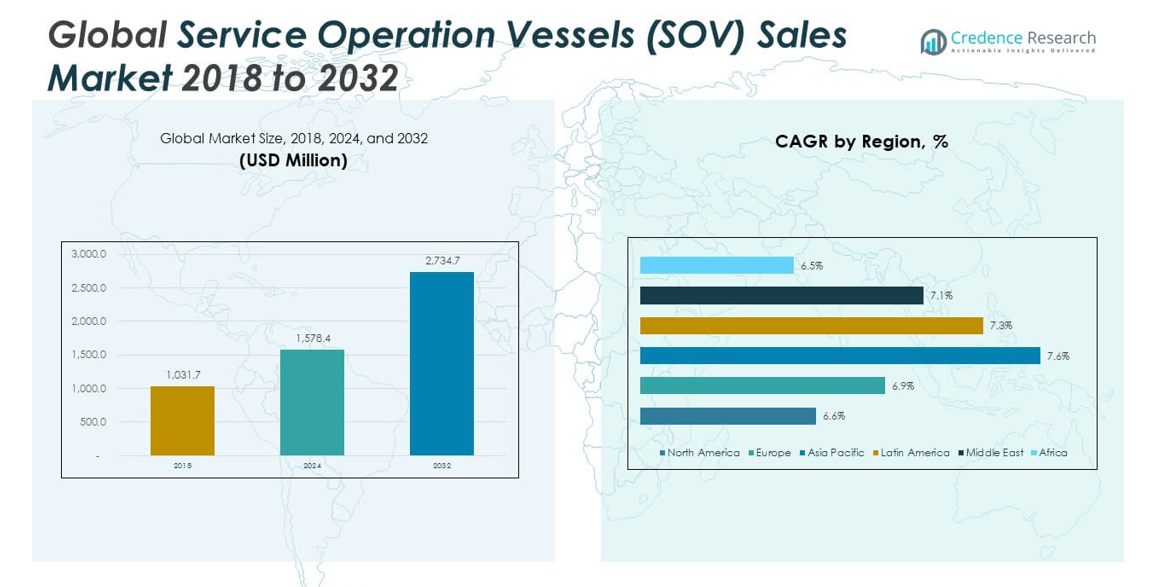
The Service Operation Vessels (SOV) Sales Market size was valued at USD 1,031.7 million in 2018 to USD 1,578.4 million in 2024 and is anticipated to reach USD 2,734.7 million by 2032, at a CAGR of 7.12% during the forecast period.

REPORT ATTRIBUTE DETAILS
Historical Period 2020-2023
Base Year 2024
Forecast Period 2025-2032
Service Operation Vessels (SOV) Sales Market Size 2024 USD 1,578.4 million
Service Operation Vessels (SOV) Sales Market, CAGR 7.12%
Service Operation Vessels (SOV) Sales Market Size 2032 USD 2,734.7 million


The market is driven by the rapid expansion of offshore wind energy projects, rising demand for efficient maintenance and operational support in offshore facilities, and increasing investments in renewable energy infrastructure. Technological advancements in vessel design, such as improved fuel efficiency, dynamic positioning systems, and enhanced safety features, are boosting adoption. Additionally, growing emphasis on reducing operational downtime and enhancing crew comfort is encouraging operators to invest in advanced SOVs tailored for specific offshore needs.

Europe dominates the Service Operation Vessels Sales Market due to its extensive offshore wind farms and strong government support for renewable energy projects. The Asia-Pacific region is emerging as a high-growth market, driven by large-scale offshore developments in China, Japan, and Taiwan. North America is witnessing steady expansion, supported by the development of offshore wind farms along the U.S. East Coast. The Middle East is also showing potential as offshore oil and gas activities integrate advanced vessel technologies to improve operational efficiency.

Service Operation Vessels (SOV) Sales Market size

Market Insights:

  • The Service Operation Vessels (SOV) Sales Market was valued at USD 1,578.4 million in 2024 and is projected to reach USD 2,734.7 million by 2032, growing at a CAGR of 7.12%.
  • Expansion of offshore wind farms worldwide is creating sustained demand for advanced SOVs for installation and maintenance operations.
  • Rising adoption of hybrid and fuel-efficient vessels is driven by stricter emission standards and operational efficiency goals.
  • High capital investment and long payback periods remain key barriers for new market entrants and fleet expansion.
  • North America, Europe, and Asia Pacific are major revenue contributors, with Asia Pacific holding the largest market share in 2024.
  • Harsh-environment vessel designs are in greater demand to support operations in deepwater and challenging offshore conditions.
  • Long-term service contracts linked to renewable energy projects are strengthening revenue stability for operators.

Access crucial information at unmatched prices!

Request your sample report today & start making informed decisions powered by Credence Research Inc.!

Download Sample

Market Drivers:

Growing Global Offshore Wind Energy Development Driving Demand for Advanced Service Operation Vessels

The growth of global offshore wind projects is a major driver for the Service Operation Vessels (SOV) Sales Market. Countries are expanding renewable energy capacities to meet decarbonization targets, creating continuous demand for specialized vessels to service offshore installations. It benefits from long-term maintenance needs of wind farms that require safe and reliable crew transfers. Vessel operators are investing in purpose-built SOVs to support these projects in deeper waters and harsher environments. Governments are offering financial incentives to accelerate offshore wind deployment, indirectly boosting vessel demand. New offshore construction schedules are increasing operational requirements, leading to higher fleet utilization rates. It creates a favorable environment for shipbuilders focusing on SOV production. Offshore wind farms under construction will maintain demand momentum well beyond the installation phase.

  • For instance, Ørsted and Edison Chouest Offshore introduced the ECO EDISON in May 2024, the first American-built, owned, and crewed offshore wind SOV, which features a motion-compensated “walk to work” gangway and a deployable daughter craft for efficient and safe personnel transfers.

Rising Investments in Fleet Modernization and Technological Advancement Enhancing Operational Capabilities

Fleet modernization is a priority for operators aiming to meet efficiency and environmental standards in the Service Operation Vessels (SOV) Sales Market. Shipbuilders are integrating hybrid propulsion, dynamic positioning, and automated navigation systems to optimize vessel performance. Operators are replacing older vessels with energy-efficient models to reduce fuel consumption and comply with maritime emission regulations. The shift towards digital vessel management is improving safety, predictive maintenance, and operational transparency. It strengthens the competitive position of technologically advanced fleets in securing service contracts. Growing competition for offshore maintenance contracts is motivating owners to invest in superior onboard amenities for crew comfort. SOVs equipped with motion-compensated gangways and advanced storage facilities enhance productivity. This modernization trend is expected to continue as more nations commit to offshore energy expansion.

Expansion of Offshore Oil and Gas Support Operations Creating Parallel Demand Growth

While renewable energy is the primary growth driver, the offshore oil and gas sector also supports the Service Operation Vessels (SOV) Sales Market. SOVs are being deployed for inspection, repair, and maintenance of offshore oil platforms, extending their operational life. Demand for vessels that can handle complex offshore logistics is rising in regions with mature oil and gas infrastructure. Governments and private investors are approving offshore field redevelopment projects, which require continuous operational support. It provides steady utilization rates for SOVs beyond the wind energy domain. Specialized vessels with multi-purpose capabilities are gaining preference in markets with both oil and wind assets. This diversification reduces dependency on a single energy sector, creating stable revenue streams for operators. Expansion of deep-water oil activities further stimulates vessel orders and retrofitting projects.

  • For instance, Fincantieri, through its U.S. subsidiary Fincantieri Marine Group, signed an agreement in January 2023 to build an 88-meter SOV for Crowley and ESVAGT, supporting both U.S. wind farms and offering adaptable design for oil and gas support operations.

Increasing Emphasis on Safety, Efficiency, and Crew Wellbeing in Offshore Operations

Safety standards in offshore environments are becoming more stringent, influencing vessel design and operation in the Service Operation Vessels (SOV) Sales Market. Regulatory bodies are mandating advanced safety systems, fire suppression technology, and emergency evacuation capabilities. Shipbuilders are designing vessels with enhanced stability to ensure safe personnel transfers in adverse weather. Crew wellbeing is emerging as a commercial advantage, with operators offering improved living quarters, recreational facilities, and medical support. It improves crew retention, which is critical in long-duration offshore projects. High-performance gangways, motion-compensation systems, and automated deck handling equipment reduce workplace hazards. Clients increasingly select operators that demonstrate strong safety and comfort records. This focus aligns with the broader trend of sustainable and responsible offshore service delivery.

Market Trends

Growing Adoption of Hybrid and Electric Propulsion Systems in New Vessel Designs

The push towards decarbonization is leading to significant investment in hybrid and electric propulsion within the Service Operation Vessels (SOV) Sales Market. Shipbuilders are developing dual-fuel and battery-assisted propulsion systems to reduce carbon emissions. It allows operators to meet IMO and regional environmental standards without sacrificing operational capacity. Energy storage systems are becoming a common specification for new builds, offering fuel savings and quieter operations. The adoption of renewable-powered charging stations at ports is further supporting this transition. Vessels with flexible propulsion systems can serve in emission-restricted zones without operational disruption. Technological advances in battery capacity are enabling longer zero-emission operating periods. This trend is expected to reshape the competitive landscape as eco-compliance becomes a key selection criterion for charter contracts.

  • For instance, ABB supplied its hybrid power, propulsion, and shore charging system for Casco Bay Lines’ new 50m ferry in March 2021, enabling operations in both battery-powered and diesel-electric modes.

Integration of Digital Twin Technology for Predictive Maintenance and Operational Optimization

Digital twin technology is gaining traction in the Service Operation Vessels (SOV) Sales Market as operators seek to maximize uptime and reduce maintenance costs. By creating virtual replicas of vessels, operators can simulate operational conditions and identify potential issues before they cause downtime. It enables data-driven maintenance schedules that extend component life and reduce emergency repairs. Real-time monitoring systems feed data into predictive algorithms, optimizing fuel efficiency and operational safety. This approach supports compliance with technical performance guarantees often required in offshore contracts. Remote diagnostics allow onshore teams to assist in resolving technical problems without dispatching additional personnel. Integration of AI-based analysis tools is improving decision-making for route planning and load management. Adoption of this technology is expected to expand as more fleets digitize operations.

Shift Towards Larger, Multi-Purpose Vessel Designs for Greater Operational Flexibility

Demand is rising for larger, multi-role vessels capable of supporting multiple offshore tasks within the Service Operation Vessels (SOV) Sales Market. Operators prefer designs that combine crew transfer, cargo transport, and maintenance capabilities in a single platform. It reduces the need for multiple vessel deployments, improving cost efficiency for clients. Larger SOVs can accommodate more personnel and equipment, extending offshore operational cycles. Design innovations are focusing on stability, speed, and fuel efficiency despite increased size. Shipyards are adapting to produce modular vessel configurations to meet diverse client requirements. The ability to serve both wind farms and oil platforms enhances market reach. This shift is expected to drive future vessel orders in competitive tender processes.

  • For instance, Wärtsilä’s new 76-meter multi-purpose SOV accommodates up to 60 crew and wind farm technicians, with advanced modular designs for simultaneous crew transfer, equipment transport, and maintenance work.

Increasing Deployment in Harsh and Deepwater Offshore Environments

Growing offshore activity in remote and deepwater regions is influencing vessel specifications in the Service Operation Vessels (SOV) Sales Market. Operators require vessels capable of withstanding extreme weather, high waves, and extended operational ranges. It has led to advancements in hull design, stabilization systems, and endurance capacity. Demand is increasing for vessels equipped with ice-class certification for operations in polar and sub-polar regions. Extended range capabilities reduce dependency on port calls, improving service efficiency in isolated areas. Enhanced communication systems ensure uninterrupted coordination with onshore bases. SOVs designed for these environments attract premium charter rates due to their specialized capabilities. This trend is expected to expand as offshore energy exploration and renewable installations move into more challenging waters.

Market Challenges Analysis

High Capital Costs and Long Payback Periods Limiting New Entrants and Fleet Expansion

The Service Operation Vessels (SOV) Sales Market faces challenges due to the high capital costs involved in vessel construction and retrofitting. Building advanced SOVs with hybrid propulsion, motion-compensated gangways, and specialized safety systems requires substantial investment. It often results in long payback periods, discouraging smaller operators from entering the market. Financing such projects demands strong credit backing and long-term charter agreements. Volatile energy sector demand can create uncertainty, impacting the financial feasibility of large-scale orders. Rising raw material and shipyard labor costs are adding to the financial burden. Operators without diversified service portfolios face greater risks when market demand shifts. This barrier limits competition and slows the rate of global fleet modernization.

Operational and Regulatory Compliance Complexities Affecting Global Deployment

Strict environmental and safety regulations pose operational challenges for the Service Operation Vessels (SOV) Sales Market. Compliance with varying regional maritime laws requires continuous investment in vessel upgrades and crew training. It can delay deployment schedules and increase operating costs for international operations. Differences in technical certification standards between jurisdictions complicate fleet mobility. Harsh offshore conditions increase maintenance frequency, impacting profitability. Limited availability of skilled crew further adds to operational constraints. Navigating port access requirements in environmentally sensitive areas requires meticulous planning. These complexities influence operator strategy, often leading to selective engagement in specific regional markets.

Service Operation Vessels (SOV) Sales Market share

Market Opportunities

Expansion of Offshore Wind Projects in Emerging Economies Creating New Vessel Demand

Emerging markets are accelerating offshore wind investments, presenting growth opportunities for the Service Operation Vessels (SOV) Sales Market. Nations with strong coastal wind potential are commissioning large-scale farms requiring ongoing operational support. It enables vessel operators to enter new regions with long-term service contracts. Partnerships with local shipbuilders and port authorities can streamline market entry. Demand for customized vessels tailored to local environmental conditions is increasing. Government-backed renewable energy programs are improving investment confidence. These developments are expected to expand the global footprint of leading SOV operators.

Technological Advancements Opening New Revenue Streams for Vessel Operators

Innovations in automation, digital monitoring, and green propulsion offer operators the chance to differentiate services in the Service Operation Vessels (SOV) Sales Market. It allows vessels to deliver higher efficiency, lower emissions, and improved safety performance. Integration of advanced communication systems enables real-time data exchange with onshore teams. Offering enhanced operational analytics can strengthen client relationships. Multi-role vessel designs increase charter flexibility, attracting a wider range of offshore contracts. Hybrid propulsion and battery systems position fleets for compliance in evolving emission control zones. These advancements create competitive advantages that can translate into premium service pricing.

Market Segmentation Analysis:

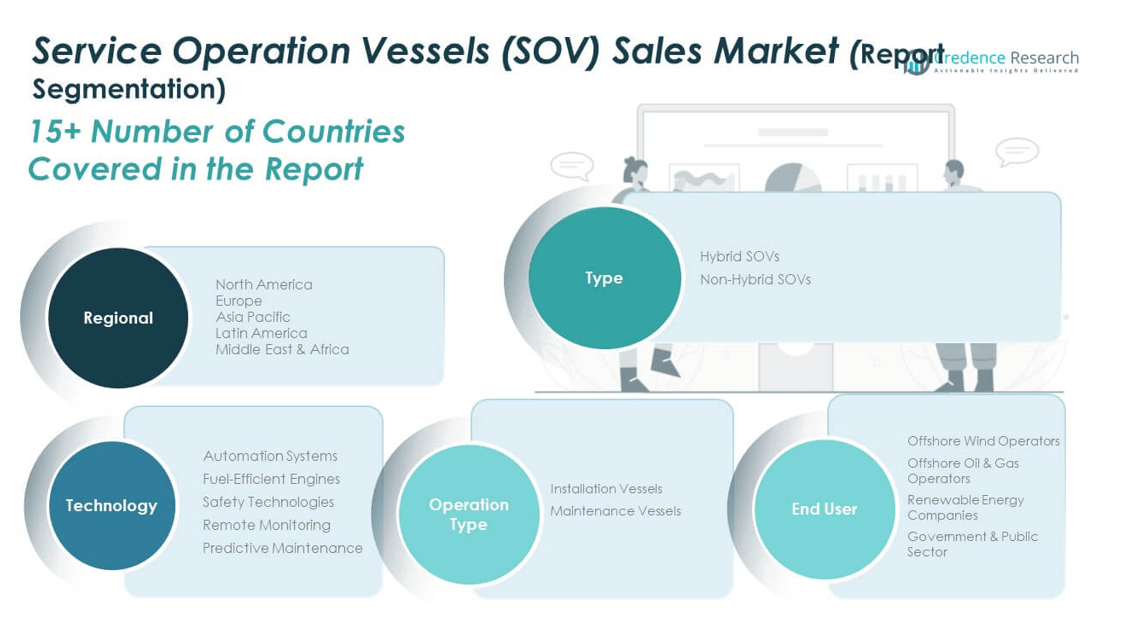
The Service Operation Vessels (SOV) Sales Market is segmented

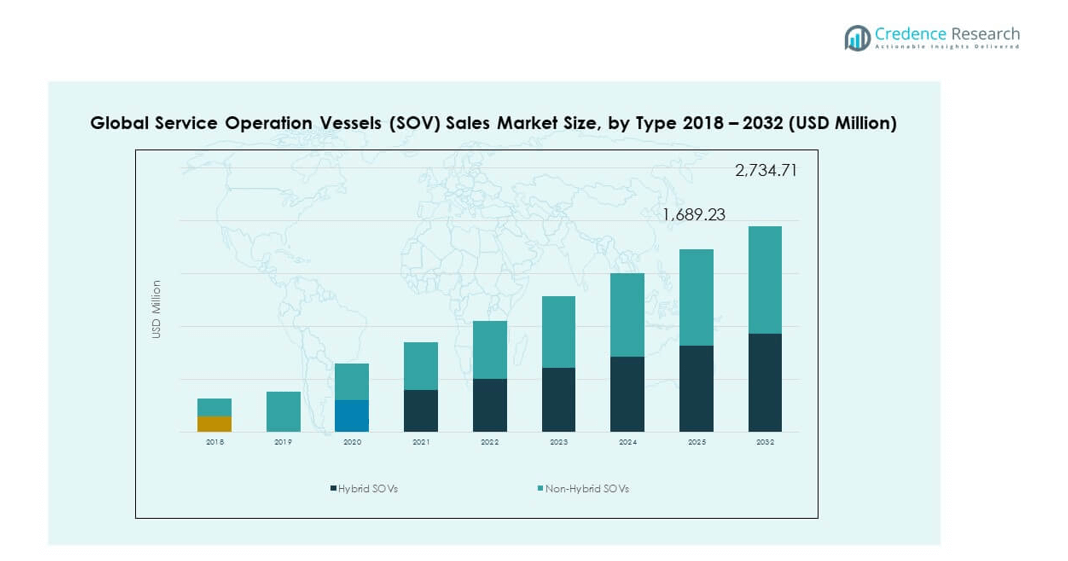
By type into hybrid SOVs and non-hybrid SOVs. Hybrid vessels are gaining traction due to their fuel efficiency, reduced emissions, and compliance with evolving maritime regulations, making them a preferred choice for operators in regions with stringent environmental norms. Non-hybrid SOVs continue to serve markets where initial investment cost is a decisive factor, offering proven operational reliability for short to medium offshore missions. The shift towards hybrid adoption is accelerating with the growth of offshore wind projects requiring sustainable long-term support solutions.

By technology, the market includes automation systems, fuel-efficient engines, safety technologies, remote monitoring, and predictive maintenance. Automation systems and fuel-efficient engines are advancing vessel performance and lowering operational costs. Safety technologies remain critical for crew welfare and compliance in high-risk offshore environments. Remote monitoring and predictive maintenance solutions are enhancing fleet uptime and reducing unplanned downtime through real-time data analytics and proactive servicing.

  • For instance, Wärtsilä’s Lifecycle Agreement for offshore wind installation vessels includes continuous remote condition monitoring and AI-based predictive maintenance (Expert Insight), supporting 7.5-year drydocking intervals and enhanced operational reliability for project-critical SOVs.

By operation type, installation vessels dominate in project commissioning phases, handling equipment transport and setup for offshore wind and oil platforms. Maintenance vessels secure recurring demand, supporting inspection, repair, and operational continuity.

  • For example, Cadeler’s specialist installation vessel Wind Orca was chartered to install 77 monopile foundations and Siemens 3.6MW turbines in the German North Sea. The vessel achieved installation cycles of 23 hours per location, including setup and transit, efficiently contributing 277.2MW of wind capacity.

By end user industry, offshore wind operators represent the fastest-growing segment, driven by renewable energy expansion, while offshore oil and gas operators sustain steady demand for asset life extension. Renewable energy companies and the government and public sector are increasingly deploying SOVs to meet strategic energy and infrastructure goals, reinforcing the market’s role in supporting the global transition to sustainable offshore operations.

Service Operation Vessels (SOV) Sales Market segmentation

Segmentation:

By Type

  • Hybrid SOVs
  • Non-Hybrid SOVs

By Technology

  • Automation Systems
  • Fuel-Efficient Engines
  • Safety Technologies
  • Remote Monitoring
  • Predictive Maintenance

By Operation Type

  • Installation Vessels
  • Maintenance Vessels

By End User Industry

  • Offshore Wind Operators
  • Offshore Oil & Gas Operators
  • Renewable Energy Companies
  • Government & Public Sector

By Region

  • North America
    • U.S.
    • Canada
    • Mexico
  • Europe
    • UK
    • France
    • Germany
    • Italy
    • Spain
    • Russia
    • Belgium
    • Netherlands
    • Austria
    • Sweden
    • Poland
    • Denmark
    • Switzerland
    • Rest of Europe
  • Asia Pacific
    • China
    • Japan
    • South Korea
    • India
    • Australia
    • Thailand
    • Indonesia
    • Vietnam
    • Malaysia
    • Philippines
    • Taiwan
    • Rest of Asia Pacific
  • Latin America
    • Brazil
    • Argentina
    • Peru
    • Chile
    • Colombia
    • Rest of Latin America
  • Middle East
    • UAE
    • KSA
    • Israel
    • Turkey
    • Iran
    • Rest of Middle East
  • Africa
    • Egypt
    • Nigeria
    • Algeria
    • Morocco
    • Rest of Africa

Regional Analysis:

North America

The North America Service Operation Vessels (SOV) Sales Market size was valued at USD 244.20 million in 2018 to USD 362.98 million in 2024 and is anticipated to reach USD 604.37 million by 2032, at a CAGR of 6.6% during the forecast period. North America holds 22.99% of the global market share in 2024, supported by the expansion of offshore wind farms along the U.S. East Coast and increased offshore oil platform maintenance. The region benefits from strong government incentives for renewable energy and robust maritime infrastructure. It has seen a steady increase in hybrid SOV adoption to meet emission control regulations. Offshore wind projects in states like New York and Massachusetts are driving vessel demand for both installation and maintenance. Canada is investing in offshore operations for renewable energy and oil platforms, contributing to regional fleet growth. The Gulf of Mexico continues to provide consistent demand from the oil and gas sector. Technological innovation, including remote monitoring and predictive maintenance, is strengthening operational efficiency. North American operators are prioritizing advanced safety and crew comfort features to secure long-term service contracts.

Europe

The Europe Service Operation Vessels (SOV) Sales Market size was valued at USD 285.46 million in 2018 to USD 431.46 million in 2024 and is anticipated to reach USD 735.36 million by 2032, at a CAGR of 6.9% during the forecast period. Europe commands 27.33% of the global market share in 2024, driven by its leadership in offshore wind energy capacity. The North Sea and Baltic Sea are major hubs for offshore development, with large-scale wind farm installations requiring extensive operational support. It benefits from well-established maritime supply chains and leading vessel manufacturers. Hybrid and fuel-efficient designs are in high demand to comply with strict EU environmental regulations. The UK, Germany, and the Netherlands dominate regional deployment, with Denmark and France expanding their offshore capabilities. European operators are integrating automation and safety innovations to improve efficiency in harsh sea conditions. The oil and gas sector in Norway also contributes to vessel utilization. Ongoing government-backed renewable energy projects ensure steady fleet demand across the region.

Asia Pacific

The Asia Pacific Service Operation Vessels (SOV) Sales Market size was valued at USD 368.00 million in 2018 to USD 578.76 million in 2024 and is anticipated to reach USD 1,039.19 million by 2032, at a CAGR of 7.6% during the forecast period. Asia Pacific accounts for 36.66% of the global market share in 2024, making it the largest regional market. China, Japan, and Taiwan are leading offshore wind capacity additions, requiring large fleets for installation and maintenance. It benefits from government-backed renewable energy targets and growing shipbuilding capabilities. Demand for technologically advanced, fuel-efficient vessels is rising, with several nations developing hybrid fleets. South Korea and India are emerging as growth markets, driven by energy diversification strategies. Offshore oil and gas activities in Southeast Asia also provide vessel deployment opportunities. Regional shipyards are producing competitively priced vessels, attracting international contracts. The increasing focus on safety technologies and crew welfare is strengthening operational standards.

Latin America

The Latin America Service Operation Vessels (SOV) Sales Market size was valued at USD 76.86 million in 2018 to USD 119.08 million in 2024 and is anticipated to reach USD 209.75 million by 2032, at a CAGR of 7.3% during the forecast period. Latin America holds 7.54% of the global market share in 2024, with Brazil leading due to offshore oil production and emerging renewable energy projects. It benefits from long-term service contracts for oil platforms in deep-water fields. Offshore wind development in coastal regions is gradually increasing vessel demand. Mexico and Argentina are exploring renewable offshore initiatives, adding to potential market expansion. Local shipbuilding capacity is limited, leading to reliance on imports from established manufacturing hubs. Hybrid SOV adoption is expected to grow as environmental standards tighten. Safety and operational reliability are critical for securing service tenders in the region. Partnerships with global operators are enhancing technology transfer and operational expertise.

Middle East

The Middle East Service Operation Vessels (SOV) Sales Market size was valued at USD 33.32 million in 2018 to USD 50.85 million in 2024 and is anticipated to reach USD 87.78 million by 2032, at a CAGR of 7.1% during the forecast period. The region accounts for 3.22% of the global market share in 2024, supported by offshore oil and gas activities in the Arabian Gulf. It benefits from large-scale offshore infrastructure maintenance and the gradual introduction of renewable projects in GCC nations. Vessel demand is primarily driven by oil platform inspection, repair, and logistical support. The UAE and Saudi Arabia are investing in hybrid and fuel-efficient vessels to align with sustainability objectives. Harsh weather conditions require vessels with advanced stability and safety systems. Strategic port locations facilitate efficient regional deployment. Government-backed diversification programs are opening opportunities for offshore wind in the medium term.

Africa

The Africa Service Operation Vessels (SOV) Sales Market size was valued at USD 23.83 million in 2018 to USD 35.24 million in 2024 and is anticipated to reach USD 58.25 million by 2032, at a CAGR of 6.5% during the forecast period. Africa represents 2.23% of the global market share in 2024, with South Africa and Egypt emerging as key markets. Offshore oil production in West Africa remains the main driver of vessel demand. It supports operations in remote deep-water fields, requiring high-endurance vessels. Renewable energy projects in coastal nations are starting to create additional market opportunities. Limited domestic manufacturing capacity results in vessel imports from Europe and Asia. Harsh offshore environments necessitate advanced safety and stability features. Government initiatives to expand renewable energy infrastructure are expected to support long-term vessel demand. Regional operators are forming partnerships with international players to enhance technical and operational capabilities.

Shape Your Report to Specific Countries or Regions & Enjoy 30% Off!

Key Player Analysis:

  • Royal IHC
  • ESVAGT
  • Ulstein Group
  • Havyard Group
  • Edda Wind
  • Acta Marine
  • North Star
  • ABB Marine & Ports
  • SBM Offshore
  • Other Key Players

Competitive Analysis:

The Service Operation Vessels (SOV) Sales Market is characterized by a mix of established maritime companies and specialized offshore service providers competing for long-term contracts. Key players such as Royal IHC, ESVAGT, Ulstein Group, Havyard Group, and Edda Wind focus on advanced vessel design, hybrid propulsion systems, and enhanced safety features to differentiate their offerings. It is witnessing increased investment in automation, remote monitoring, and predictive maintenance capabilities to improve operational efficiency. Strategic collaborations, mergers, and regional expansions are common as companies aim to strengthen market presence. Competition is influenced by vessel performance, compliance with environmental standards, and the ability to provide tailored solutions for both offshore wind and oil sectors.

Recent Developments:

  • In August 2025, RWE and North Star announced a strategic partnership, securing long-term charter agreements for two next-generation service operation vessels (SOVs) the Grampian Eagle and the Grampian Kestrel from North Star. These vessels feature advanced low-emission fuel capabilities, supporting maintenance at RWE’s offshore wind farms in both the UK and Germany.
  • In March 2025, Northern Offshore Group, owned by NYK, finalized the acquisition of its first Service Operation Vessel (SOV) from Edda Wind A/S. This move marks Northern Offshore Group’s entrance into owning SOVs, complementing its extensive crew transfer vessel fleet and bolstering its operational capability for offshore wind farm support across Europe, Japan, and the Asia-Pacific region.
  • In March 2025, Edda Wind completed the sale of the SOV Mistral Enabler, following the sale of its sister vessel Edda Passat in 2024. The sale aims to homogenize Edda Wind’s fleet of modern and flexible SOVs and CSOVs, with all newbuilds prepared for zero-emission solutions utilizing liquid organic hydrogen carriers and methanol.

Market Concentration & Characteristics:

The Service Operation Vessels (SOV) Sales Market displays moderate concentration, with a few global players controlling significant market share and several regional operators serving niche demands. It is driven by high entry barriers due to capital-intensive vessel construction, complex regulatory compliance, and specialized operational expertise. Market characteristics include a strong emphasis on hybrid propulsion adoption, safety technology integration, and long-term service contracts tied to offshore wind and oil projects. Demand stability is supported by recurring maintenance needs and expanding renewable energy infrastructure worldwide.

Report Coverage:

The research report offers an in-depth analysis based on Type, Technology, Operation Type and End User Industry. It details leading market players, providing an overview of their business, product offerings, investments, revenue streams, and key applications. Additionally, the report includes insights into the competitive environment, SWOT analysis, current market trends, as well as the primary drivers and constraints. Furthermore, it discusses various factors that have driven market expansion in recent years. The report also explores market dynamics, regulatory scenarios, and technological advancements that are shaping the industry. It assesses the impact of external factors and global economic changes on market growth. Lastly, it provides strategic recommendations for new entrants and established companies to navigate the complexities of the market.

Future Outlook:

  • Expansion of offshore wind farms in major coastal regions will drive consistent demand for advanced SOVs.
  • Adoption of hybrid and electric propulsion technologies will increase with stricter environmental regulations.
  • Integration of automation and digital twin solutions will enhance efficiency and reduce downtime.
  • Demand for multi-purpose vessels will grow to optimize logistics and lower operational costs.
  • Remote monitoring and predictive maintenance will become essential for reliable fleet management.
  • Harsh-environment vessel designs will gain traction for deepwater and polar operations.
  • Strategic alliances between shipbuilders and energy firms will support customized vessel development.
  • Crew welfare improvements, including enhanced living standards, will influence operator preferences.
  • Regional shipbuilding expansion will reduce import reliance in emerging markets.
  • Long-term service contracts linked to renewable energy projects will secure stable revenues for operators.

CHAPTER NO. 1 :   GENESIS OF THE MARKET       

1.1 Market Prelude – Introduction & Scope

1.2 The Big Picture – Objectives & Vision

1.3 Strategic Edge – Unique Value Proposition

1.4 Stakeholder Compass – Key Beneficiaries

CHAPTER NO. 2 :   EXECUTIVE LENS

2.1 Pulse of the Industry – Market Snapshot

2.2 Growth Arc – Revenue Projections (USD Million)

2.3. Premium Insights – Based on Primary Interviews

CHAPTER NO. 3 :   SERVICE OPERATION VESSELS (SOV) SALES MARKET FORCES & INDUSTRY PULSE        

3.1 Foundations of Change – Market Overview
3.2 Catalysts of Expansion – Key Market Drivers
3.2.1 Momentum Boosters – Growth Triggers
3.2.2 Innovation Fuel – Disruptive Technologies
3.3 Headwinds & Crosswinds – Market Restraints
3.3.1 Regulatory Tides – Compliance Challenges
3.3.2 Economic Frictions – Inflationary Pressures
3.4 Untapped Horizons – Growth Potential & Opportunities
3.5 Strategic Navigation – Industry Frameworks
3.5.1 Market Equilibrium – Porter’s Five Forces
3.5.2 Ecosystem Dynamics – Value Chain Analysis
3.5.3 Macro Forces – PESTEL Breakdown

3.6 Price Trend Analysis

3.6.1 Regional Price Trend
3.6.2 Price Trend By Type

CHAPTER NO. 4 :   KEY INVESTMENT EPICENTER           

4.1 Regional Goldmines – High-Growth Geographies

4.2 Product Frontiers – Lucrative Type Categories

4.3 Technology Sweet Spots – Emerging Demand Segments

CHAPTER NO. 5: REVENUE TRAJECTORY & WEALTH MAPPING

5.1 Momentum Metrics – Forecast & Growth Curves

5.2 Regional Revenue Footprint – Market Share Insights

5.3 Segmental Wealth Flow – Type, Technology, Operation Type, & End User Industry Revenue

CHAPTER NO. 6 :   TRADE & COMMERCE ANALYSIS      

6.1.      Import Analysis By Region

6.1.1.   Global Service Operation Vessels (SOV) Sales Market Import Revenue By Region

6.2.      Export Analysis By Region

6.2.1.   Global Service Operation Vessels (SOV) Sales Market Export Revenue By Region

CHAPTER NO. 7 :   COMPETITION ANALYSIS         

7.1.      Company Market Share Analysis

7.1.1.   Global Service Operation Vessels (SOV) Sales Market: Company Market Share

7.2.      Global Service Operation Vessels (SOV) Sales Market Company Revenue Market Share

7.3.      Strategic Developments

7.3.1.   Acquisitions & Mergers

7.3.2.   New Product Launch

7.3.3.   Regional Expansion

7.4.      Competitive Dashboard

7.5.      Company Assessment Metrics, 2024

CHAPTER NO. 8 :   SERVICE OPERATION VESSELS (SOV) SALES MARKET – BY TYPE SEGMENT ANALYSIS  

8.1.      Service Operation Vessels (SOV) Sales Market Overview By Type Segment

8.1.1.   Service Operation Vessels (SOV) Sales Market Revenue Share By Type

8.2.      Hybrid SOVs

8.3        Non-Hybrid SOVs

CHAPTER NO. 9 :   SERVICE OPERATION VESSELS (SOV) SALES MARKET – BY TECHNOLOGY SEGMENT ANALYSIS

9.1.      Service Operation Vessels (SOV) Sales Market Overview By Technology Segment

9.1.1.   Service Operation Vessels (SOV) Sales Market Revenue Share By Technology

9.2.      Automation Systems

9.3.      Fuel-Efficient Engines

9.4.      Safety Technologies

9.5.      Remote Monitoring

9.6.      Predictive Maintenance

CHAPTER NO. 10 : SERVICE OPERATION VESSELS (SOV) SALES MARKET – BY OPERATION TYPE SEGMENT ANALYSIS

10.1.    Service Operation Vessels (SOV) Sales Market Overview By Operation Type Segment

10.1.1. Service Operation Vessels (SOV) Sales Market Revenue Share By Operation Type

10.2.    Installation Vessels

10.3.    Maintenance Vessels

CHAPTER NO. 11 : SERVICE OPERATION VESSELS (SOV) SALES MARKET – BY END USER INDUSTRY SEGMENT ANALYSIS       

11.1.    Service Operation Vessels (SOV) Sales Market Overview By End User Industry Segment

11.1.1. Service Operation Vessels (SOV) Sales Market Revenue Share By End User Industry

11.2.    Offshore Wind Operators

11.3.    Offshore Oil & Gas Operators

11.4.    Renewable Energy Companies

11.5.    Government & Public Sector

CHAPTER NO. 12 : SERVICE OPERATION VESSELS (SOV) SALES MARKET – REGIONAL ANALYSIS      

12.1.    Service Operation Vessels (SOV) Sales Market Overview By Region Segment

12.1.1. Global Service Operation Vessels (SOV) Sales Market Revenue Share By Region

12.1.2. Regions

12.1.3. Global Service Operation Vessels (SOV) Sales Market Revenue By Region

12.1.4. Type

12.1.5.Global Service Operation Vessels (SOV) Sales Market Revenue By Type

12.1.6. Technology

12.1.7. Global Service Operation Vessels (SOV) Sales Market Revenue By Technology

12.1.8. Operation Type

12.1.9. Global Service Operation Vessels (SOV) Sales Market Revenue By Operation Type

12.1.10.           End User Industry

12.1.11.           Global Service Operation Vessels (SOV) Sales Market Revenue By End User Industry

CHAPTER NO. 13 : NORTH AMERICA SERVICE OPERATION VESSELS (SOV) SALES MARKET – COUNTRY ANALYSIS

13.1.    North America Service Operation Vessels (SOV) Sales Market Overview By Country Segment

13.1.1. North America Service Operation Vessels (SOV) Sales Market Revenue Share By Region

13.2.    North America

13.2.1. North America Service Operation Vessels (SOV) Sales Market Revenue By Country

13.2.2. Type

13.2.3. North America Service Operation Vessels (SOV) Sales Market Revenue By Type

13.2.4. Technology

13.2.5. North America Service Operation Vessels (SOV) Sales Market Revenue By Technology

13.2.6. Operation Type

13.2.7. North America Service Operation Vessels (SOV) Sales Market Revenue By Operation Type

13.2.8. End User Industry

13.2.9. North America Service Operation Vessels (SOV) Sales Market Revenue By End User Industry

13.3.    U.S.

13.4.    Canada

13.5.    Mexico

CHAPTER NO. 14 : EUROPE SERVICE OPERATION VESSELS (SOV) SALES MARKET – COUNTRY ANALYSIS

14.1.    Europe Service Operation Vessels (SOV) Sales Market Overview By Country Segment

14.1.1. Europe Service Operation Vessels (SOV) Sales Market Revenue Share By Region

14.2.    Europe

14.2.1. Europe Service Operation Vessels (SOV) Sales Market Revenue By Country

14.2.2. Type

14.2.3.Europe Service Operation Vessels (SOV) Sales Market Revenue By Type

14.2.4. Technology

14.2.5. Europe Service Operation Vessels (SOV) Sales Market Revenue By Technology

14.2.6. Operation Type

14.2.7. Europe Service Operation Vessels (SOV) Sales Market Revenue By Operation Type

14.2.8. End User Industry

14.2.9. Europe Service Operation Vessels (SOV) Sales Market Revenue By End User Industry

14.3.    UK

14.4.    France

14.5.    Germany

14.6.    Italy

14.7.    Spain

14.8.    Russia

14.9.   Rest of Europe

CHAPTER NO. 15 : ASIA PACIFIC SERVICE OPERATION VESSELS (SOV) SALES MARKET – COUNTRY ANALYSIS      

15.1.    Asia Pacific Service Operation Vessels (SOV) Sales Market Overview By Country Segment

15.1.1. Asia Pacific Service Operation Vessels (SOV) Sales Market Revenue Share By Region

15.2.    Asia Pacific

15.2.1. Asia Pacific Service Operation Vessels (SOV) Sales Market Revenue By Country

15.2.2. Type

15.2.3. Asia Pacific Service Operation Vessels (SOV) Sales Market Revenue By Type

15.2.4. Technology

15.2.5. Asia Pacific Service Operation Vessels (SOV) Sales Market Revenue By Technology

15.2.6. Operation Type

15.2.7. Asia Pacific Service Operation Vessels (SOV) Sales Market Revenue By Operation Type

15.2.8. End User Industry

15.2.9.Asia Pacific Service Operation Vessels (SOV) Sales Market Revenue By End User Industry

15.3.    China

15.4.    Japan

15.5.    South Korea

15.6.    India

15.7.    Australia

15.8.    Southeast Asia

15.9.    Rest of Asia Pacific

CHAPTER NO. 16 : LATIN AMERICA SERVICE OPERATION VESSELS (SOV) SALES MARKET – COUNTRY ANALYSIS

16.1.    Latin America Service Operation Vessels (SOV) Sales Market Overview By Country Segment

16.1.1. Latin America Service Operation Vessels (SOV) Sales Market Revenue Share By Region

16.2.    Latin America

16.2.1. Latin America Service Operation Vessels (SOV) Sales Market Revenue By Country

16.2.2. Type

16.2.3. Latin America Service Operation Vessels (SOV) Sales Market Revenue By Type

16.2.4. Technology

16.2.5. Latin America Service Operation Vessels (SOV) Sales Market Revenue By Technology

16.2.6. Operation Type

16.2.7. Latin America Service Operation Vessels (SOV) Sales Market Revenue By Operation Type

16.2.8. End User Industry

16.2.9. Latin America Service Operation Vessels (SOV) Sales Market Revenue By End User Industry

16.3.    Brazil

16.4.    Argentina

16.5.    Rest of Latin America

CHAPTER NO. 17 : MIDDLE EAST SERVICE OPERATION VESSELS (SOV) SALES MARKET – COUNTRY ANALYSIS

17.1.    Middle East Service Operation Vessels (SOV) Sales Market Overview By Country Segment

17.1.1. Middle East Service Operation Vessels (SOV) Sales Market Revenue Share By Region

17.2.    Middle East

17.2.1. Middle East Service Operation Vessels (SOV) Sales Market Revenue By Country

17.2.2. Type

17.2.3. Middle East Service Operation Vessels (SOV) Sales Market Revenue By Type

17.2.4. Technology

17.2.5. Middle East Service Operation Vessels (SOV) Sales Market Revenue By Technology

17.2.6. Operation Type

17.2.7. Middle East Service Operation Vessels (SOV) Sales Market Revenue By Operation Type

17.2.8. End User Industry

17.2.9.Middle East Service Operation Vessels (SOV) Sales Market Revenue By End User Industry

17.3.    GCC Countries

17.4.    Israel

17.5.    Turkey

17.6.    Rest of Middle East

CHAPTER NO. 18 : AFRICA SERVICE OPERATION VESSELS (SOV) SALES MARKET – COUNTRY ANALYSIS

18.1.    Africa Service Operation Vessels (SOV) Sales Market Overview By Country Segment

18.1.1. Africa Service Operation Vessels (SOV) Sales Market Revenue Share By Region

18.2.    Africa

18.2.1. Africa Service Operation Vessels (SOV) Sales Market Revenue By Country

18.2.2. Type

18.2.3. Africa Service Operation Vessels (SOV) Sales Market Revenue By Type

18.2.4. Technology

18.2.5. Africa Service Operation Vessels (SOV) Sales Market Revenue By Technology

18.2.6. Operation Type

18.2.7. Africa Service Operation Vessels (SOV) Sales Market Revenue By Operation Type

18.2.8. End User Industry

18.2.9. Africa Service Operation Vessels (SOV) Sales Market Revenue By End User Industry

18.3.    South Africa

18.4.    Egypt

18.5.    Rest of Africa

CHAPTER NO. 19 : COMPANY PROFILES     

19.1.    Royal IHC

19.1.1.            Company Overview

19.1.2.            Product Portfolio

19.1.3.            Financial Overview

19.1.4.            Recent Developments

19.1.5.            Growth Strategy

19.1.6.            SWOT Analysis

19.2.    ESVAGT

19.3.    Ulstein Group

19.4.    Havyard Group

19.5.     Edda Wind

19.6.     Acta Marine

19.7.     North Star

19.8.     ABB Marine & Ports

19.9.      SBM Offshore

19.10.    Other Key Players


Ready to Transform Data into Decisions?

Request Your Sample Report and Start Your Journey of Informed Choices


Providing the strategic compass for industry titans.

Request Free Sample

Frequently Asked Questions

What is the current market size for Service Operation Vessels (SOV) Sales Market, and what is its projected size in 2032?

The Service Operation Vessels (SOV) Sales Market was valued at USD 1,578.4 million in 2024 and is projected to reach USD 2,734.7 million by 2032, reflecting sustained global demand.

At what Compound Annual Growth Rate is the Service Operation Vessels (SOV) Sales Market projected to grow between 2024 and 2032?

The Service Operation Vessels (SOV) Sales Market is forecast to grow at a CAGR of 7.12% between 2024 and 2032, supported by offshore wind expansion and fleet modernization.

What are the primary factors fueling the growth of the Service Operation Vessels (SOV) Sales Market?

Growth in the Service Operation Vessels (SOV) Sales Market is fueled by offshore wind farm expansion, technological advancements, and rising demand for sustainable vessel operations.

How is technology impacting the SOV sales market?

Technological advancements, including enhanced automation, fuel efficiency, and safety features, are making SOVs more attractive to operators, helping improve productivity and meet environmental regulations.

About Author

Ganesh Chandwade

Ganesh Chandwade

Senior Industry Consultant

Ganesh is a senior industry consultant specializing in heavy industries and advanced materials.

View Profile

Energy as a Service Market

The Global Energy As A Service Market size was valued at USD 46,500.00 million in 2018 to USD 73,351.99 million in 2024 and is anticipated to reach USD 1,86,631.55 million by 2032, at a CAGR of 12.44% during the forecast period.

Enterprise Telecom Services Market

The Enterprise Telecom Services Market size was valued at USD 824,847.2 million in 2024 and is expected to reach USD 1,365,118.5 million by 2032, growing at a compound annual growth rate (CAGR) of 6.5% during the forecast period.

Cold Gas Spray Services Market

The Cold Gas Spray Services Market was valued at USD 346.8 million in 2024 and is projected to reach USD 485.68 million by 2032, reflecting a CAGR of 4.3% during the forecast period.

Veterinary Services Market

The veterinary services market is projected to grow from USD 119,165 million in 2024 to an estimated USD 210,480 million by 2032, with a compound annual growth rate (CAGR) of 7.37% from 2024 to 2032.

Video Surveillance-as-a-Service Market

The Video Surveillance-as-a-Service (VSaaS) Market size was valued at USD 2,100.00 million in 2018 to USD 3,638.54 million in 2024 and is anticipated to reach USD 13,150.21 million by 2032, at a CAGR of 17.49% during the forecast period.

Veterinary Diagnostic Services Market

The Veterinary Diagnostic Services Market size was valued at USD 14345 million in 2024 and is anticipated to reach USD 27207.6 million by 2032, at a CAGR of 8.33% during the forecast period (2024-2032).

Wireline Logging Services Market

The wireline logging services market size was valued at USD 11085 million in 2024 and is anticipated to reach USD 14151.5 million by 2032, at a CAGR of 3.1 % during the forecast period (2024-2032).

Telehealth Service Market

The Telehealth Service Market was valued at USD 59,859 million in 2024 and is projected to reach USD 488,288 million by 2032, expanding at a CAGR of 30% during the forecast period.

IT Professional Services Market

The IT professional services market is projected to grow from USD 649,087 million in 2024 to an estimated USD 923,067 million by 2032, with a compound annual growth rate (CAGR) of 4.5% from 2024 to 2032.

Saudi Arabia Fuel Station Market

The Saudi Arabia Fuel Station Market size was valued at USD 32,656.50 million in 2018 to USD 43,195.10 million  in 2024 and is anticipated to reach USD 66,528.40 million by 2032, at a CAGR of 5.61% during the forecast period.

Combined Cycle Gas Turbine Market

The Combined Cycle Gas Turbine Market size was valued at USD 14,681 million in 2024 and is anticipated to reach USD 22,702 million by 2032, growing at a CAGR of 5.6% during the forecast period.

Storage Tank Equipment Market

The Storage tank equipment market size was valued at USD 5512 million in 2024 and is anticipated to reach USD 8081.89 million by 2032, at a CAGR of 4.9 % during the forecast period (2024-2032).

Offshore Scaffolding Market

The Offshore Scaffolding market size was valued at USD 2,783.0 million in 2018, increased to USD 3,986.9 million in 2024, and is anticipated to reach USD 6,668.8 million by 2032, at a CAGR of 6.69% during the forecast period.

Oil and Gas Scaffolding Market

The Oil and Gas Scaffolding market size was valued at USD 4,825.2 million in 2018, increased to USD 7,663.3 million in 2024, and is anticipated to reach USD 13,320.8 million by 2032, at a CAGR of 7.13% during the forecast period.

Acetylene Gas Market

The Acetylene Gas Market size was valued at USD 6150 million in 2024 and is anticipated to reach USD 7217 million by 2032, at a CAGR of 2.02% during the forecast period (2024-2032).

Green Gas Market

The green gas market size was valued at USD 2,150 million in 2024 and is anticipated to reach USD 3,375 million by 2032, at a CAGR of 5.8 % during the forecast period (2024-2032).

VOC Recovery And Abatement Market

The Global VOC Recovery and Abatement Market is projected to grow from USD 1,425.7 million in 2024 to an estimated USD 2,043.1 million by 2032, with a compound annual growth rate (CAGR) of 4.63% from 2025 to 2032.

Borehole Yield Testing Market

The Global Borehole Yield Testing Market size was valued at USD 294.63 million in 2018 to USD 461.82 million in 2024 and is anticipated to reach USD 844.53 million by 2032, at a CAGR of 7.30% during the forecast period.

Bunkering Services Market

The Bunkering Services Market size was valued at USD 1,56,000.00 million in 2018 to USD 1,90,778.14 million in 2024 and is anticipated to reach USD 3,10,717.97 million by 2032, at a CAGR of 6.35% during the forecast period.

3D Printed Gas Turbine Market

The Global 3D Printed Gas Turbine Market size was valued at USD 810.91 million in 2018 to USD 1,630.41 million in 2024 and is anticipated to reach USD 4,900.36 million by 2032, at a CAGR of 13.74% during the forecast period.

CNG Cylinders Market

The CNG Cylinders Market size was valued at USD 1,446.0 million in 2018 to USD 2,353.5 million in 2024 and is anticipated to reach USD 4,435.1 million by 2032, at a CAGR of 8.26% during the forecast period.

Purchase Options

The report comes as a view-only PDF document, optimized for individual clients. This version is recommended for personal digital use and does not allow printing.
$4699

To meet the needs of modern corporate teams, our report comes in two formats: a printable PDF and a data-rich Excel sheet. This package is optimized for internal analysis and multi-location access, making it an excellent choice for organizations with distributed workforce.
$5699

The report will be delivered in printable PDF format along with the report’s data Excel sheet. This license offers 100 Free Analyst hours where the client can utilize Credence Research Inc.’s research team. It is highly recommended for organizations seeking to execute short, customized research projects related to the scope of the purchased report.
$12699

Credence Staff 3

WILLIAM, North America

Support Staff at Credence Research

KEITH PHILLIPS, Europe

Lee - CR Sales Staff

LEE VALLANCE, Asia Pacific

Kieran Jameson

KIERAN JAMESON, Australia

Smallform of Sample request

Report delivery within 24 to 48 hours

What people say?-

User Review

I am very impressed with the information in this report. The author clearly did their research when they came up with this product and it has already given me a lot of ideas.

Jana Schmidt
CEDAR CX Technologies

– Connect with us –


support

24/7 Research Support


– Research Methodology –

Going beyond the basics: advanced techniques in research methodology

Pepshi, LG, Nestle
Motorola, Honeywell, Johnson and johnson
LG Chem, SIEMENS, Pfizer
Unilever, Samsonite, QIAGEN