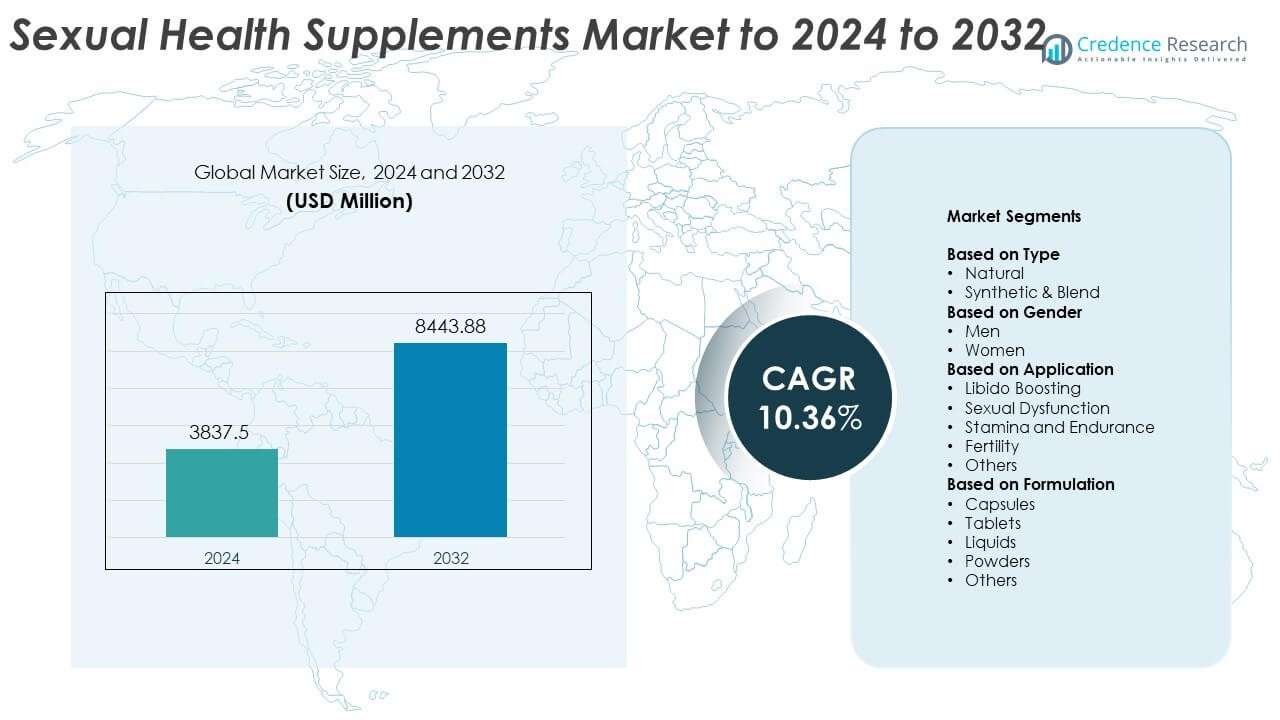
Home » Healthcare » Sexual Health Supplements Market

Sexual Health Supplements Market By Gender (Men, Women) By Formulation (Capsules, Tablets, Softgel, Liquid, Powder) By Distribution Channel (Offline Store, Online Store) By Product (Natural, Synthetic & Blend)-Growth, Future Prospects & Competitive Analysis, 2016 – 2030

Price: $4999

Published: | Report ID: 19006 | Report Format : PDF

Key Highlights of the Report

The global sexual health supplements market is segmented by gender, formulation, distribution channel, product, and region. Men-segment is the most popular, while capsules’ primary user segment held the largest share. The offline store is the highest CAGR in the distribution channels, whereas, between products naturals segment held the largest share, with North America leading the market growth.

The global sexual health supplements market has several drivers, including The rising awareness and willingness of people to address sexual health issues is one of the most significant reasons. The demand for goods that can improve sexual performance and well-being has increased as there is more openness and awareness about sexual health. People are searching for goods that can assist them in improving their sexual function as they become more aware of the effects of stress, lifestyle, and aging on their sexual health. In addition, The aging population, shifting attitudes towards sexual health, technological and product innovation, an increase in the prevalence of stress- and lifestyle-related health issues, marketing and promotion, growing acceptance of alternative medicine, an increase in the prevalence of erectile dysfunction, an increase in the popularity of performance-enhancing supplements, and an increase in interest in sexual wellness are some additional factors driving the growth of the global market for sexual enhancement supplements. Another factor influencing the market’s expansion is the accessibility of various sexual enhancement pills, including natural and herbal-based goods. However, the market also faces significant challenges, such as the presence of alternatives for sexual enhancement supplements.

Nonetheless, the global sexual health supplements market offers significant growth opportunities, including the rapid expansion of e-commerce, the availability of supplements in various dose forms, and the introduction of new sexual health supplements are all emerging trends in the business.

Market Overview

The global sexual health supplements market has witnessed steady growth in recent years and is expected to continue growing at a CAGR of 8.90% between 2023 and 2030. The market was valued at USD 2.2 billion in 2022 and is expected to reach USD 4.0 billion in 2030.

Design Element 2

Access crucial information at unmatched prices!

Request your free sample report today & start making informed decisions powered by Credence Research!

Download Free Sample
CTA Design Element 3

What Are The Main Drivers Of The Global Sexual health supplements Market?

The global sexual health supplements market is driven by several factors, including ers. The rising awareness and willingness of people to address sexual health issues is one of the most significant reasons. The demand for goods that can improve sexual performance and well-being has increased as there is more openness and awareness about sexual health. People are searching for goods that can assist them in improving their sexual function as they become more aware of the effects of stress, lifestyle, and aging on their sexual health. In addition, The aging population, shifting attitudes towards sexual health, technological and product innovation, an increase in the prevalence of stress- and lifestyle-related health issues, marketing and promotion, growing acceptance of alternative medicine, an increase in the prevalence of erectile dysfunction, an increase in the popularity of performance-enhancing supplements, and an increase in interest in sexual wellness are some additional factors driving the growth of the global market for sexual enhancement supplements. Another factor influencing the market’s expansion is the accessibility of various sexual enhancement pills, including natural and herbal-based goods.

What Are The Major Challenges Faced By The Global Sexual health supplements Market?

The global sexual health supplements market also faces several challenges, including the presence of alternatives for sexual enhancement supplements.

What Are The Growth Opportunities In The Global Sexual health supplements Market?

The global sexual health supplements market offers significant growth opportunities, including huge growth potential in the Asia Pacific region, the increasing adoption of sexual health supplements in educational settings, and new ways of distribution, such as e-commerce.

Executive Summary

Overview of the Global Sexual health supplements Market

The global sexual health supplements market has been steadily growing in recent years, driven by people becoming more aware of the value of preventative healthcare and adopting proactive measures to maintain their health and wellness. The global health and wellness business is also expanding. This includes sexual health-related items, driving the rising demand for supplements for sexual performance. The market caters to a variety of consumer preferences with a wide range of gender, formulation, distribution method, and product.

Sexual health supplements Market

Market Definition

Natural and artificial substances produce sexual health supplements to help men and women with sexual health problems. It also has other components, including folic acid, zinc, antioxidants, and other minerals and vitamins. Natural substances have become increasingly popular lately. Both men and women benefit from improved sexual health without experiencing negative side effects. Additionally, there is no requirement for a doctor’s prescription to purchase sexual health supplements, which supports the market growth for these products.

Market Insights

  • The global demand for sexual health supplements was valued at USD 2.2 Billion in 2022 and is expected to reach USD 4.0 Billion in 2030, growing at a CAGR of 8.90% between 2023 and 2030.
  • Men hold the leading segment by gender and held over 43% share in terms of value in 2022, while the women segment is likely to exhibit the fastest CAGR during the forecast period.
  • The capsules segment governs the demand for sexual health supplements globally, holding a massive share of over 80% in 2022, and is expected to grow at a rapid CAGR.
  • The offline store segment is expected to post the highest CAGR during the forecast period, while the online store segment is leading the market share with over 30% share in 2022.
  • Natural products hold the maximum share in the products segment.
  • North America is fueling the growth of the sexual health supplements industry with an over one-third share in 2022, while Asia Pacific and Europe collectively account for just under 50% share in 2022. Europe held over 22% share in 2022.
  • As a result, the demand for sexual enhancement supplements is being driven by the rising geriatric population across North America, which in turn is boosting the market’s expansion in the region. At the same time, the presence of alternatives in the market for sexual enhancement supplements is the main restraint.
  • The rapid expansion of e-commerce, the availability of supplements in various dose forms, and the introduction of new sexual health supplements are all emerging trends in the business and are major opportunities in the market.

Segmentation by Gender

  • Men are the leading segment by gender and held over 43% share in terms of value in 2022.
  • The women segment will likely exhibit the fastest CAGR during the forecast period.

Segmentation by Formulation

  • The capsule segment governs the demand for sexual health supplements in the world, holding a massive share of over 80% in 2022, and is also expected to grow at a rapid CAGR.

Segmentation by Distribution Channel

  • The offline store segment is expected to post the highest CAGR during the forecast period.
  • The online store’s segment is leading the market share with over 30% share in 2022.

Segmentation by Product

  • The natural products segment is expected to post the highest share during the forecast period.

Segmentation by Region

  • North America is fueling the growth of the sexual health supplements industry with over one-third share in 2022.
  • Asia Pacific and Europe collectively account for just under 50% share in 2022, with Europe holding over 22% share in the same year.
  • The rest of the World, including Latin America, The Middle East, and Africa, contributes the remainder to the demand for sexual health supplements.

The increasing demand for sexual health supplements can be attributed to the rising prevalence of erectile dysfunction and the adverse drug reactions from drugs like antidepressants that result in low sexual drive or sexual dysfunction. However, the market is restrained by the presence of alternatives for sexual enhancement supplements.

The United States is one of the largest markets for sexual health supplements in North America, with a significant share of the market. There has been an increase in demand for supplements and items that help improve sexual performance and well-being as individuals become more open and aware of sexual health issues. People are more prepared to spend on their health and well-being, including their sexual health, due to a growing middle class and increased disposable money. Products for sexual health are part of the expanding health and wellness market in the United States. The use of vitamins and other goods to improve sexual performance and general well-being is increasingly encouraged and normalized in popular culture and the media. The growth of e-commerce has made it simpler for people to covertly and conveniently buy sexual enhancement supplements.

China is also a major market for sexual health supplements in the Asia Pacific region, with a significant market share. Because there are more than 1.4 billion people in China, people are more prepared to invest in their health and well-being, including their sexual health, as the middle class has grown and disposable income has increased. Additionally, preserving harmony and balance in the body—which includes maintaining sexual health—is highly valued in traditional Chinese culture. The need for natural treatments and supplements that can improve general health and sexual performance has been sparked by this cultural idea.

The market for sexual enhancement supplements is also expanding in China due to the country’s growing awareness and openness around sexual health issues. The development of e-commerce platforms has made it simpler for customers to buy such things covertly and conveniently, further enabling this.

Overall, individuals are becoming more conscious of the importance of preventative healthcare and taking proactive steps to preserve their health and wellness, which can be attributed to the rising demand for sexual health supplements. The global health and wellness business is also expanding. This includes sexual health-related items, driving the rising demand for supplements for sexual performance.

While the sexual health supplements market is growing, it faces challenges from the presence of alternatives in the market for sexual enhancement supplements. Manufacturers are innovating and forming partnerships to stay competitive.

Increasing the Use of Herbal Supplements and the High-Risk Factors Associated with Sexual Issues

People’s shifting lifestyles impact human health by increasing the risk of diseases like cancer, diabetes, asthma, cancer, and other chronic illnesses. All of these elements directly impact both men’s and women’s sexual health. The demand for care also greatly grew as sexual health problems increased. Because individuals are becoming more conscious of preserving their health, they use more biobased goods and herbal supplements. The risk of side effects is reduced by natural sexual health supplements, which have recently been one of the key drivers boosting demand in the market for sexual health supplements.

The availability of supplements in a variety of dose forms

Sexual enhancement products that come in a variety of dosage forms, including liquid and oral capsules, creams, sprays, gels, and lotions, are the ones that dominate the global market for sex enhancers. Aytu Bioscience Inc., Leading Edge Marketing Inc., Doc Johnson Enterprises, and Reckitt Benckiser Group Plc are just a few of the key industry players that sell a variety of sexual enhancement pills in various dose forms. The availability of supplements in various dosage forms enables patients to customize their supplement dosage following their needs. It also helps to boost consumer acceptance and adherence, which expands the user base.

For instance, older people generally choose sprays, creams, gels, or lotion formulations over pills due to the frequency of extra comorbid conditions typically associated with oral drugs for various lifestyle disorders such as diabetes, obesity, and hypertension. As a result, these consumers take fewer pills. For instance, ProSolution pills, ProSolution gel, VigRX Delay Spray, VigRX oil, and MaxoDerm lotion are just a few of the numerous supplements that Leading Edge Marketing offers in a variety of dosage forms for both men and women. Customers can select the ideal supplement thanks to the availability of a wide variety of such items in different dosage forms, which raises the user adherence ratio. This is anticipated to accelerate the market’s expansion during the projected period.

The availability of alternatives will be a significant barrier to the market for sexual enhancement supplements.

The availability of substitute goods, such as lubricated condoms, sex toys, and exotic lingerie, has a detrimental impact on consumer purchasing tendencies, which causes a decrease in the use of sexual enhancement supplements. Lesbian, gay, bisexual, and transgender (LGBT) individuals frequently utilize sex toys in English-speaking nations. This group is known as the LGBT community.

Sex toys, a good substitute for sexual enhancement drugs, are becoming increasingly popular due to society’s increasing acceptance of the LGBT community. Sexual enhancement products like lubricating gels for dry vaginas and the essential oils, creams, lotions, and sprays used to arouse the sex are potentially replaced by lubricating condoms and sensual undergarments. So, it is anticipated that the availability of substitutes will restrain the development of

The rapid expansion of e-commerce is a result of sexual enhancement products.

The use of e-commerce as a supplement distribution and sales method is becoming more prevalent in the global market for sexual enhancement products. Due to the advantages of e-commerce solutions, including the ease for patients who do not want to buy sexual enhancement pills from retail or hospital channels, the e-commerce sector is predicted to experience exponential growth in the upcoming years.

The need for sexual enhancement pills has also increased due to the rising prevalence of ED in men and other sexual disorders in both men and women. This has widened the discrepancy between supply and demand for these supplements. This heightens the demand for e-commerce throughout the projection period.

Competitive Landscape

Key Players

The global sexual health supplements market is highly competitive, with the presence of several key players. Some of the major players in the market and their market share are as follows:

  • Ambic Ayurved India Pvt. Ltd.
  • Aytu BioPharma Inc.
  • BioFilm Inc.
  • Church and Dwight Co. Inc.
  • Cyanotech Corp.
  • Dabur India Ltd.
  • Doc Johnson Enterprises
  • GNC Holdings LLC
  • Good Clean Love Inc.
  • Herbalife International of America Inc.
  • Hi Tech Pharmaceuticals Inc.
  • Himalaya Global Holdings Ltd.
  • Leading Edge Health Inc.
  • Lovehoney Group Ltd.

These companies focus on product innovation, expanding their distribution channels, and mergers and acquisitions to stay ahead in the market. The major players in the global sexual health supplements market constantly strive to stay ahead by introducing new products and innovations.

ProSolution pills, ProSolution gel, VigRX Delay Spray, VigRX oil, and MaxoDerm lotion are just a few of the numerous supplements Leading Edge Marketing offers in various dosage forms for both men and women.

Shape Your Report to Specific Countries or Regions & Enjoy 30% Off!

Summary of Key Findings

  • The rising prevalence of erectile dysfunction and the adverse drug reactions from drugs like antidepressants that result in low sexual drive or sexual dysfunction is driving the market growth.
  • Market segmented by gender, formulation, distribution channel, product, and region.
  • Men are the most popular segment by gender, with women as primary user segments.
  • Capsules are most commonly used for formulation.
  • North America is leading market growth; the market is highly competitive with key players including Ambic Ayurved India Pvt. Ltd., Aytu BioPharma Inc., BioFilm Inc., Church and Dwight Co. Inc., Cyanotech Corp., Dabur India Ltd., Doc Johnson Enterprises, GNC Holdings LLC, Good Clean Love Inc., Herbalife International of America Inc., Hi Tech Pharmaceuticals Inc., Himalaya Global Holdings Ltd., Leading Edge Health Inc., and Lovehoney Group Ltd.

Future Outlook

  • Positive outlook for the global sexual health supplements market with significant growth potential in the North American region
  • The rapid expansion of e-commerce, the availability of supplements in various dose forms, and the introduction of new sexual health supplements are all emerging trends in the business to drive growth.
  • Challenges from the presence of alternatives in the market for sexual enhancement supplements.
  • Key players to focus on product innovation, expanding market reach and maintaining competitive pricing to stay ahead in the market.

Segmentation

  • By Gender
    • Men
    • Women
  • By Formulation
    • Capsules
    • Tablets
    • Softgel
    • Liquid
    • Powder
  • By Distribution Channel
    • Offline Store
    • Online Store
  • By Product
    • Natural
    • Synthetic & Blend
  • By Region
  • North America
    • The US.
    • Canada
    • Mexico
  • Europe
    • Germany
    • France
    • The U.K.
    • Italy
    • Spain
    • Rest of Europe
  • Asia Pacific
    • China
    • Japan
    • India
    • South Korea
    • South-east Asia
    • Rest of Asia Pacific
  • Latin America
    • Brazil
    • Argentina
    • Rest of Latin America
  • Middle East & Africa
    • GCC Countries
    • South Africa

1. Preface
1.1. Report Description
1.1.1. Purpose of the Report
1.1.2. Target Audience
1.1.3. USP and Key Offerings
1.2. Research Scope
1.3. Research Methodology
1.3.1. Phase I – Secondary Research
1.3.2. Phase II – Data Modelling
1.3.2.1. Company Share Analysis Model
1.3.2.2. Revenue Based Modelling
1.3.3. Phase III – Primary Research
1.3.4. Research Limitations
1.3.5. Assumptions
1.4. Market Introduction
1.5. Market Research Scope

2. Executive Summary
2.1. Market Snapshot: Global Sexual Health Supplements Market
2.2. Global Sexual Health Supplements Market, By Gender
2.3. Global Sexual Health Supplements Market, By Formulation
2.4. Global Sexual Health Supplements Market, By Distribution Channel
2.5. Global Sexual Health Supplements Market, By Product
2.6. Global Sexual Health Supplements Market, By Region

3. Market Dynamics & Factors Analysis
3.1. Introduction
3.1.1. Global Sexual Health Supplements Market Value, 2017-2030, (US$ Mn)
3.1.2. Y-o-Y Growth Trend Analysis
3.2. Market Dynamics
3.2.2. Market Restraints
3.2.3. Market Opportunities
3.2.4. Major Industry Challenges
3.3. Growth and Development Patterns
3.4. Investment Feasibility Analysis
3.5. Market Opportunity Analysis
3.5.1. Gender
3.5.2. Formulation
3.5.3. Distribution Channel
3.5.4. Geography

4. Premium Insights
4.1. STAR (Situation, Task, Action, Results) Analysis
4.2. Porter’s Five Forces Analysis
4.2.1. Threat of New Entrants
4.2.2. Bargaining Power of Buyers/Consumers
4.2.3. Bargaining Power of Suppliers
4.2.4. Threat of Substitute Genders
4.2.5. Intensity of Competitive Rivalry
4.3. Key Market Trends
4.3.1. Demand Side Trends
4.3.2. Supply Side Trends
4.4. Value Chain Analysis
4.5. Gender Analysis
4.6. Analysis and Recommendations
4.7. Marketing Strategy Analysis
4.7.1. Direct Marketing
4.7.2. Indirect Marketing
4.7.3. Marketing Channel Development Trend

5. Market Positioning of Key Players, 2022
5.1. Company market share of key players, 2022
5.2. Competitive Benchmarking
5.3. Market Positioning of Key Vendors
5.4. Geographical Presence Analysis
5.5. Major Strategies Adopted by Key Players
5.5.1. Key Strategies Analysis
5.5.2. Mergers and Acquisitions
5.5.3. Partnerships
5.5.4. Product Launch
5.5.5. Geographical Expansion
5.5.6. Others

6. Economic Impact Analysis
6.1. Recession Impact
6.1.1. North America
6.1.2. Europe
6.1.3. Asia Pacific
6.1.4. Latin America
6.1.5. Middle East and Africa
6.2. Ukraine-Russia War Impact
6.2.1. North America
6.2.2. Europe
6.2.3. Asia Pacific
6.2.4. Latin America
6.2.5. Middle East and Africa
6.3. COVID-19 Impact Analysis
6.3.1. North America
6.3.2. Europe
6.3.3. Asia Pacific
6.3.4. Latin America
6.3.5. Middle East and Africa

7. Global Sexual Health Supplements Market, By Gender
7.1. Global Sexual Health Supplements Market Overview, by Gender
7.1.1. Global Sexual Health Supplements Market Revenue Share, By Gender, 2022 Vs 2030 (in %)
7.2. Men
7.2.1. Global Sexual Health Supplements Market, By Region, 2017-2030 (US$ Mn)
7.3. Women
7.3.1. Global Sexual Health Supplements Market, By Region, 2017-2030 (US$ Mn)

8. Global Sexual Health Supplements Market, By Formulation
8.1. Global Sexual Health Supplements Market Overview, by Formulation
8.1.1. Global Sexual Health Supplements Market, By Formulation, 2022 vs 2030 (in %)
8.2. Capsules
8.2.1. Global Sexual Health Supplements Market, By Region, 2017-2030 (US$ Mn)
8.3. Cloud
8.3.1. Global Sexual Health Supplements Market, By Region, 2017-2030 (US$ Mn)
8.4. Softgel
8.4.1. Global Sexual Health Supplements Market, By Region, 2017-2030 (US$ Mn)
8.5. Liquid
8.5.1. Global Sexual Health Supplements Market, By Region, 2017-2030 (US$ Mn)
8.6. Powder
8.6.1. Global Sexual Health Supplements Market, By Region, 2017-2030 (US$ Mn)

9. Global Sexual Health Supplements Market, by Distribution Channel, 2017-2030 (US$ Mn)
9.1. Global Sexual Health Supplements Market Overview, by Distribution Channel
9.1.1. Global Sexual Health Supplements Market, By Distribution Channel, 2022 vs 2030 (in%)
9.2. Offline Store
9.2.1. Global Sexual Health Supplements Market, By Region, 2017-2030 (US$ Mn)
9.3. Online Store
9.3.1. Global Sexual Health Supplements Market, By Region, 2017-2030 (US$ Mn)

10. Global Sexual Health Supplements Market, By Product
10.1. Global Sexual Health Supplements Market Overview, by Product
10.1.1. Global Sexual Health Supplements Market Revenue Share, By Product, 2022 Vs 2030 (in %)
10.2. NATURAL
10.2.1. Global Sexual Health Supplements Market, By Region, 2017-2030 (US$ Mn)
10.3. Synthetic & Blend
10.3.1. Global Sexual Health Supplements Market, By Region, 2017-2030 (US$ Mn)

11. Global Sexual Health Supplements Market, By Region
11.1. Global Sexual Health Supplements Market Overview, by Region
11.1.1. Global Sexual Health Supplements Market, By Region, 2022 vs 2030 (in%)
11.2. Gender
11.2.1. Global Sexual Health Supplements Market, By Gender, 2017-2030 (US$ Mn)
11.3. Formulation
11.3.1. Global Sexual Health Supplements Market, By Formulation, 2017-2030 (US$ Mn)
11.4. Distribution Channel
11.4.1. Global Sexual Health Supplements Market, By Distribution Channel, 2017-2030 (US$ Mn)
11.5. Product
11.5.1. Global Sexual Health Supplements Market, By Distribution Channel, 2017-2030 (US$ Mn)

12. North America Sexual Health Supplements Market Analysis
12.1. North America Sexual Health Supplements Market, by Gender, 2017-2030(US$ Mn)
12.1.1. Overview
12.1.2. SRC Analysis
12.2. North America Sexual Health Supplements Market, by Formulation, 2017-2030(US$ Mn)
12.2.1. Overview
12.2.2. SRC Analysis
12.3. North America Sexual Health Supplements Market, by Distribution Channel, 2017-2030(US$ Mn)
12.3.1. Overview
12.3.2. SRC Analysis
12.4. North America Sexual Health Supplements Market, by Product, 2017-2030(US$ Mn)
12.4.1. Overview
12.4.2. SRC Analysis
12.5. North America Sexual Health Supplements Market, by Country, 2017-2030 (US$ Mn)
12.5.1. North America Sexual Health Supplements Market, by Country, 2022 Vs 2030 (in%)
12.5.2. U.S.
12.5.2.1. U.S. Sexual Health Supplements Market Estimates and Forecast, 2017-2030 (US$ Mn)
12.5.2.2. U.S. Sexual Health Supplements, By Gender, 2017-2030 (US$ Mn)
12.5.2.3. U.S. Sexual Health Supplements, By Formulation, 2017-2030 (US$ Mn)
12.5.2.4. U.S. Sexual Health Supplements, By Distribution Channel, 2017-2030 (US$ Mn)
12.5.2.5. U.S. Sexual Health Supplements, By Product, 2017-2030 (US$ Mn)
12.5.3. Canada
12.5.3.1. Canada Sexual Health Supplements Market Estimates and Forecast, 2017-2030 (US$ Mn)
12.5.3.2. Canada Sexual Health Supplements, By Gender, 2017-2030 (US$ Mn)
12.5.3.3. Canada Sexual Health Supplements, By Formulation, 2017-2030 (US$ Mn)
12.5.3.4. Canada Sexual Health Supplements, By Distribution Channel, 2017-2030 (US$ Mn)
12.5.3.5. Canada Sexual Health Supplements, By Product, 2017-2030 (US$ Mn)
12.5.4. Mexico
12.5.4.1. Mexico Sexual Health Supplements Market Estimates and Forecast, 2017-2030 (US$ Mn)
12.5.4.2. Mexico Sexual Health Supplements, By Gender, 2017-2030 (US$ Mn)
12.5.4.3. Mexico Sexual Health Supplements, By Formulation, 2017-2030 (US$ Mn)
12.5.4.4. Mexico Sexual Health Supplements, By Distribution Channel, 2017-2030 (US$ Mn)
12.5.4.5. Mexico Sexual Health Supplements, By Product, 2017-2030 (US$ Mn)

13. Europe Sexual Health Supplements Market Analysis
13.1. Europe Sexual Health Supplements Market, by Gender, 2017-2030(US$ Mn)
13.1.1. Overview
13.1.2. SRC Analysis
13.2. Europe Sexual Health Supplements Market, by Formulation, 2017-2030(US$ Mn)
13.2.1. Overview
13.2.2. SRC Analysis
13.3. Europe Sexual Health Supplements Market, by Distribution Channel, 2017-2030(US$ Mn)
13.3.1. Overview
13.3.2. SRC Analysis
13.4. Europe Sexual Health Supplements Market, by Product, 2017-2030(US$ Mn)
13.4.1. Overview
13.4.2. SRC Analysis
13.5. Europe Sexual Health Supplements Market, by Country, 2017-2030 (US$ Mn)
13.5.1. Europe Sexual Health Supplements Market, by Country, 2022 Vs 2030 (in%)
13.5.2. Germany
13.5.2.1. Germany Sexual Health Supplements Market Estimates and Forecast, 2017-2030 (US$ Mn)
13.5.2.2. Germany Sexual Health Supplements, By Gender, 2017-2030 (US$ Mn)
13.5.2.3. Germany Sexual Health Supplements, By Formulation, 2017-2030 (US$ Mn)
13.5.2.4. Germany Sexual Health Supplements, By Distribution Channel, 2017-2030 (US$ Mn)
13.5.2.5. Germany Sexual Health Supplements, By Product, 2017-2030 (US$ Mn)
13.5.3. France
13.5.3.1. France Sexual Health Supplements Market Estimates and Forecast, 2017-2030 (US$ Mn)
13.5.3.2. France Sexual Health Supplements, By Gender, 2017-2030 (US$ Mn)
13.5.3.3. France Sexual Health Supplements, By Formulation, 2017-2030 (US$ Mn)
13.5.3.4. France Sexual Health Supplements, By Distribution Channel, 2017-2030 (US$ Mn)
13.5.3.5. France Sexual Health Supplements, By Product, 2017-2030 (US$ Mn)
13.5.4. UK
13.5.4.1. UK Sexual Health Supplements Market Estimates and Forecast, 2017-2030 (US$ Mn)
13.5.4.2. UK Sexual Health Supplements, By Gender, 2017-2030 (US$ Mn)
13.5.4.3. UK Sexual Health Supplements, By Formulation, 2017-2030 (US$ Mn)
13.5.4.4. UK Sexual Health Supplements, By Distribution Channel, 2017-2030 (US$ Mn)
13.5.4.5. UK Sexual Health Supplements, By Product, 2017-2030 (US$ Mn)
13.5.5. Italy
13.5.5.1. Italy Sexual Health Supplements Market Estimates and Forecast, 2017-2030 (US$ Mn)
13.5.5.2. Italy Sexual Health Supplements, By Gender, 2017-2030 (US$ Mn)
13.5.5.3. Italy Sexual Health Supplements, By Formulation, 2017-2030 (US$ Mn)
13.5.5.4. Italy Sexual Health Supplements, By Distribution Channel, 2017-2030 (US$ Mn)
13.5.5.5. Italy Sexual Health Supplements, By Product, 2017-2030 (US$ Mn)
13.5.6. Spain
13.5.6.1. Spain Sexual Health Supplements Market Estimates and Forecast, 2017-2030 (US$ Mn)
13.5.6.2. Spain Sexual Health Supplements, By Gender, 2017-2030 (US$ Mn)
13.5.6.3. Spain Sexual Health Supplements, By Formulation, 2017-2030 (US$ Mn)
13.5.6.4. Spain Sexual Health Supplements, By Distribution Channel, 2017-2030 (US$ Mn)
13.5.6.5. Spain Sexual Health Supplements, By Product, 2017-2030 (US$ Mn)
13.5.7. Rest of Europe
13.5.7.1. Rest of Europe Sexual Health Supplements Market Estimates and Forecast, 2017-2030 (US$ Mn)
13.5.7.2. Rest of Europe Sexual Health Supplements, By Gender, 2017-2030 (US$ Mn)
13.5.7.3. Rest of Europe Sexual Health Supplements, By Formulation, 2017-2030 (US$ Mn)
13.5.7.4. Rest of Europe Sexual Health Supplements, By Distribution Channel, 2017-2030 (US$ Mn)
13.5.7.5. Rest of Europe Sexual Health Supplements, By Product, 2017-2030 (US$ Mn)

14. Asia Pacific Sexual Health Supplements Market Analysis
14.1. Asia Pacific Sexual Health Supplements Market, by Gender, 2017-2030(US$ Mn)
14.1.1. Overview
14.1.2. SRC Analysis
14.2. Asia Pacific Sexual Health Supplements Market, by Formulation, 2017-2030(US$ Mn)
14.2.1. Overview
14.2.2. SRC Analysis
14.3. Asia Pacific Sexual Health Supplements Market, by Distribution Channel, 2017-2030(US$ Mn)
14.3.1. Overview
14.3.2. SRC Analysis
14.4. Asia Pacific Sexual Health Supplements Market, by Product, 2017-2030(US$ Mn)
14.4.1. Overview
14.4.2. SRC Analysis
14.5. Asia Pacific Sexual Health Supplements Market, by Country, 2017-2030 (US$ Mn)
14.5.1. Asia Pacific Sexual Health Supplements Market, by Country, 2022 Vs 2030 (in%)
14.5.2. China
14.5.2.1. China Sexual Health Supplements Market Estimates and Forecast, 2017-2030 (US$ Mn)
14.5.2.2. China Sexual Health Supplements, By Gender, 2017-2030 (US$ Mn)
14.5.2.3. China Sexual Health Supplements, By Formulation, 2017-2030 (US$ Mn)
14.5.2.4. China Sexual Health Supplements, By Distribution Channel, 2017-2030 (US$ Mn)
14.5.2.5. China Sexual Health Supplements, By Product, 2017-2030 (US$ Mn)
14.5.3. Japan
14.5.3.1. Japan Sexual Health Supplements Market Estimates and Forecast, 2017-2030 (US$ Mn)
14.5.3.2. Japan Sexual Health Supplements, By Gender, 2017-2030 (US$ Mn)
14.5.3.3. Japan Sexual Health Supplements, By Formulation, 2017-2030 (US$ Mn)
14.5.3.4. Japan Sexual Health Supplements, By Distribution Channel, 2017-2030 (US$ Mn)
14.5.3.5. Japan Sexual Health Supplements, By Product, 2017-2030 (US$ Mn)
14.5.4. India
14.5.4.1. India Sexual Health Supplements Market Estimates and Forecast, 2017-2030 (US$ Mn)
14.5.4.2. India Sexual Health Supplements, By Gender, 2017-2030 (US$ Mn)
14.5.4.3. India Sexual Health Supplements, By Formulation, 2017-2030 (US$ Mn)
14.5.4.4. India Sexual Health Supplements, By Distribution Channel, 2017-2030 (US$ Mn)
14.5.4.5. India Sexual Health Supplements, By Product, 2017-2030 (US$ Mn)
14.5.5. South Korea
14.5.5.1. South Korea Sexual Health Supplements Market Estimates and Forecast, 2017-2030 (US$ Mn)
14.5.5.2. South Korea Sexual Health Supplements, By Gender, 2017-2030 (US$ Mn)
14.5.5.3. South Korea Sexual Health Supplements, By Formulation, 2017-2030 (US$ Mn)
14.5.5.4. South Korea Sexual Health Supplements, By Distribution Channel, 2017-2030 (US$ Mn)
14.5.5.5. South Korea Sexual Health Supplements, By Product, 2017-2030 (US$ Mn)
14.5.6. South-East Asia
14.5.6.1. South-East Asia Sexual Health Supplements Market Estimates and Forecast, 2017-2030 (US$ Mn)
14.5.6.2. South-East Asia Sexual Health Supplements, By Gender, 2017-2030 (US$ Mn)
14.5.6.3. South-East Asia Sexual Health Supplements, By Formulation, 2017-2030 (US$ Mn)
14.5.6.4. South-East Asia Sexual Health Supplements, By Distribution Channel, 2017-2030 (US$ Mn)
14.5.6.5. South East Asia Sexual Health Supplements, By Product, 2017-2030 (US$ Mn)
14.5.7. Rest of Asia Pacific
14.5.7.1. Rest of Asia Pacific Sexual Health Supplements Market Estimates and Forecast, 2017-2030 (US$ Mn)
14.5.7.2. Rest of Asia Pacific Sexual Health Supplements, By Gender, 2017-2030 (US$ Mn)
14.5.7.3. Rest of Asia Pacific Sexual Health Supplements, By Formulation, 2017-2030 (US$ Mn)
14.5.7.4. Rest of Asia Pacific Sexual Health Supplements, By Distribution Channel, 2017-2030 (US$ Mn)
14.5.7.5. Rest of Asia Pacific Sexual Health Supplements, By Product, 2017-2030 (US$ Mn)

15. Latin America Sexual Health Supplements Market Analysis
15.1. Latin America Sexual Health Supplements Market, by Gender, 2017-2030(US$ Mn)
15.1.1. Overview
15.1.2. SRC Analysis
15.2. Latin America Sexual Health Supplements Market, by Formulation, 2017-2030(US$ Mn)
15.2.1. Overview
15.2.2. SRC Analysis
15.3. Latin America Sexual Health Supplements Market, by Distribution Channel, 2017-2030(US$ Mn)
15.3.1. Overview
15.3.2. SRC Analysis
15.4. Latin America Sexual Health Supplements Market, by Product, 2017-2030(US$ Mn)
15.4.1. Overview
15.4.2. SRC Analysis
15.5. Latin America Sexual Health Supplements Market, by Country, 2017-2030 (US$ Mn)
15.5.1. Latin America Sexual Health Supplements Market, by Country, 2022 Vs 2030 (in%)
15.5.2. Brazil
15.5.2.1. Brazil Sexual Health Supplements Market Estimates and Forecast, 2017-2030 (US$ Mn)
15.5.2.2. Brazil Sexual Health Supplements, By Gender, 2017-2030 (US$ Mn)
15.5.2.3. Brazil Sexual Health Supplements, By Formulation, 2017-2030 (US$ Mn)
15.5.2.4. Brazil Sexual Health Supplements, By Distribution Channel, 2017-2030 (US$ Mn)
15.5.2.5. Brazil Sexual Health Supplements, By Product, 2017-2030 (US$ Mn)
15.5.3. Argentina
15.5.3.1. Argentina Sexual Health Supplements Market Estimates and Forecast, 2017-2030 (US$ Mn)
15.5.3.2. Argentina Sexual Health Supplements, By Gender, 2017-2030 (US$ Mn)
15.5.3.3. Argentina Sexual Health Supplements, By Formulation, 2017-2030 (US$ Mn)
15.5.3.4. Argentina Sexual Health Supplements, By Distribution Channel, 2017-2030 (US$ Mn)
15.5.3.5. Argentina Sexual Health Supplements, By Product, 2017-2030 (US$ Mn)
15.5.4. Rest of Latin America
15.5.4.1. Rest of Latin America Sexual Health Supplements Market Estimates and Forecast, 2017-2030 (US$ Mn)
15.5.4.2. Rest of Latin America Sexual Health Supplements, By Gender, 2017-2030 (US$ Mn)
15.5.4.3. Rest of Latin America Sexual Health Supplements, By Formulation, 2017-2030 (US$ Mn)
15.5.4.4. Rest of Latin America Sexual Health Supplements, By Distribution Channel, 2017-2030 (US$ Mn)
15.5.4.5. Rest of Latin America Sexual Health Supplements, By Product, 2017-2030 (US$ Mn)

16. Middle East and Africa Sexual Health Supplements Market Analysis
16.1. Middle East and Africa Sexual Health Supplements Market, by Gender, 2017-2030(US$ Mn)
16.1.1. Overview
16.1.2. SRC Analysis
16.2. Middle East and Africa Sexual Health Supplements Market, by Formulation, 2017-2030(US$ Mn)
16.2.1. Overview
16.2.2. SRC Analysis
16.3. Middle East and Africa Sexual Health Supplements Market, by Distribution Channel, 2017-2030(US$ Mn)
16.3.1. Overview
16.3.2. SRC Analysis
16.4. Middle East and Africa Sexual Health Supplements Market, by Product, 2017-2030(US$ Mn)
16.4.1. Overview
16.4.2. SRC Analysis
16.5. Middle East and Africa Sexual Health Supplements Market, by Country, 2017-2030 (US$ Mn)
16.5.1. Middle East and Africa Sexual Health Supplements Market, by Country, 2022 Vs 2030 (in%)
16.5.2. GCC Countries
16.5.2.1. GCC Countries Sexual Health Supplements Market Estimates and Forecast, 2017-2030 (US$ Mn)
16.5.2.2. GCC Countries Sexual Health Supplements, By Gender, 2017-2030 (US$ Mn)
16.5.2.3. GCC Countries Sexual Health Supplements, By Formulation, 2017-2030 (US$ Mn)
16.5.2.4. GCC Countries Sexual Health Supplements, By Distribution Channel, 2017-2030 (US$ Mn)
16.5.2.5. GCC Countries Sexual Health Supplements, By Product, 2017-2030 (US$ Mn)
16.5.3. South Africa
16.5.3.1. South Africa Sexual Health Supplements Market Estimates and Forecast, 2017-2030 (US$ Mn)
16.5.3.2. South Africa Sexual Health Supplements, By Gender, 2017-2030 (US$ Mn)
16.5.3.3. South Africa Sexual Health Supplements, By Formulation, 2017-2030 (US$ Mn)
16.5.3.4. South Africa Sexual Health Supplements, By Distribution Channel, 2017-2030 (US$ Mn)
16.5.3.5. South Africa Sexual Health Supplements, By Product, 2017-2030 (US$ Mn)
16.5.4. Rest of Middle East and Africa
16.5.4.1. Rest of Middle East and Africa Sexual Health Supplements Market Estimates and Forecast, 2017-2030 (US$ Mn)
16.5.4.2. Rest of Middle East and Africa Sexual Health Supplements, By Gender, 2017-2030 (US$ Mn)
16.5.4.3. Rest of Middle East and Africa Sexual Health Supplements, By Formulation, 2017-2030 (US$ Mn)
16.5.4.4. Rest of Middle East and Africa Sexual Health Supplements, By Distribution Channel, 2017-2030 (US$ Mn)
16.5.4.5. Rest of Middle East and Africa Sexual Health Supplements, By Product, 2017-2030 (US$ Mn)

17. Company Profiles
17.1. Ambic Ayurved India Pvt. Ltd.
17.1.1. Company Overview
17.1.2. Products/Womens Portfolio
17.1.3. Geographical Presence
17.1.4. Financial Summary
17.1.4.1. Market Revenue and Net Profit (2019-2022)
17.1.4.2. Business Segment Revenue Analysis
17.1.4.3. Geographical Revenue Analysis
17.2. Aytu BioPharma Inc.
17.3. BioFilm Inc.
17.4. Church and Dwight Co. Inc.
17.5. Cyanotech Corp.
17.6. Dabur India Ltd.
17.7. Doc Johnson Enterprises
17.8. GNC Holdings LLC
17.9. Good Clean Love Inc.
17.10. Herbalife International of America Inc.
17.11. Hi Tech Pharmaceuticals Inc.
17.12. Himalaya Global Holdings Ltd.
17.13. Leading Edge Health Inc.
17.14. Lovehoney Group Ltd.

List of Figures
FIG. 1 Global Sexual Health Supplements Market: Research Methodology
FIG. 2 Market Size Estimation – Top Down & Bottom up Approach
FIG. 3 Global Sexual Health Supplements Market Segmentation
FIG. 4 Global Sexual Health Supplements Market, by Gender, 2022 (US$ Mn)
FIG. 5 Global Sexual Health Supplements Market, by Formulation, 2022 (US$ Mn)
FIG. 6 Global Sexual Health Supplements Market, by Distribution Channel, 2022 (US$ Mn)
FIG. 7 Global Sexual Health Supplements Market, by Product, 2022 (US$ Mn)
FIG. 8 Global Sexual Health Supplements Market, by Geography, 2022 (US$ Mn)
FIG. 9 Attractive Investment Proposition, by Gender, 2022
FIG. 10 Attractive Investment Proposition, by Formulation, 2022
FIG. 11 Attractive Investment Proposition, by Distribution Channel, 2022
FIG. 12 Attractive Investment Proposition, by Product, 2022
FIG. 13 Attractive Investment Proposition, by Geography, 2022
FIG. 14 Global Market Share Analysis of Key Sexual Health Supplements Market Manufacturers, 2022
FIG. 15 Global Market Positioning of Key Sexual Health Supplements Market Manufacturers, 2022
FIG. 16 Global Sexual Health Supplements Market Value Contribution, By Gender, 2022 & 2030 (Value %)
FIG. 17 Global Sexual Health Supplements Market, by Men, Value, 2017-2030 (US$ Mn)
FIG. 18 Global Sexual Health Supplements Market, by Women, Value, 2017-2030 (US$ Mn)
FIG. 19 Global Sexual Health Supplements Market Value Contribution, By Formulation, 2022 & 2030 (Value %)
FIG. 20 Global Sexual Health Supplements Market, by Capsules, Value, 2017-2030 (US$ Mn)
FIG. 21 Global Sexual Health Supplements Market, by Tablets, 2017-2030 (US$ Mn)
FIG. 22 Global Sexual Health Supplements Market, by Softgel, 2017-2030 (US$ Mn)
FIG. 23 Global Sexual Health Supplements Market, by Liquid, 2017-2030 (US$ Mn)
FIG. 24 Global Sexual Health Supplements Market, by Powder, 2017-2030 (US$ Mn)
FIG. 25 Global Sexual Health Supplements Market Value Contribution, By Distribution Channel, 2022 & 2030 (Value %)
FIG. 26 Global Sexual Health Supplements Market, by Offline Store, Value, 2017-2030 (US$ Mn)
FIG. 27 Global Sexual Health Supplements Market, by Online Store, 2017-2030 (US$ Mn)
FIG. 28 Global Sexual Health Supplements Market Value Contribution, By Product, 2022 & 2030 (Value %)
FIG. 29 Global Sexual Health Supplements Market, by NATURAL, Value, 2017-2030 (US$ Mn)
FIG. 30 Global Sexual Health Supplements Market, by Synthetic & Blend, 2017-2030 (US$ Mn)
FIG. 31 North America Sexual Health Supplements Market, 2017-2030 (US$ Mn)
FIG. 32 U.S. Sexual Health Supplements Market, 2017-2030 (US$ Mn)
FIG. 33 Canada Sexual Health Supplements Market, 2017-2030 (US$ Mn)
FIG. 34 Europe Sexual Health Supplements Market, 2017-2030 (US$ Mn)
FIG. 35 Germany Sexual Health Supplements Market, 2017-2030 (US$ Mn)
FIG. 36 France Sexual Health Supplements Market, 2017-2030 (US$ Mn)
FIG. 37 U.K. Sexual Health Supplements Market, 2017-2030 (US$ Mn)
FIG. 38 Italy Sexual Health Supplements Market, 2017-2030 (US$ Mn)
FIG. 39 Spain Sexual Health Supplements Market, 2017-2030 (US$ Mn)
FIG. 40 Rest of Europe Sexual Health Supplements Market, 2017-2030 (US$ Mn)
FIG. 41 Asia Pacific Sexual Health Supplements Market, 2017-2030 (US$ Mn)
FIG. 42 China Sexual Health Supplements Market, 2017-2030 (US$ Mn)
FIG. 43 Japan Sexual Health Supplements Market, 2017-2030 (US$ Mn)
FIG. 44 India Sexual Health Supplements Market, 2017-2030 (US$ Mn)
FIG. 45 South Korea Sexual Health Supplements Market, 2017-2030 (US$ Mn)
FIG. 46 South-East Asia Sexual Health Supplements Market, 2017-2030 (US$ Mn)
FIG. 47 Rest of Asia Pacific Sexual Health Supplements Market, 2017-2030 (US$ Mn)
FIG. 48 Latin America Sexual Health Supplements Market, 2017-2030 (US$ Mn)
FIG. 49 Brazil Sexual Health Supplements Market, 2017-2030 (US$ Mn)
FIG. 50 Mexico Sexual Health Supplements Market, 2017-2030 (US$ Mn)
FIG. 51 Rest of Latin America Sexual Health Supplements Market, 2017-2030 (US$ Mn)
FIG. 52 Middle East & Africa Sexual Health Supplements Market, 2017-2030 (US$ Mn)
FIG. 53 GCC Countries Sexual Health Supplements Market, 2017-2030 (US$ Mn)
FIG. 54 South Africa Sexual Health Supplements Market, 2017-2030 (US$ Mn)
FIG. 55 Rest of Middle East and Africa Sexual Health Supplements Market, 2017-2030 (US$ Mn)

List of Tables
TABLE 1 Market Snapshot: Global Sexual Health Supplements Market
TABLE 2 Global Sexual Health Supplements Market: Market Drivers Impact Analysis
TABLE 3 Global Sexual Health Supplements Market: Market Restraints Impact Analysis
TABLE 4 Global Sexual Health Supplements Market, by Competitive Benchmarking, 2022
TABLE 5 Global Sexual Health Supplements Market, by Geographical Presence Analysis, 2022
TABLE 6 Global Sexual Health Supplements Market, by Key Strategies Analysis, 2022
TABLE 7 Global Sexual Health Supplements Market, by Men, By Region, 2017-2022 (US$ Mn)
TABLE 8 Global Sexual Health Supplements Market, by Men, By Region, 2023-2030 (US$ Mn)
TABLE 9 Global Sexual Health Supplements Market, by Women, By Region, 2017-2022 (US$ Mn)
TABLE 10 Global Sexual Health Supplements Market, by Women, By Region, 2023-2030 (US$ Mn)
TABLE 11 Global Sexual Health Supplements Market, by Capsules, By Region, 2017-2022 (US$ Mn)
TABLE 12 Global Sexual Health Supplements Market, by Capsules, By Region, 2023-2030 (US$ Mn)
TABLE 13 Global Sexual Health Supplements Market, by Tablets, By Region, 2017-2022 (US$ Mn)
TABLE 14 Global Sexual Health Supplements Market, by Tablets, By Region, 2023-2030 (US$ Mn)
TABLE 15 Global Sexual Health Supplements Market, by Softgel, By Region, 2017-2022 (US$ Mn)
TABLE 16 Global Sexual Health Supplements Market, by Softgel, By Region, 2023-2030 (US$ Mn)
TABLE 17 Global Sexual Health Supplements Market, by Liquid, By Region, 2017-2022 (US$ Mn)
TABLE 18 Global Sexual Health Supplements Market, by Liquid, By Region, 2023-2030 (US$ Mn)
TABLE 19 Global Sexual Health Supplements Market, by Powder, By Region, 2017-2022 (US$ Mn)
TABLE 20 Global Sexual Health Supplements Market, by Powder, By Region, 2023-2030 (US$ Mn)
TABLE 21 Global Sexual Health Supplements Market, by Offline Store, By Region, 2017-2022 (US$ Mn)
TABLE 22 Global Sexual Health Supplements Market, by Offline Store, By Region, 2023-2030 (US$ Mn)
TABLE 23 Global Sexual Health Supplements Market, by Online Store, By Region, 2017-2022 (US$ Mn)
TABLE 24 Global Sexual Health Supplements Market, by Online Store, By Region, 2023-2030 (US$ Mn)
TABLE 25 Global Sexual Health Supplements Market, by NATURAL, By Region, 2017-2022 (US$ Mn)
TABLE 26 Global Sexual Health Supplements Market, by NATURAL, By Region, 2023-2030 (US$ Mn)
TABLE 27 Global Sexual Health Supplements Market, by Synthetic & Blend, By Region, 2017-2022 (US$ Mn)
TABLE 28 Global Sexual Health Supplements Market, by Synthetic & Blend, By Region, 2023-2030 (US$ Mn)
TABLE 29 Global Sexual Health Supplements Market, by Gender, 2017-2022 (US$ Mn)
TABLE 30 Global Sexual Health Supplements Market, by Gender, 2023-2030 (US$ Mn)
TABLE 31 Global Sexual Health Supplements Market, by Formulation, 2017-2022 (US$ Mn)
TABLE 32 Global Sexual Health Supplements Market, by Formulation, 2023-2030 (US$ Mn)
TABLE 33 Global Sexual Health Supplements Market, by Distribution Channel, 2017-2022 (US$ Mn)
TABLE 34 Global Sexual Health Supplements Market, by Distribution Channel, 2023-2030 (US$ Mn)
TABLE 35 Global Sexual Health Supplements Market, by Product, 2017-2022 (US$ Mn)
TABLE 36 Global Sexual Health Supplements Market, by Product, 2023-2030 (US$ Mn)
TABLE 37 Global Sexual Health Supplements Market, by Region, 2017-2022 (US$ Mn)
TABLE 38 Global Sexual Health Supplements Market, by Region, 2023-2030 (US$ Mn)
TABLE 39 North America Sexual Health Supplements Market, by Gender, 2017-2022 (US$ Mn)
TABLE 40 North America Sexual Health Supplements Market, by Gender, 2023-2030 (US$ Mn)
TABLE 41 North America Sexual Health Supplements Market, by Formulation, 2017-2022 (US$ Mn)
TABLE 42 North America Sexual Health Supplements Market, by Formulation, 2023-2030 (US$ Mn)
TABLE 43 North America Sexual Health Supplements Market, by Distribution Channel, 2017-2022 (US$ Mn)
TABLE 44 North America Sexual Health Supplements Market, by Distribution Channel, 2023-2030 (US$ Mn)
TABLE 45 North America Sexual Health Supplements Market, by Product, 2017-2022 (US$ Mn)
TABLE 46 North America Sexual Health Supplements Market, by Product, 2023-2030 (US$ Mn)
TABLE 47 North America Sexual Health Supplements Market, by Country, 2017-2022 (US$ Mn)
TABLE 48 North America Sexual Health Supplements Market, by Country, 2023-2030 (US$ Mn)
TABLE 49 United States Sexual Health Supplements Market, by Gender, 2017-2022 (US$ Mn)
TABLE 50 United States Sexual Health Supplements Market, by Gender, 2023-2030 (US$ Mn)
TABLE 51 United States Sexual Health Supplements Market, by Formulation, 2017-2022 (US$ Mn)
TABLE 52 United States Sexual Health Supplements Market, by Formulation, 2023-2030 (US$ Mn)
TABLE 53 United States Sexual Health Supplements Market, by Distribution Channel, 2017-2022 (US$ Mn)
TABLE 54 United States Sexual Health Supplements Market, by Distribution Channel, 2023-2030 (US$ Mn)
TABLE 55 United States Sexual Health Supplements Market, by Product, 2017-2022 (US$ Mn)
TABLE 56 United States Sexual Health Supplements Market, by Product, 2023-2030 (US$ Mn)
TABLE 57 Canada Sexual Health Supplements Market, by Gender, 2017-2022 (US$ Mn)
TABLE 58 Canada Sexual Health Supplements Market, by Gender, 2023-2030 (US$ Mn)
TABLE 59 Canada Sexual Health Supplements Market, by Formulation, 2017-2022 (US$ Mn)
TABLE 60 Canada Sexual Health Supplements Market, by Formulation, 2023-2030 (US$ Mn)
TABLE 61 Canada Sexual Health Supplements Market, by Distribution Channel, 2017-2022 (US$ Mn)
TABLE 62 Canada Sexual Health Supplements Market, by Distribution Channel, 2023-2030 (US$ Mn)
TABLE 63 Canada Sexual Health Supplements Market, by Product, 2017-2022 (US$ Mn)
TABLE 64 Canada Sexual Health Supplements Market, by Product, 2023-2030 (US$ Mn)
TABLE 65 Mexico Sexual Health Supplements Market, by Gender, 2017-2022 (US$ Mn)
TABLE 66 Mexico Sexual Health Supplements Market, by Gender, 2023-2030 (US$ Mn)
TABLE 67 Mexico Sexual Health Supplements Market, by Formulation, 2017-2022 (US$ Mn)
TABLE 68 Mexico Sexual Health Supplements Market, by Formulation, 2023-2030 (US$ Mn)
TABLE 69 Mexico Sexual Health Supplements Market, by Distribution Channel, 2017-2022 (US$ Mn)
TABLE 70 Mexico Sexual Health Supplements Market, by Distribution Channel, 2023-2030 (US$ Mn)
TABLE 71 Mexico Sexual Health Supplements Market, by Product, 2017-2022 (US$ Mn)
TABLE 72 Mexico Sexual Health Supplements Market, by Product, 2023-2030 (US$ Mn)
TABLE 73 Europe Sexual Health Supplements Market, by Gender, 2017-2022 (US$ Mn)
TABLE 74 Europe Sexual Health Supplements Market, by Gender, 2023-2030 (US$ Mn)
TABLE 75 Europe Sexual Health Supplements Market, by Formulation, 2017-2022 (US$ Mn)
TABLE 76 Europe Sexual Health Supplements Market, by Formulation, 2023-2030 (US$ Mn)
TABLE 77 Europe Sexual Health Supplements Market, by Distribution Channel, 2017-2022 (US$ Mn)
TABLE 78 Europe Sexual Health Supplements Market, by Distribution Channel, 2023-2030 (US$ Mn)
TABLE 79 Europe Sexual Health Supplements Market, by Product, 2017-2022 (US$ Mn)
TABLE 80 Europe Sexual Health Supplements Market, by Product, 2023-2030 (US$ Mn)
TABLE 81 Europe Sexual Health Supplements Market, by Country, 2017-2022 (US$ Mn)
TABLE 82 Europe Sexual Health Supplements Market, by Country, 2023-2030 (US$ Mn)
TABLE 83 Germany Sexual Health Supplements Market, by Gender, 2017-2022 (US$ Mn)
TABLE 84 Germany Sexual Health Supplements Market, by Gender, 2023-2030 (US$ Mn)
TABLE 85 Germany Sexual Health Supplements Market, by Formulation, 2017-2022 (US$ Mn)
TABLE 86 Germany Sexual Health Supplements Market, by Formulation, 2023-2030 (US$ Mn)
TABLE 87 Germany Sexual Health Supplements Market, by Distribution Channel, 2017-2022 (US$ Mn)
TABLE 88 Germany Sexual Health Supplements Market, by Distribution Channel, 2023-2030 (US$ Mn)
TABLE 89 Germany Sexual Health Supplements Market, by Product, 2017-2022 (US$ Mn)
TABLE 90 Germany Sexual Health Supplements Market, by Product, 2023-2030 (US$ Mn)
TABLE 91 France Sexual Health Supplements Market, by Gender, 2017-2022 (US$ Mn)
TABLE 92 France Sexual Health Supplements Market, by Gender, 2023-2030 (US$ Mn)
TABLE 93 France Sexual Health Supplements Market, by Formulation, 2017-2022 (US$ Mn)
TABLE 94 France Sexual Health Supplements Market, by Formulation, 2023-2030 (US$ Mn)
TABLE 95 France Sexual Health Supplements Market, by Distribution Channel, 2017-2022 (US$ Mn)
TABLE 96 France Sexual Health Supplements Market, by Distribution Channel, 2023-2030 (US$ Mn)
TABLE 97 France Sexual Health Supplements Market, by Product, 2017-2022 (US$ Mn)
TABLE 98 France Sexual Health Supplements Market, by Product, 2023-2030 (US$ Mn)
TABLE 99 United Kingdom Sexual Health Supplements Market, by Gender, 2017-2022 (US$ Mn)
TABLE 100 United Kingdom Sexual Health Supplements Market, by Gender, 2023-2030 (US$ Mn)
TABLE 101 United Kingdom Sexual Health Supplements Market, by Formulation, 2017-2022 (US$ Mn)
TABLE 102 United Kingdom Sexual Health Supplements Market, by Formulation, 2023-2030 (US$ Mn)
TABLE 103 United Kingdom Sexual Health Supplements Market, by Distribution Channel, 2017-2022 (US$ Mn)
TABLE 104 United Kingdom Sexual Health Supplements Market, by Distribution Channel, 2023-2030 (US$ Mn)
TABLE 105 United Kingdom Sexual Health Supplements Market, by Product, 2017-2022 (US$ Mn)
TABLE 106 United Kingdom Sexual Health Supplements Market, by Product, 2023-2030 (US$ Mn)
TABLE 107 Italy Sexual Health Supplements Market, by Gender, 2017-2022 (US$ Mn)
TABLE 108 Italy Sexual Health Supplements Market, by Gender, 2023-2030 (US$ Mn)
TABLE 109 Italy Sexual Health Supplements Market, by Formulation, 2017-2022 (US$ Mn)
TABLE 110 Italy Sexual Health Supplements Market, by Formulation, 2023-2030 (US$ Mn)
TABLE 111 Italy Sexual Health Supplements Market, by Distribution Channel, 2017-2022 (US$ Mn)
TABLE 112 Italy Sexual Health Supplements Market, by Distribution Channel, 2023-2030 (US$ Mn)
TABLE 113 Italy Sexual Health Supplements Market, by Product, 2017-2022 (US$ Mn)
TABLE 114 Italy Sexual Health Supplements Market, by Product, 2023-2030 (US$ Mn)
TABLE 115 Spain Sexual Health Supplements Market, by Gender, 2017-2022 (US$ Mn)
TABLE 116 Spain Sexual Health Supplements Market, by Gender, 2023-2030 (US$ Mn)
TABLE 117 Spain Sexual Health Supplements Market, by Formulation, 2017-2022 (US$ Mn)
TABLE 118 Spain Sexual Health Supplements Market, by Formulation, 2023-2030 (US$ Mn)
TABLE 119 Spain Sexual Health Supplements Market, by Distribution Channel, 2017-2022 (US$ Mn)
TABLE 120 Spain Sexual Health Supplements Market, by Distribution Channel, 2023-2030 (US$ Mn)
TABLE 121 Spain Sexual Health Supplements Market, by Product, 2017-2022 (US$ Mn)
TABLE 122 Spain Sexual Health Supplements Market, by Product, 2023-2030 (US$ Mn)
TABLE 123 Rest of Europe Sexual Health Supplements Market, by Gender, 2017-2022 (US$ Mn)
TABLE 124 Rest of Europe Sexual Health Supplements Market, by Gender, 2023-2030 (US$ Mn)
TABLE 125 Rest of Europe Sexual Health Supplements Market, by Formulation, 2017-2022 (US$ Mn)
TABLE 126 Rest of Europe Sexual Health Supplements Market, by Formulation, 2023-2030 (US$ Mn)
TABLE 127 Rest of Europe Sexual Health Supplements Market, by Distribution Channel, 2017-2022 (US$ Mn)
TABLE 128 Rest of Europe Sexual Health Supplements Market, by Distribution Channel, 2023-2030 (US$ Mn)
TABLE 129 Rest of Europe Sexual Health Supplements Market, by Product, 2017-2022 (US$ Mn)
TABLE 130 Rest of Europe Sexual Health Supplements Market, by Product, 2023-2030 (US$ Mn)
TABLE 131 Asia Pacific Sexual Health Supplements Market, by Gender, 2017-2022 (US$ Mn)
TABLE 132 Asia Pacific Sexual Health Supplements Market, by Gender, 2023-2030 (US$ Mn)
TABLE 133 Asia Pacific Sexual Health Supplements Market, by Formulation, 2017-2022 (US$ Mn)
TABLE 134 Asia Pacific Sexual Health Supplements Market, by Formulation, 2023-2030 (US$ Mn)
TABLE 135 Asia Pacific Sexual Health Supplements Market, by Distribution Channel, 2017-2022 (US$ Mn)
TABLE 136 Asia Pacific Sexual Health Supplements Market, by Distribution Channel, 2023-2030 (US$ Mn)
TABLE 137 Asia Pacific Sexual Health Supplements Market, by Product, 2017-2022 (US$ Mn)
TABLE 138 Asia Pacific Sexual Health Supplements Market, by Product, 2023-2030 (US$ Mn)
TABLE 139 China Sexual Health Supplements Market, by Gender, 2017-2022 (US$ Mn)
TABLE 140 China Sexual Health Supplements Market, by Gender, 2023-2030 (US$ Mn)
TABLE 141 China Sexual Health Supplements Market, by Formulation, 2017-2022 (US$ Mn)
TABLE 142 China Sexual Health Supplements Market, by Formulation, 2023-2030 (US$ Mn)
TABLE 143 China Sexual Health Supplements Market, by Distribution Channel, 2017-2022 (US$ Mn)
TABLE 144 China Sexual Health Supplements Market, by Distribution Channel, 2023-2030 (US$ Mn)
TABLE 145 China Sexual Health Supplements Market, by Product, 2017-2022 (US$ Mn)
TABLE 146 China Sexual Health Supplements Market, by Product, 2023-2030 (US$ Mn)
TABLE 147 Japan Sexual Health Supplements Market, by Gender, 2017-2022 (US$ Mn)
TABLE 148 Japan Sexual Health Supplements Market, by Gender, 2023-2030 (US$ Mn)
TABLE 149 Japan Sexual Health Supplements Market, by Formulation, 2017-2022 (US$ Mn)
TABLE 150 Japan Sexual Health Supplements Market, by Formulation, 2023-2030 (US$ Mn)
TABLE 151 Japan Sexual Health Supplements Market, by Distribution Channel, 2017-2022 (US$ Mn)
TABLE 152 Japan Sexual Health Supplements Market, by Distribution Channel, 2023-2030 (US$ Mn)
TABLE 153 Japan Sexual Health Supplements Market, by Product, 2017-2022 (US$ Mn)
TABLE 154 Japan Sexual Health Supplements Market, by Product, 2023-2030 (US$ Mn)
TABLE 155 India Sexual Health Supplements Market, by Gender, 2017-2022 (US$ Mn)
TABLE 156 India Sexual Health Supplements Market, by Gender, 2023-2030 (US$ Mn)
TABLE 157 India Sexual Health Supplements Market, by Formulation, 2017-2022 (US$ Mn)
TABLE 158 India Sexual Health Supplements Market, by Formulation, 2023-2030 (US$ Mn)
TABLE 159 India Sexual Health Supplements Market, by Distribution Channel, 2017-2022 (US$ Mn)
TABLE 160 India Sexual Health Supplements Market, by Distribution Channel, 2023-2030 (US$ Mn)
TABLE 161 India Sexual Health Supplements Market, by Product, 2017-2022 (US$ Mn)
TABLE 162 India Sexual Health Supplements Market, by Product, 2023-2030 (US$ Mn)
TABLE 163 South Korea Sexual Health Supplements Market, by Gender, 2017-2022 (US$ Mn)
TABLE 164 South Korea Sexual Health Supplements Market, by Gender, 2023-2030 (US$ Mn)
TABLE 165 South Korea Sexual Health Supplements Market, by Formulation, 2017-2022 (US$ Mn)
TABLE 166 South Korea Sexual Health Supplements Market, by Formulation, 2023-2030 (US$ Mn)
TABLE 167 South Korea Sexual Health Supplements Market, by Distribution Channel, 2017-2022 (US$ Mn)
TABLE 168 South Korea Sexual Health Supplements Market, by Distribution Channel, 2023-2030 (US$ Mn)
TABLE 169 South Korea Sexual Health Supplements Market, by Product, 2017-2022 (US$ Mn)
TABLE 170 South Korea Sexual Health Supplements Market, by Product, 2023-2030 (US$ Mn)
TABLE 171 South-East Asia Sexual Health Supplements Market, by Gender, 2017-2022 (US$ Mn)
TABLE 172 South-East Asia Sexual Health Supplements Market, by Gender, 2023-2030 (US$ Mn)
TABLE 173 South-East Asia Sexual Health Supplements Market, by Formulation, 2017-2022 (US$ Mn)
TABLE 174 South-East Asia Sexual Health Supplements Market, by Formulation, 2023-2030 (US$ Mn)
TABLE 175 South-East Asia Sexual Health Supplements Market, by Distribution Channel, 2017-2022 (US$ Mn)
TABLE 176 South-East Asia Sexual Health Supplements Market, by Distribution Channel, 2023-2030 (US$ Mn)
TABLE 177 South East Asia Sexual Health Supplements Market, by Product, 2017-2022 (US$ Mn)
TABLE 178 South East Asia Sexual Health Supplements Market, by Product, 2023-2030 (US$ Mn)
TABLE 179 Rest of Asia Pacific Sexual Health Supplements Market, by Gender, 2017-2022 (US$ Mn)
TABLE 180 Rest of Asia Pacific Sexual Health Supplements Market, by Gender, 2023-2030 (US$ Mn)
TABLE 181 Rest of Asia Pacific Sexual Health Supplements Market, by Formulation, 2017-2022 (US$ Mn)
TABLE 182 Rest of Asia Pacific Sexual Health Supplements Market, by Formulation, 2023-2030 (US$ Mn)
TABLE 183 Rest of Asia Pacific Sexual Health Supplements Market, by Distribution Channel, 2017-2022 (US$ Mn)
TABLE 184 Rest of Asia Pacific Sexual Health Supplements Market, by Distribution Channel, 2023-2030 (US$ Mn)
TABLE 185 Rest of Asia Pacific Sexual Health Supplements Market, by Product, 2017-2022 (US$ Mn)
TABLE 186 Rest of Asia Pacific Sexual Health Supplements Market, by Product, 2023-2030 (US$ Mn)
TABLE 187 Latin America Sexual Health Supplements Market, by Gender, 2017-2022 (US$ Mn)
TABLE 188 Latin America Sexual Health Supplements Market, by Gender, 2023-2030 (US$ Mn)
TABLE 189 Latin America Sexual Health Supplements Market, by Formulation, 2017-2022 (US$ Mn)
TABLE 190 Latin America Sexual Health Supplements Market, by Formulation, 2023-2030 (US$ Mn)
TABLE 191 Latin America Sexual Health Supplements Market, by Distribution Channel, 2017-2022 (US$ Mn)
TABLE 192 Latin America Sexual Health Supplements Market, by Distribution Channel, 2023-2030 (US$ Mn)
TABLE 193 Latin America Sexual Health Supplements Market, by Product, 2017-2022 (US$ Mn)
TABLE 194 Latin America Sexual Health Supplements Market, by Product, 2023-2030 (US$ Mn)
TABLE 195 Brazil Sexual Health Supplements Market, by Gender, 2017-2022 (US$ Mn)
TABLE 196 Brazil Sexual Health Supplements Market, by Gender, 2023-2030 (US$ Mn)
TABLE 197 Brazil Sexual Health Supplements Market, by Formulation, 2017-2022 (US$ Mn)
TABLE 198 Brazil Sexual Health Supplements Market, by Formulation, 2023-2030 (US$ Mn)
TABLE 199 Brazil Sexual Health Supplements Market, by Distribution Channel, 2017-2022 (US$ Mn)
TABLE 200 Brazil Sexual Health Supplements Market, by Distribution Channel, 2023-2030 (US$ Mn)
TABLE 201 Brazil Sexual Health Supplements Market, by Product, 2017-2022 (US$ Mn)
TABLE 202 Brazil Sexual Health Supplements Market, by Product, 2023-2030 (US$ Mn)
TABLE 203 Argentina Sexual Health Supplements Market, by Gender, 2017-2022 (US$ Mn)
TABLE 204 Argentina Sexual Health Supplements Market, by Gender, 2023-2030 (US$ Mn)
TABLE 205 Argentina Sexual Health Supplements Market, by Formulation, 2017-2022 (US$ Mn)
TABLE 206 Argentina Sexual Health Supplements Market, by Formulation, 2023-2030 (US$ Mn)
TABLE 207 Argentina Sexual Health Supplements Market, by Distribution Channel, 2017-2022 (US$ Mn)
TABLE 208 Argentina Sexual Health Supplements Market, by Distribution Channel, 2023-2030 (US$ Mn)
TABLE 209 Argentina Sexual Health Supplements Market, by Product, 2017-2022 (US$ Mn)
TABLE 210 Argentina Sexual Health Supplements Market, by Product, 2023-2030 (US$ Mn)
TABLE 211 Rest of Latin America Sexual Health Supplements Market, by Gender, 2017-2022 (US$ Mn)
TABLE 212 Rest of Latin America Sexual Health Supplements Market, by Gender, 2023-2030 (US$ Mn)
TABLE 213 Rest of Latin America Sexual Health Supplements Market, by Formulation, 2017-2022 (US$ Mn)
TABLE 214 Rest of Latin America Sexual Health Supplements Market, by Formulation, 2023-2030 (US$ Mn)
TABLE 215 Rest of Latin America Sexual Health Supplements Market, by Distribution Channel, 2017-2022 (US$ Mn)
TABLE 216 Rest of Latin America Sexual Health Supplements Market, by Distribution Channel, 2023-2030 (US$ Mn)
TABLE 217 Rest of Latin America Sexual Health Supplements Market, by Product, 2017-2022 (US$ Mn)
TABLE 218 Rest of Latin America Sexual Health Supplements Market, by Product, 2023-2030 (US$ Mn)
TABLE 219 Middle East and Africa Sexual Health Supplements Market, by Gender, 2017-2022 (US$ Mn)
TABLE 220 Middle East and Africa Sexual Health Supplements Market, by Gender, 2023-2030 (US$ Mn)
TABLE 221 Middle East and Africa Sexual Health Supplements Market, by Formulation, 2017-2022 (US$ Mn)
TABLE 222 Middle East and Africa Sexual Health Supplements Market, by Formulation, 2023-2030 (US$ Mn)
TABLE 223 Middle East and Africa Sexual Health Supplements Market, by Distribution Channel, 2017-2022 (US$ Mn)
TABLE 224 Middle East and Africa Sexual Health Supplements Market, by Distribution Channel, 2023-2030 (US$ Mn)
TABLE 225 Middle East and Africa Sexual Health Supplements Market, by Product, 2017-2022 (US$ Mn)
TABLE 226 Middle East and Africa Sexual Health Supplements Market, by Product, 2023-2030 (US$ Mn)
TABLE 227 GCC Countries Sexual Health Supplements Market, by Gender, 2017-2022 (US$ Mn)
TABLE 228 GCC Countries Sexual Health Supplements Market, by Gender, 2023-2030 (US$ Mn)
TABLE 229 GCC Countries Sexual Health Supplements Market, by Formulation, 2017-2022 (US$ Mn)
TABLE 230 GCC Countries Sexual Health Supplements Market, by Formulation, 2023-2030 (US$ Mn)
TABLE 231 GCC Countries Sexual Health Supplements Market, by Distribution Channel, 2017-2022 (US$ Mn)
TABLE 232 GCC Countries Sexual Health Supplements Market, by Distribution Channel, 2023-2030 (US$ Mn)
TABLE 233 GCC Countries Sexual Health Supplements Market, by Product, 2017-2022 (US$ Mn)
TABLE 234 GCC Countries Sexual Health Supplements Market, by Product, 2023-2030 (US$ Mn)
TABLE 235 South Africa Sexual Health Supplements Market, by Gender, 2017-2022 (US$ Mn)
TABLE 236 South Africa Sexual Health Supplements Market, by Gender, 2023-2030 (US$ Mn)
TABLE 237 South Africa Sexual Health Supplements Market, by Formulation, 2017-2022 (US$ Mn)
TABLE 238 South Africa Sexual Health Supplements Market, by Formulation, 2023-2030 (US$ Mn)
TABLE 239 South Africa Sexual Health Supplements Market, by Distribution Channel, 2017-2022 (US$ Mn)
TABLE 240 South Africa Sexual Health Supplements Market, by Distribution Channel, 2023-2030 (US$ Mn)
TABLE 241 South Africa Sexual Health Supplements Market, by Product, 2017-2022 (US$ Mn)
TABLE 242 South Africa Sexual Health Supplements Market, by Product, 2023-2030 (US$ Mn)
TABLE 243 Rest of Middle East and Africa Sexual Health Supplements Market, by Gender, 2017-2022 (US$ Mn)
TABLE 244 Rest of Middle East and Africa Sexual Health Supplements Market, by Gender, 2023-2030 (US$ Mn)
TABLE 245 Rest of Middle East and Africa Sexual Health Supplements Market, by Formulation, 2017-2022 (US$ Mn)
TABLE 246 Rest of Middle East and Africa Sexual Health Supplements Market, by Formulation, 2023-2030 (US$ Mn)
TABLE 247 Rest of Middle East and Africa Sexual Health Supplements Market, by Distribution Channel, 2017-2022 (US$ Mn)
TABLE 248 Rest of Middle East and Africa Sexual Health Supplements Market, by Distribution Channel, 2023-2030 (US$ Mn)
TABLE 249 Rest of Middle East and Africa Sexual Health Supplements Market, by Product, 2017-2022 (US$ Mn)
TABLE 250 Rest of Middle East and Africa Sexual Health Supplements Market, by Product, 2023-2030 (US$ Mn)

Frequently Asked Questions

What is the current size of the global Sexual Health Supplements Market?

The global Sexual Health Supplements Market was valued at USD 2.2 Billion in 2022.

What is the expected growth rate of the Sexual Health Supplements Market between 2023 and 2030?

The Sexual Health Supplements Market is expected to grow at a CAGR of 9.80% between 2023 and 2030, reaching USD 4.0 Billion in 2030.

Which segment is leading the market share in terms of gender?

Men are the leading segment by gender, holding over 43% share in terms of value in 2022.

Which formulation segment governs the demand for sexual health supplements in the world?

The capsule segment governs the demand for sexual health supplements in the world, holding a massive share of over 80% in 2022.

Which segment is expected to post the highest CAGR during the forecast period?

The online store’s segment is expected to post the highest CAGR during the forecast period.

Which product segment governs the demand for sexual health supplements in the world?

The natural segment governs the demand for sexual health supplements in the world, holding a massive share of over 80% in 2022.

Which region is fueling the growth of the sexual health supplements industry?

North America is fueling the growth of the sexual health supplements industry, with an over one-third share in 2022.

Who are the major players in the global Sexual Health Supplements Market?

The top players include Ambic Ayurved India Pvt. Ltd., Aytu BioPharma Inc., BioFilm Inc., Church and Dwight Co. Inc., Cyanotech Corp., Dabur India Ltd., Doc Johnson Enterprises, GNC Holdings LLC, Good Clean Love Inc., Herbalife International of America Inc., Hi Tech Pharmaceuticals Inc., Himalaya Global Holdings Ltd., Leading Edge Health Inc., and Lovehoney Group Ltd.

What are the major market drivers of the sexual health supplements industry?

Rising prevalence of erectile dysfunction and the adverse drug reactions from drugs like antidepressants that result in low sexual drive or sexual dysfunction are the major market drivers.

What are the major market restraints of the sexual health supplements industry?

The presence of alternatives in the market for sexual enhancement supplements is the major market restraint.

What are the major market opportunities of the sexual health supplements industry?

The rapid expansion of e-commerce, the availability of supplements in various dose forms, and the introduction of new sexual health supplements are all emerging trends in the business and are major opportunities in the sexual health supplements industry.

Vietnam Pneumococcal Vaccine Market

Published:
Report ID: 37015

Head and Neck Cancer Market

Published:
Report ID: 36992

Disposable Surgical Devices Market

Published:
Report ID: 36989

Ophthalmoscopes Market

Published:
Report ID: 36972

Japan Restorative Dentistry Market

Published:
Report ID: 36960

India Traditional Medicine Market

Published:
Report ID: 36954

India Restorative Dentistry Market

Published:
Report ID: 36951

Wearable Injectors Market

Published:
Report ID: 36911

Maternity and Nursing Bras Market

Published:
Report ID: 36899

India Cancer Immunotherapy Market

Published:
Report ID: 36893

Healthcare Interoperability Solutions Market

Published:
Report ID: 36890

Wound Dressings Market

Published:
Report ID: 36865

Purchase Options

$2999
Delivery Format: Excel.
$4999
Designed for the individual purchaser.
$6999
Users located at a single corporate site or regional office.
$7999
Allowed for unlimited sharing globally within one company.
Smallform of Sample request

Have a question?

User Profile

Don’t settle for less – trust Mitul to help you find the best solution.

Report delivery within 24 to 48 hours

– Other Info –

What people say?-

User Review

I am very impressed with the information in this report. The author clearly did their research when they came up with this product and it has already given me a lot of ideas.

Jana Schmidt
CEDAR CX Technologies

– Connect with us –

Phone

+91 6232 49 3207


support

24/7 Research Support


sales@credenceresearch.com

– Research Methodology –

Going beyond the basics: advanced techniques in research methodology

– Trusted By –

Pepshi, LG, Nestle
Motorola, Honeywell, Johnson and johnson
LG Chem, SIEMENS, Pfizer
Unilever, Samsonite, QIAGEN