
Market Overview
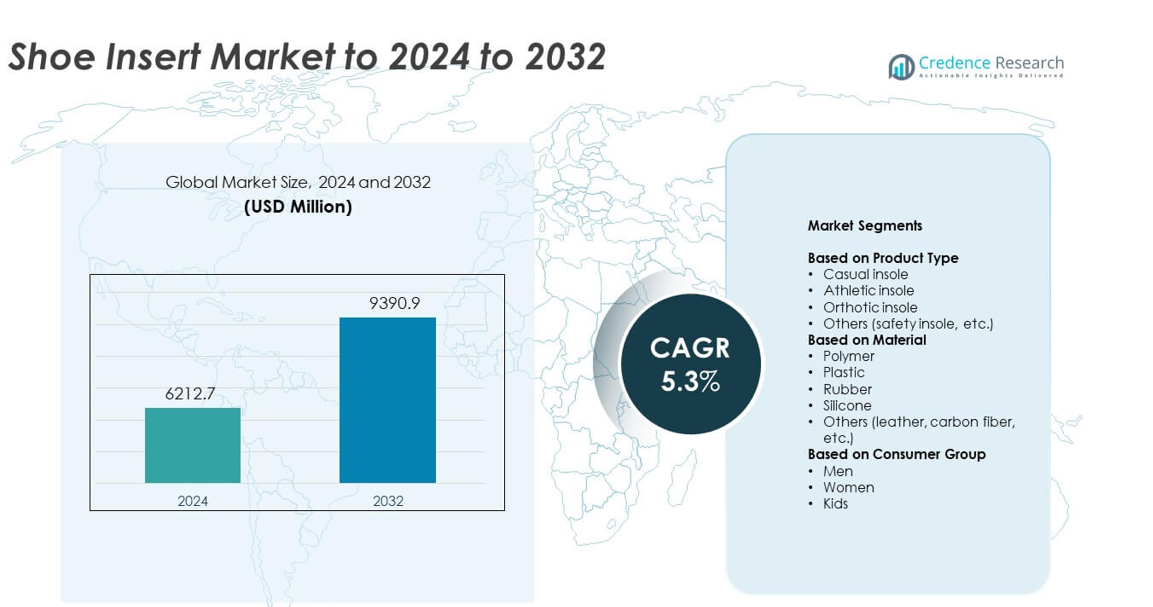
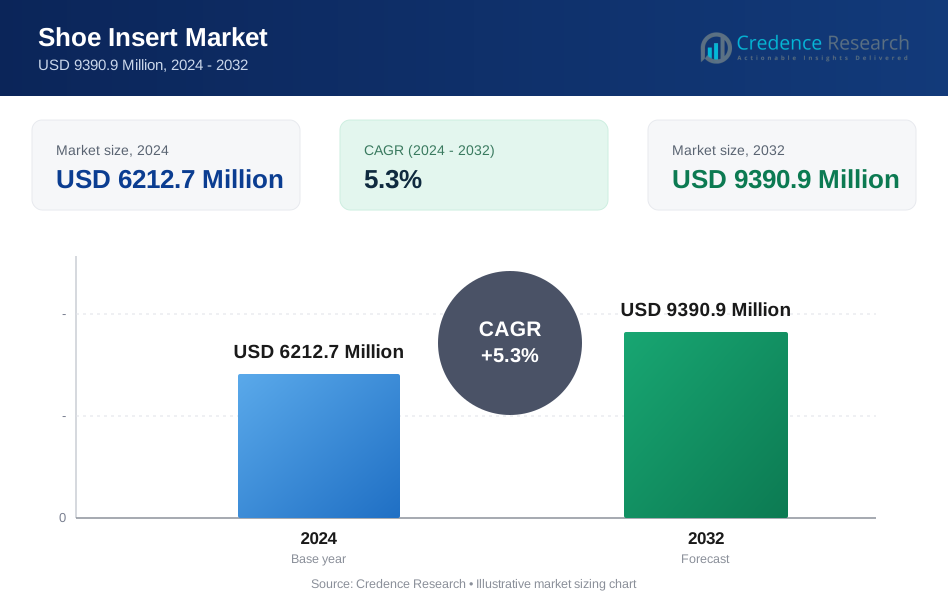
Shoe Insert Market size was valued at USD 6212.7 Million in 2024 and is anticipated to reach USD 9390.9 Million by 2032, at a CAGR of 5.3% during the forecast period.
| REPORT ATTRIBUTE | DETAILS |
|---|---|
| Historical Period | 2020-2023 |
| Base Year | 2024 |
| Forecast Period | 2025-2032 |
| Shoe Insert Market Size 2024 | USD 6212.7 Million |
| Shoe Insert Market, CAGR | 5.3% |
| Shoe Insert Market Size 2032 | USD 9390.9 Million |
The Shoe Insert Market is shaped by leading players such as ENERTOR, Puma, FootBalance System, Nike, Sidas, Bauerfeind, PROFOOT, PowerStep, Foot Science, and CURREX, each offering advanced comfort, performance, and orthotic solutions across global sales channels. These companies compete through material innovation, ergonomic design, and growing online distribution. North America led the market in 2024 with about 37% share, driven by strong sports usage and high awareness of foot health. Europe followed with nearly 28% share, supported by medical adoption and lifestyle demand, while Asia Pacific held roughly 23% and recorded the fastest growth.
Market Insights
- The Shoe Insert Market reached USD 6212.7 Million in 2024 and is projected to hit USD 9390.9 Million by 2032 with a CAGR of 5.3%.
- Strong demand rises from increasing foot health awareness, growing sports activity, and higher use of comfort-focused footwear across daily and work settings.
- Custom-fit solutions, sustainable materials, and digital fitting tools shape major trends as consumers seek more tailored and performance-oriented inserts.
- Competition remains intense as global brands invest in advanced cushioning, ergonomic design, and online expansion while facing pressure from low-cost alternatives.
- North America led with 37% share in 2024, followed by Europe with 28% and Asia Pacific with 23%, while casual insoles held the top segment position with 38% share.
Market Segmentation Analysis:
By Product Type
Casual insoles held the dominant position in 2024 with about 38% share. Strong demand came from daily footwear users who seek comfort, pressure relief, and fatigue reduction during long walking hours. Brands expanded cushioning designs and breathable layers to support wider lifestyle use across work, travel, and leisure. Athletic insoles grew as sports participation increased, while orthotic insoles advanced due to rising foot pain cases. Safety insoles stayed smaller but gained traction in industrial settings that require impact protection and stable support.
- For instance, Superfeet’s Trailblazer Comfort insoles in a men's size 10 (size E) weigh about 100 grams per pair. They are built for hiking and everyday walking on mixed terrain.
By Material
Polymer-based insoles led this segment in 2024 with nearly 41% share. Polymer materials offer strong durability, light weight, and steady shock absorption, which suits both casual and athletic footwear. Expanded use in memory foam and EVA blends supported higher adoption in mid-range and premium shoe lines. Rubber and silicone options grew due to strong grip and flexibility, while plastic-based units stayed common in low-cost models. Leather, carbon fiber, and other specialty materials captured a smaller base linked to niche comfort and performance needs.
- For instance, the PowerStep Pinnacle Original Full Length Orthotic Insoles have a forefoot thickness of approximately 6 mm and a heel thickness of approximately 10 mm, with an arch height of approximately 31 mm, according to multiple product specifications from online retailers.
By Consumer Group
Men accounted for the largest share in 2024 with around 46%. Demand rose due to higher use of work shoes, sports footwear, and protective boots where added cushioning and arch support improve comfort and long-hour stability. Women’s insoles grew with increasing interest in posture correction and pressure-relief designs suited to varied footwear styles. Kids remained a smaller group but gained momentum as parents focused on foot alignment and growth support. Improved materials and wider retail access strengthened uptake across all consumer categories.
Key Growth Drivers
Rising Foot Health Awareness
Growing concern about foot pain, plantar fasciitis, and posture issues increased demand for supportive shoe inserts. Consumers now seek products that reduce pressure, improve alignment, and enhance daily comfort. Clinics and sports therapists also recommend insoles more often, which boosts adoption across casual, athletic, and work footwear. Wider retail availability and digital customization tools further expand reach, making foot-care solutions accessible to a larger population.
- For instance, Dr. Scholl’s Custom Fit Orthotic Center uses around 2,200 pressure sensors to map each foot during a standing scan.
Expansion of Sports and Fitness Activities
Higher participation in running, gym training, and field sports drives need for shock-absorbing and performance-enhancing insoles. Athletes rely on inserts to reduce injury risk, stabilize the foot, and improve energy transfer during movement. Brands respond with advanced foam layers, impact zones, and heat-moldable materials. Growing interest in preventive care also supports steady demand among amateur and professional users who value long-term joint protection.
- For instance, Nike’s ZoomX Invincible Run 2 running shoe uses a ZoomX midsole with a brand-stated stack height of about 36.6 millimeters at the heel and 27.6 millimeters at the forefoot.
Growth in Workplace Safety and Comfort Demand
Industrial and service workers need added cushioning to handle long standing hours and high-impact environments. Companies now include supportive insoles in safety programs to reduce fatigue and lower injury claims. Rising use of protective boots and slip-resistant footwear also pushes adoption of inserts designed for stability and heel support. This trend strengthens uptake across manufacturing, logistics, healthcare, and retail sectors.
Key Trends and Opportunities
Rise of Custom and Semi-Custom Insoles
Consumers increasingly look for tailored comfort that matches arch height, gait pattern, and weight distribution. Digital scanning, mobile foot-mapping tools, and 3D-printed designs enable more precise fit and performance. Semi-custom inserts gain traction in retail stores due to lower cost and faster delivery. This shift opens new opportunities for brands to expand premium offerings and build stronger customer loyalty.
- For instance, FootBalance’s MyFootBalance 3D foot scanner unit measures roughly 72 by 96 by 144 centimeters and weighs about 70 kilograms.
Sustainable and Advanced Material Adoption
The market sees rising interest in eco-friendly foams, recycled plastics, and bio-based cushioning layers. These materials appeal to buyers who want comfort without added environmental impact. At the same time, brands explore graphene blends, gel compounds, and aerated foams that improve shock absorption and durability. This trend supports premium growth and helps companies stand out in competitive segments.
- For instance, Allbirds’ Tree Runner shoe uses a SweetFoam midsole and castor-bean–oil insole foam, and the model’s cradle-to-gate carbon footprint is listed as 4.99 kilograms of CO₂ equivalent per pair.
Growing Penetration in Online Channels
E-commerce platforms help consumers compare support levels, materials, and comfort features with ease. Online sales rise due to wider product availability, trial-friendly policies, and strong digital marketing. Brands leverage virtual fitting tools and subscription models to improve repeat purchases. This shift offers a key opportunity to reach global buyers without heavy retail investments.
Key Challenges
Limited Product Differentiation
Many brands offer similar cushioning, arch support, and material options, which reduces clear separation across categories. This overlap makes it harder for companies to command premium pricing or secure strong loyalty. Consumers often switch brands based on discounts rather than performance. Firms must invest in innovation, clinical testing, and clear value communication to overcome this challenge.
Counterfeit and Low-Quality Products
Online marketplaces face rising inflow of imitation insoles that use poor materials and deliver low durability. These products harm consumer trust and create pricing pressure for legitimate brands. Low-quality inserts may also cause discomfort or injury, reducing confidence in the overall category. Stronger quality checks, certifications, and brand-controlled distribution are essential to address this issue.
Regional Analysis
North America
North America held the leading position in 2024 with about 37% share. Strong adoption came from rising foot health awareness, higher sports participation, and widespread use of comfort-focused footwear. The region benefits from strong retail penetration, advanced product designs, and early uptake of custom-fit insoles. Demand remained high across both athletic and workwear categories due to growing preventive care habits. The United States drove most purchases, while Canada showed steady growth supported by expanding e-commerce sales and wellness spending.
Europe
Europe accounted for nearly 28% share in 2024. The region showed strong preference for orthotic and medically recommended inserts due to high attention toward posture correction and chronic foot issues. Demand rose across Germany, the United Kingdom, and France as consumers focused on comfort during daily commuting and work routines. Sports culture also supported athletic insole sales. Retailers expanded offerings in drugstores and specialty shops, strengthening overall access. Growing interest in sustainable materials further supported market traction.
Asia Pacific
Asia Pacific captured about 23% share in 2024 and recorded the fastest growth. Rising urbanization, long working hours, and increasing sports activity boosted demand for supportive insoles across major markets. China, India, Japan, and South Korea saw growing adoption of both casual and orthotic inserts. Expanding middle-class income and wider online availability helped shift consumers toward premium comfort products. Local brands also scaled production of affordable models, improving reach in value-driven segments.
Latin America
Latin America held roughly 7% share in 2024. Demand improved as more consumers sought low-cost comfort solutions for daily footwear and long work shifts. Brazil and Mexico led adoption due to growing sports interest and higher purchases of protective footwear. Awareness campaigns by clinics and pharmacies helped promote orthotic inserts, though adoption remained slower than in developed regions. E-commerce growth increased exposure to global brands and expanded product choices across urban areas.
Middle East and Africa
Middle East and Africa represented about 5% share in 2024. Growth came from rising use of safety footwear in construction, oil and gas, and industrial sectors. Comfort-driven inserts gained traction among workers who spend long hours on hard surfaces. Countries such as the UAE, Saudi Arabia, and South Africa showed higher uptake due to expanding retail networks and improved access to imported brands. Limited awareness in rural areas kept overall penetration lower, but urban markets continued to advance steadily.
Market Segmentations:
By Product Type
- Casual insole
- Athletic insole
- Orthotic insole
- Others (safety insole, etc.)
By Material
- Polymer
- Plastic
- Rubber
- Silicone
- Others (leather, carbon fiber, etc.)
By Consumer Group
- Men
- Women
- Kids
By Geography
- North America
- U.S.
- Canada
- Mexico
- Europe
- Germany
- France
- U.K.
- Italy
- Spain
- Rest of Europe
- Asia Pacific
- China
- Japan
- India
- South Korea
- South-east Asia
- Rest of Asia Pacific
- Latin America
- Brazil
- Argentina
- Rest of Latin America
- Middle East & Africa
- GCC Countries
- South Africa
- Rest of the Middle East and Africa
Competitive Landscape
The Shoe Insert Market features key players such as ENERTOR, Puma, FootBalance System, Nike, Sidas, Bauerfeind, PROFOOT, PowerStep, Foot Science, and CURREX operating in a highly competitive environment shaped by performance innovation and material advancement. Companies focus on enhanced cushioning, tailored arch profiles, and advanced shock absorption to meet rising comfort and wellness needs. Product lines expand across casual, athletic, and orthotic categories to reach broader consumer groups. Firms invest in research, digital fitting tools, and ergonomic testing to strengthen product differentiation. Sustainability also guides development as brands explore eco-friendly foams and recycled materials. Strong retail placement and digital visibility help maintain customer reach, while growing online channels create space for both global and emerging brands.
Key Player Analysis
Recent Developments
- In 2025, Nike unveiled the Mind 001 and Mind 002 “mind-body” shoes, which are scheduled for general release in January 2026.
- In 2024, Bauerfeind continued promoting Run Performance insoles for runners, highlighting targeted cushioning and arch support.
- In 2024, CURREX became official insole partner of Major League Pickleball, promoting pickleball-specific inserts
Report Coverage
The research report offers an in-depth analysis based on Product Type, Material, Consumer Group and Geography. It details leading market players, providing an overview of their business, product offerings, investments, revenue streams, and key applications. Additionally, the report includes insights into the competitive environment, SWOT analysis, current market trends, as well as the primary drivers and constraints. Furthermore, it discusses various factors that have driven market expansion in recent years. The report also explores market dynamics, regulatory scenarios, and technological advancements that are shaping the industry. It assesses the impact of external factors and global economic changes on market growth. Lastly, it provides strategic recommendations for new entrants and established companies to navigate the complexities of the market.
Future Outlook
- The market will grow as foot health awareness increases across all age groups.
- Custom and semi-custom inserts will gain wider adoption through digital scanning tools.
- Sports and fitness expansion will drive steady demand for performance-focused insoles.
- Workplace safety programs will push companies to adopt supportive inserts for employees.
- Sustainable and advanced materials will shape new product development.
- Online channels will expand faster as brands improve virtual fitting and support tools.
- Medical recommendations for orthotic inserts will rise with growing foot-related issues.
- Premium comfort products will gain traction in both casual and athletic footwear.
- Local manufacturers will scale affordable options to meet value-driven demand.
- Product innovation will focus on durability, breathability, and shock absorption enhancements.
Request a Free Sample
Fill in your details and we'll send you a free sample report.
- Sample data tables & charts
- Research methodology
Need a Custom Version of This Report?
Tailor the scope, geography, or segments to your exact requirements.
- Custom geography or segment scope
- Direct access to our analyst team
Frequently Asked Questions
What is the current market size for Shoe Insert Market, and what is its projected size in 2032?
At what Compound Annual Growth Rate is the Shoe Insert Market projected to grow between 2024 and 2032?
Which Shoe Insert Market segment held the largest share in 2024?
What are the primary factors fueling the growth of the Shoe Insert Market?
Who are the leading companies in the Shoe Insert Market?
Table of Content
Chapter 1. Report Introduction
- 1.1 Report Description & Purpose
- 1.1.1 Report Title & Market Definition
- 1.1.2 Unique Selling Propositions (USP) & Key Differentiators
- 1.1.3 Value Proposition for Stakeholders
- 1.2 Research Objectives
- 1.2.1 Market Sizing Objectives (Volume & Revenue)
- 1.2.2 Segmentation Objectives
- 1.2.3 Competitive Intelligence Objectives
- 1.2.4 Forecast & Scenario Objectives
- 1.3 Report Scope
- 1.3.1 Shoe Insert Scope – Types & Subtypes Covered
- 1.3.2 Geographic Scope – Regions & Countries Covered
- 1.3.3 Historical Period, Base Year & Forecast Period (2024; forecast to 2032)
- 1.3.4 Inclusions & Exclusions
- 1.4 HS Code & Classification Framework
- 1.5 Currency, Units & Pricing Basis
- 1.6 Target Stakeholders
- 1.7 Limitations & Assumptions
Chapter 2. Executive Summary
- 2.1 Global Shoe Insert Market Snapshot
- 2.1.1 Market Size – Historical (2024) & Forecast (2024-2032) (2024: USD 6212.7 Million → 2032: USD 9390.9 Million)
- 2.1.2 Volume & Revenue – Global Totals
- 2.1.3 Key Market Highlights – Top Five Facts
- 2.2 Shoe Insert Market Segmentation Snapshot
- 2.2.1 Market Split by Region – 2024 vs. 2032
- 2.3 Competitive Snapshot
- 2.3.1 Top 10 Players by Revenue Share – 2024
- 2.3.2 Top 10 Players by Volume Share – 2024
- 2.3.3 Recent Strategic Developments (18-Month Summary)
- 2.4 Key Investment Highlights & Strategic Conclusions
Chapter 3. Shoe Insert Market Dynamics & Industry Analysis
- 3.1 Market Overview & Context
- 3.1.1 Shoe Insert Market Position in the Broader Automotive Value Chain
- 3.1.2 OEM vs. Replacement Market Dynamics
- 3.1.3 Market Maturity & Development Stage by Region
- 3.2 Shoe Insert Market Drivers
- 3.3 Shoe Insert Market Restraints & Challenges
- 3.4 Shoe Insert Market Opportunities
- 3.5 Porter's Five Forces Analysis
- 3.5.1 Threat of New Entrants
- 3.5.2 Bargaining Power of Suppliers
- 3.5.3 Bargaining Power of Buyers
- 3.5.4 Threat of Substitutes
- 3.5.5 Competitive Rivalry – Intensity Assessment
- 3.6 Shoe Insert Value Chain Analysis
- 3.6.1 Upstream – Raw Material/Input Suppliers
- 3.6.1.1 Raw Material/Input 1
- 3.6.1.2 Raw Material/Input 2
- 3.6.1.3 Raw Material/Input 3
- 3.6.2 Midstream – Production/Manufacturing/Service Delivery
- 3.6.2.1 Production/Process Overview
- 3.6.2.2 Key Facility Locations & Capacity by Manufacturer
- 3.6.3 Downstream – Distribution & End Consumer
- 3.6.3.1 Primary Channel – B2B/OEM
- 3.6.3.2 Secondary Channels – Dealer, Retail, Online, Direct
- 3.6.4 Value Chain Profitability Analysis
- 3.6.1 Upstream – Raw Material/Input Suppliers
- 3.7 PESTEL Analysis
- 3.7.1 Political Factors
- 3.7.2 Economic Factors
- 3.7.3 Social Factors
- 3.7.4 Technological Factors
- 3.7.5 Environmental Factors
- 3.7.6 Legal Factors
- 3.8 Shoe Insert Supply Chain Analysis
- 3.8.1 Raw Material/Input Supply Risk Assessment
- 3.8.2 Manufacturing Concentration Risk (Geographic Exposure)
- 3.8.3 Trade Disruption Impact Analysis
- 3.9 Regulatory & Policy Landscape
Note: The regulatory and policy landscape section covers regulations based on their applicability to the market, Shoe Insert category, geography, and scope of the study. Only regulatory frameworks with a material impact on operations, compliance, trade, sustainability, or market access are analyzed in detail.
Chapter 4. Key Investment Pockets & Opportunity Analysis
- 4.1 Shoe Insert Market Attractiveness Analysis
- 4.1.1 By Region – Investment Attractiveness Matrix (Volume × CAGR)
- 4.2 Absolute Revenue Growth Opportunity
- 4.2.1 By Region – Absolute USD Growth Through 2032
- 4.3 Incremental Volume Opportunity
- 4.3.1 By Region – Incremental Volume Through 2032
- 4.3.2 Segment – Incremental Volume
- 4.4 Emerging Submarket Opportunity Deep Dive (Subject to Applicability)
- 4.5 Emerging Market Opportunity Scorecards
- 4.5.1 United States
- 4.5.2 Europe
- 4.5.3 Asia
- 4.5.4 Middle East & Africa
Note: Emerging Market Opportunity Scorecards will be included based on relevance and strategic importance. Regions listed are indicative and may vary depending on data availability and market dynamics.
Chapter 5. Shoe Insert Import-Export Analysis & Trade Flows
- 5.1 Global Trade Overview
- 5.1.1 Global Export Value by Country (2024)
- 5.1.2 Global Export Volume by Country (2024)
- 5.1.3 Global Import Value by Country (2024)
- 5.1.4 Global Import Volume by Country (2024)
- 5.1.5 Net Trade Balance by Country (2024)
- 5.2 Export Analysis – Segment
- 5.2.1 Type 1 (HS Code)
- 5.2.2 Type 2 (HS Code)
- 5.2.3 Type 3 (HS Code)
- 5.2.4 Type 4 (HS Code)
- 5.2.5 Type 5 (HS Code)
- 5.3 Import Analysis – Segment
- 5.3.1 Type 1 (HS Code)
- 5.3.2 Type 2 (HS Code)
- 5.3.3 Type 3 (HS Code)
- 5.3.4 Type 4 (HS Code)
- 5.3.5 Type 5 (HS Code)
- 5.4 Average Unit Trade Prices
- 5.4.1 Average Export Price – Segment & Country
- 5.4.2 Average Import Price – Segment & Source Country
- 5.4.3 Price Trends (2024)
- 5.5 Key Trade Route Analysis
- 5.5.1 Trade Route 1
- 5.5.2 Trade Route 2
- 5.5.3 Trade Route 3
- 5.5.4 Trade Route 4
- 5.5.5 Trade Route 5
- 5.6 Trade Policy Impact Assessment
- 5.6.1 US Anti-Dumping & Section 301 Tariffs
- 5.6.2 EU Customs Union Impact
- 5.6.3 Major Free Trade Agreements
- 5.6.4 USMCA Rules of Origin
Note: Trade policy analysis will be included only where relevant to the Shoe Insert market.
Chapter 6. Competitive Landscape & Company Benchmarking
- 6.1 Shoe Insert Market Concentration & Structure
- 6.1.1 Herfindahl-Hirschman Index (HHI) – vs. 2024
- 6.1.2 Tier 1, Tier 2 & Tier 3 Market Structure
- 6.1.3 Global, Regional & Local Player Dynamics
- 6.2 Shoe Insert Market Share Analysis – 2024
- 6.2.1 Global Revenue Share by Company
- 6.2.2 Global Volume Share by Company
- 6.2.3 Regional Revenue Share
- 6.2.4 Market Share Evolution ( vs. 2024)
- 6.2.5 OEM Segment Share by Company
- 6.2.6 Replacement Segment Share by Company
- 6.3 Production/Delivery Capacity & Facility Analysis
- 6.3.1 Global Installed Capacity
- 6.3.2 Capacity Utilization Rates
- 6.3.3 Production/Output Volume
- 6.3.4 Facility Locations & Capacity Map
- 6.3.5 Planned Capacity Additions
- 6.4 Shoe Insert Competitive Benchmarking Matrix
- 6.4.1 Revenue, Volume, CAGR & Profitability Comparison
- 6.4.2 Channel Revenue Mix
- 6.4.3 Geographic Revenue Exposure
- 6.4.4 R&D Intensity
- 6.4.5 Sustainability Maturity
- 6.5 Strategic Developments in Shoe Insert (Last 24 Months)
- 6.5.1 Mergers, Acquisitions & Divestments
- 6.5.2 New Shoe Insert Launches
- 6.5.3 Facility Expansions
- 6.5.4 Strategic Alliances, Joint Ventures & Partnerships
- 6.5.5 Distribution Expansion & Market Entry
- 6.5.6 Sustainability & ESG Initiatives
- 6.6 Competitive Strategy Mapping
- 6.6.1 Leader, Challenger, Follower & Niche Classification
- 6.6.2 Pricing Strategy Comparison
- 6.6.3 Channel Strategy Matrix
Note: Strategic developments are included based on their materiality and the availability of reliable information.
Chapter 7. Global Shoe Insert Market – By Distribution Channel
- 7.1 Segment Overview
- 7.1.1 Volume & Revenue Split by Channel (2024 & 2032)
- 7.1.2 Channel Mix Evolution (2024-2032)
Chapter 8. Regional Market Analysis – Global Overview
- 8.1 Global Regional Overview
- 8.1.1 Regional Volume Share
- 8.1.2 Regional Revenue Share
- 8.1.3 Regional Volume by Region
- 8.1.4 Regional Revenue by Region
- 8.1.5 Regional Forecast Through 2032
- 8.2 Cross-Regional Segment Analysis
- 8.2.1 By Distribution Channel
- 8.2.2 By Brand/Price Tier
Chapter 9. North America Shoe Insert Market
- 9.1 United States
- 9.2 Canada
- 9.3 Mexico
Chapter 10. Europe Shoe Insert Market
- 10.1 Germany
- 10.2 France
- 10.3 Italy
- 10.4 United Kingdom
- 10.5 Spain
- 10.6 Poland
- 10.7 Russia
- 10.8 Netherlands
- 10.9 Belgium
- 10.10 Sweden
- 10.11 Denmark
- 10.12 Norway
- 10.13 Rest of Europe
Chapter 11. Asia Pacific Shoe Insert Market
- 11.1 China
- 11.2 India
- 11.3 Japan
- 11.4 South Korea
- 11.5 Thailand
- 11.6 Indonesia
- 11.7 Vietnam
- 11.8 Malaysia
- 11.9 Australia
- 11.10 Rest of Asia Pacific
Chapter 12. Latin America Shoe Insert Market
- 12.1 Brazil
- 12.2 Argentina
- 12.3 Colombia
- 12.4 Chile
- 12.5 Rest of Latin America
Chapter 13. Middle East Shoe Insert Market
- 13.1 Saudi Arabia
- 13.2 United Arab Emirates
- 13.3 Turkey
- 13.4 Israel
- 13.5 Iran
- 13.6 Rest of the Middle East
Chapter 14. Africa Shoe Insert Market
- 14.1 South Africa
- 14.2 Egypt
- 14.3 Nigeria
- 14.4 Morocco
- 14.5 Rest of Africa
Chapter 15. Shoe Insert Company Profiles
- 15.1 [Company 01]
- 15.1.1 Company Overview
- 15.1.2 Key Management Personnel
- 15.1.3 Products & Services Portfolio
- 15.1.4 Financial Performance
- 15.1.5 Key Market Focus & Geographic Presence
- 15.1.6 Recent Developments & Strategic Initiatives
Note: The company profile list is preliminary and may change based on research findings, market developments, data availability, and client requirements.
Chapter 16. Appendices
- Appendix A – List of Abbreviations & Acronyms
- Appendix B – Industry Classification Code Reference – Full Series
- Appendix C – Production & Capacity Data Tables
- Appendix D – End-Use & Demand Base Tables
- Appendix E – Consumption & Replacement Rate Assumptions
- Appendix F – ASP Reference Tables
- Appendix G – Manufacturing & Facility Database
- Appendix H – Import-Export Data Tables
- Appendix I – Regulatory Summary Tables
- Appendix J – Primary Research Participant List (Anonymized)
- Appendix K – Primary Research Questionnaire Framework
- Appendix L – Data Sources & Bibliography
- Appendix M – Market Size Divergence & Source Comparison
Chapter 17. Research Methodology
- 17.1 Research Framework & Philosophy
- 17.2 Secondary Research – Sources, Hierarchy & Data Extraction
- 17.3 Data Modeling – Bottom-Up & Top-Down Market Sizing
- 17.4 Primary Research – Stakeholder Framework, LOI & Sample Sizes
- 17.5 Forecast Methodology – Regression, Scenario & Sensitivity Analysis
- 17.6 Quality Control – Four-Layer Validation Framework
- 17.7 Limitations & Standard Assumptions
- 17.8 Disclaimer
