| REPORT ATTRIBUTE |
DETAILS |
| Historical Period |
2020-2023 |
| Base Year |
2024 |
| Forecast Period |
2025-2032 |
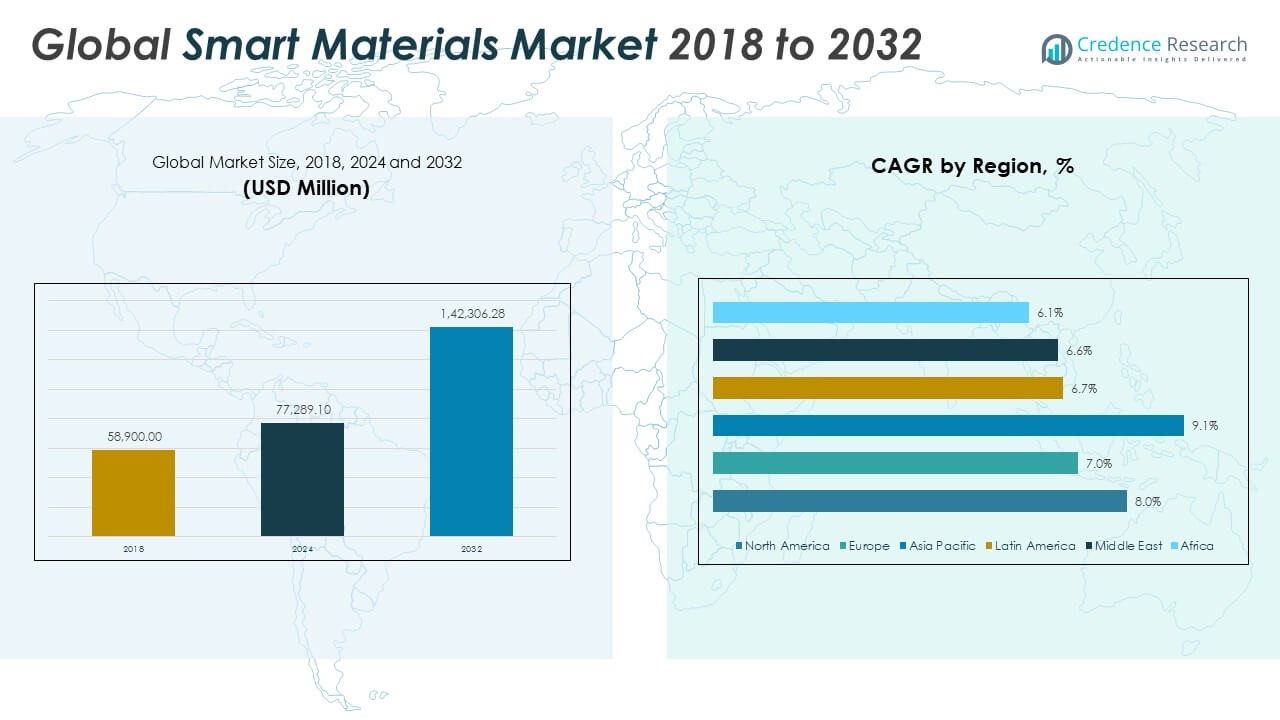
| Smart Materials Market Size 2024 |
USD 77,289.10 million |
| Smart Materials Market, CAGR |
7.96% |
| Smart Materials Market Size 2032 |
USD 1,42,306.28 million |
Market Overview:
The Global Smart Materials Market size was valued at USD 58,900.00 million in 2018 to USD 77,289.10 million in 2024 and is anticipated to reach USD 1,42,306.28 million by 2032, at a CAGR of 7.96%during the forecast period.
Several factors fuel this growth trajectory. The most prominent drivers include rapid technological advancements in nanomaterials and microfabrication, the proliferation of wearable devices and Internet of Things (IoT)-enabled systems, and growing use of smart materials in minimally invasive medical devices. Automotive manufacturers are deploying these materials in noise-reduction components, energy harvesters, and adaptive suspension systems. In aerospace, weight reduction, durability, and safety enhancements are supported by smart composites. Meanwhile, the healthcare sector is leveraging smart polymers and shape-memory alloys in prosthetics, implants, and drug delivery platforms. Increased environmental awareness is also accelerating the adoption of smart coatings and sustainable building materials. Additionally, strong R&D funding, supportive government initiatives, and collaborations among research institutions and industry players are creating a robust innovation pipeline globally.
Regionally, North America holds the largest share of the global smart materials market due to its advanced industrial base, strong defense and healthcare infrastructure, and continuous innovation in materials science. The Asia-Pacific region is witnessing the fastest growth, propelled by rising investments in manufacturing, electronics, and smart infrastructure, particularly in China, Japan, South Korea, and India. This region benefits from a mix of government incentives, large-scale production capabilities, and growing demand for consumer electronics and automotive components. Europe remains a key contributor, led by Germany, France, and the U.K., where emphasis on sustainable materials and high-precision engineering supports market development. While Latin America, the Middle East, and Africa are currently smaller markets, they are gaining momentum due to infrastructure modernization and expanding applications in construction and energy sectors. Overall, the global landscape is evolving rapidly, with both developed and emerging regions contributing to the dynamic growth of the smart materials market.
Access crucial information at unmatched prices!
Request your sample report today & start making informed decisions powered by Credence Research Inc.!
Download Sample
Market Insights:
- The Global Smart Materials Market was valued at USD 58,900 million in 2018, reached USD 77,289.10 million in 2024, and is projected to reach USD 142,306.28 million by 2032, registering a CAGR of 7.96% during the forecast period.
- Smart materials are witnessing strong demand in the healthcare sector, especially in wearable devices, drug delivery systems, implants, and prosthetics due to their biocompatibility and adaptive properties.
- Automotive and aerospace manufacturers are increasingly integrating smart materials such as magneto-rheological fluids and shape-memory alloys to enhance energy efficiency, safety, and vibration control in their systems.
- Technological advancements in nanomaterials, additive manufacturing, and responsive composites are enabling smart materials to be used in more complex and performance-critical applications.
- Government initiatives promoting sustainable infrastructure and energy-efficient technologies are driving investments in smart materials across sectors like construction, energy, and transportation.
- The market faces challenges from high production costs and complex manufacturing processes, which restrict scalability, especially for smaller firms and cost-sensitive industries.
- North America holds the largest market share due to its advanced industrial base and innovation capacity, while Asia-Pacific is the fastest-growing region, fueled by expanding manufacturing and infrastructure activity in countries like China, India, and South Korea.

Market Drivers:
Technological Advancements Expand Application Scope:
Rapid progress in material science and nanotechnology continues to reshape the capabilities of smart materials. Enhanced properties such as self-healing, shape memory, and responsiveness to stimuli like pressure, temperature, or electric fields are enabling their use across more complex and demanding applications. These materials are now integral to modern design in fields ranging from aerospace to biomedical engineering. The Global Smart Materials Market benefits from innovations in fabrication techniques, such as additive manufacturing and micro-encapsulation, that support cost-effective and scalable production. Miniaturization trends in electronics and the demand for lightweight yet functional materials are further accelerating development cycles. It is this technical evolution that opens doors to new functionalities and makes smart materials essential in next-generation product engineering.
- For instance, BASF’s Elastollan® thermoplastic polyurethane (TPU) with self-healing properties demonstrated a 90% recovery of mechanical strength after repeated damage cycles in aerospace component testing, as verified in 2024 technical reports.
Rising Demand in Healthcare and Medical Devices:
The healthcare sector is a major growth engine for smart materials due to increasing investments in wearable devices, drug delivery systems, and prosthetics. Smart polymers and shape-memory alloys are critical in creating responsive, biocompatible tools that improve patient outcomes. Medical implants that adapt to physiological changes and devices that can deliver medications on demand are gaining popularity in personalized treatment protocols. The Global Smart Materials Market benefits from this trend, particularly with rising demand for minimally invasive and remote care technologies. Hospitals and research institutions are actively adopting systems that incorporate smart materials for more efficient diagnostics and treatment. It is this focus on patient-centered innovation that is reinforcing the importance of these materials in the healthcare landscape.
- For instance, Johnson & Johnson’s DePuy Synthes launched the ATTUNE® Knee System, which incorporates proprietary kinematic features such as the ATTUNE Gradius Curve and GlideRight Articulation to improve knee stability and patient outcomes.
Automotive and Aerospace Sectors Drive Strategic Integration:
The integration of smart materials in automotive and aerospace design is transforming product capabilities and performance metrics. Magneto-rheological fluids, smart coatings, and shape-memory alloys are being used for vibration control, adaptive suspension, and temperature-responsive systems. These applications help reduce maintenance costs, increase energy efficiency, and enhance operational safety. The Global Smart Materials Market draws strength from this shift toward intelligent systems that improve user experience and reduce lifecycle costs. OEMs are embedding smart components in both passenger and commercial vehicles to meet growing expectations around efficiency and automation. It is this push for intelligent mobility that continues to drive adoption within the transportation sector.
Government Support and Sustainability Goals Stimulate Investment:
Government initiatives targeting sustainable infrastructure, energy efficiency, and digital transformation are boosting investments in smart material technologies. Public funding and industrial collaboration in the U.S., Europe, China, and South Korea are supporting research on eco-friendly and adaptive materials. Smart materials are critical in advancing goals like net-zero buildings, smart grids, and next-gen transportation systems. The Global Smart Materials Market aligns well with global efforts to reduce resource consumption and improve long-term material performance. Corporate ESG strategies are also encouraging companies to adopt responsive materials that offer lifecycle advantages. It is this alignment with regulatory and environmental priorities that strengthens market momentum across regions.
Market Trends:
Integration with Digital Twins and Smart Infrastructure Platforms:
Smart materials are being integrated into digital twin systems and infrastructure monitoring platforms to enable real-time performance feedback. This trend supports predictive maintenance and lifecycle management in construction, transportation, and industrial settings. Materials embedded with sensors or responsive components provide structural data that feeds into digital simulation environments. The Global Smart Materials Market is seeing increased demand from infrastructure projects that aim to combine physical adaptability with virtual oversight. Smart bridges, tunnels, and buildings are using these materials to adapt to environmental stress and inform asset management strategies. It is this convergence of physical intelligence and digital analytics that defines a critical shift in the built environment.
- For instance, Hexagon’s Leica Geosystems, for example, has developed advanced single-photon LiDAR (SPL) technology for high-efficiency, large-area mapping, supporting digital twin creation and infrastructure monitoring with improved data throughput and quality.
Commercialization of Smart Textiles for Lifestyle and Safety:
Smart textiles are becoming a growing segment within the market due to their expanding role in consumer wearables, safety apparel, and industrial uniforms. These fabrics integrate materials with properties like thermal regulation, impact detection, or embedded circuitry to enhance comfort and functionality. The Global Smart Materials Market is benefiting from interest across sectors including sportswear, military, and health monitoring. Wearable garments are now capable of tracking biometrics, adjusting insulation levels, or alerting users to environmental hazards. It is this blend of form and function that creates new value in consumer and professional settings. Market players are responding with collaborations between tech firms and textile manufacturers to scale production.
- For instance, Sensoria’s smart garments, equipped with heart rate monitoring and cardiac irregularity detection algorithms, provide real-time alerts and have been adopted by fitness enthusiasts and clinical users seeking advanced health tracking.
Growth in Smart Packaging and Interactive Consumer Products:
Brands are adopting smart materials in packaging to create interactive, responsive, or condition-monitoring solutions. These materials can indicate freshness, detect tampering, or provide sensory feedback that enhances user engagement. The Global Smart Materials Market is witnessing new demand from food, pharmaceuticals, and electronics brands looking to differentiate through intelligent packaging. Smart coatings and sensors embedded in labels or surfaces are becoming commercially viable at scale. It is the merging of product safety, traceability, and customer interaction that fuels innovation in this segment. Consumer interest in transparency and sustainability also supports this trend toward active packaging solutions.
Expansion of Energy Harvesting Applications Using Smart Materials:
Smart materials are being used in passive and active energy harvesting systems across urban infrastructure, transport, and wearable electronics. These systems convert mechanical stress, vibration, or heat into usable energy, reducing dependency on traditional power sources. The Global Smart Materials Market is expanding in areas such as self-powered sensors, road energy capture systems, and portable energy solutions. Governments and private developers are testing smart pavements and building materials that harvest kinetic energy from pedestrian or vehicular movement. It is this focus on energy autonomy and decentralized power generation that positions smart materials at the forefront of future energy ecosystems. Demand continues to grow where sustainability and self-sufficiency intersect.
Market Challenges Analysis:
High Production Costs and Complex Manufacturing Processes Limit Scalability:
One of the primary challenges facing the Global Smart Materials Market is the high cost of production and complex fabrication processes. Advanced smart materials often require precision engineering, specialized raw materials, and controlled environments, which drive up manufacturing expenses. These requirements make it difficult for smaller companies to enter the market or scale production efficiently. It also limits the commercial viability of certain smart materials in cost-sensitive applications. While research institutions continue to explore cost-effective alternatives, widespread adoption remains constrained by affordability. It is this cost-performance gap that hinders the broader industrial deployment of high-functionality materials.
Standardization and Lifecycle Uncertainty Restrict Broader Adoption:
The lack of standardized testing protocols and performance benchmarks across smart material types creates uncertainty for end-users and manufacturers. Different industries require specific validation procedures to ensure long-term reliability, safety, and regulatory compliance. The Global Smart Materials Market often struggles to align with sector-specific standards, particularly in aerospace, healthcare, and construction. Lifecycle behavior, durability under varied environmental conditions, and degradation patterns remain areas where data is insufficient or inconsistent. It is this lack of uniformity that makes integration into regulated or safety-critical applications more complex. Market growth depends on the development of universal standards and robust validation frameworks.
Market Opportunities:
Emerging Demand Across Smart Cities and Sustainable Infrastructure Projects:
Smart city initiatives and sustainable infrastructure development present strong growth avenues for the Global Smart Materials Market. Governments and developers are investing in responsive materials for applications like adaptive building facades, self-healing roads, and intelligent public transportation systems. These projects demand materials that enhance energy efficiency, durability, and real-time monitoring. It is within this context that smart materials offer tangible value by reducing maintenance costs and extending asset lifespans. The integration of such materials in urban design supports climate resilience and environmental targets. Growing public sector budgets for infrastructure renewal further expands the opportunity landscape.
Expansion Potential in Next-Generation Consumer and Industrial Devices:
The development of flexible electronics, next-gen wearables, and responsive industrial components is opening new commercial possibilities. The Global Smart Materials Market is positioned to benefit from rising consumer interest in adaptive products and industry demand for more efficient systems. Sectors such as robotics, logistics, and packaging are adopting smart materials for enhanced performance and automation. It is this cross-sector utility that enables vendors to diversify product offerings and enter new verticals. Growth in digital health, remote monitoring, and smart appliances will continue to create fresh opportunities for innovation and market penetration.
Market Segmentation Analysis:
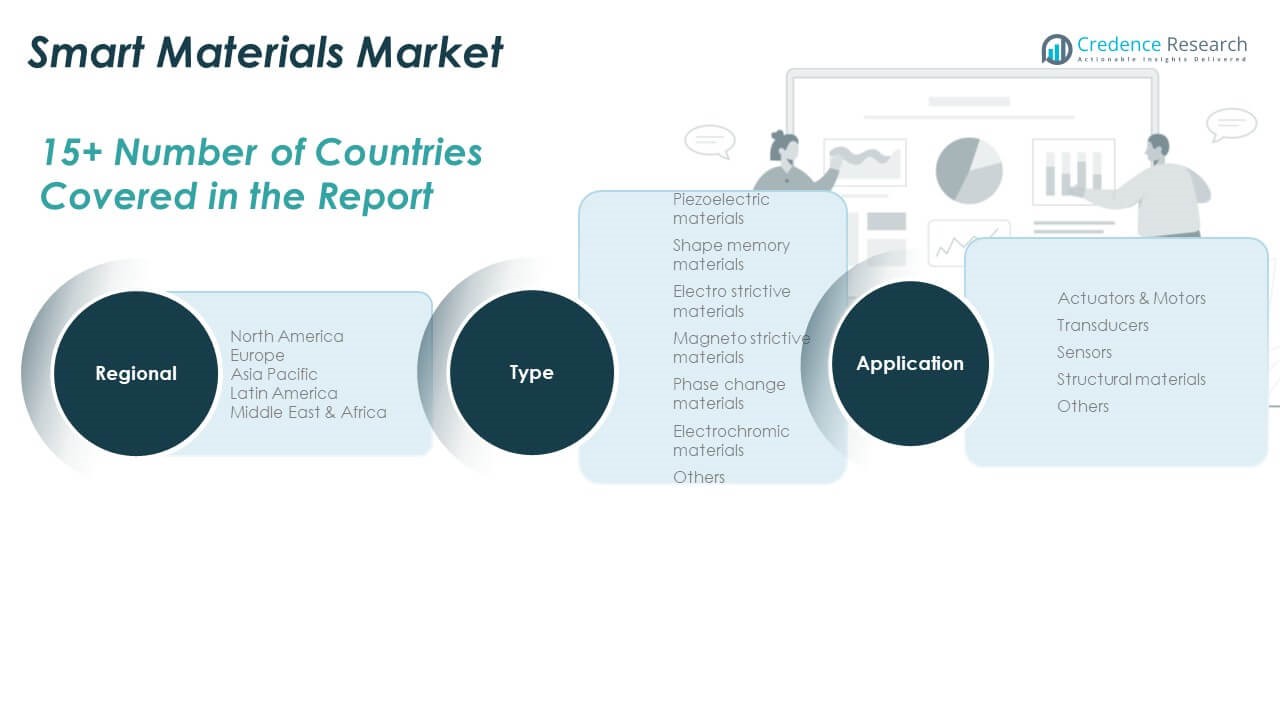
By Product Segment
The Global Smart Materials Market includes a wide range of functional materials tailored for specific performance needs. Piezoelectric materials hold a substantial share due to their widespread use in sensing, energy harvesting, and actuation applications. Shape memory materials are increasingly adopted in biomedical, aerospace, and robotics systems for their unique ability to return to a pre-defined shape. Electro strictive and magneto strictive materials are utilized in high-precision actuators and adaptive control systems, especially in defense and industrial automation. Phase change materials are gaining importance in thermal energy management and smart construction technologies. Electrochromic materials are being deployed in smart windows, automotive rearview mirrors, and energy-efficient displays. The others category comprises emerging adaptive composites and multifunctional polymers designed for advanced niche applications.
- For instance, CeramTec’s lead-free piezoceramics are used in ultrasonic sensors and industrial applications, offering stable and durable performance for precise flow measurement and actuation.
By Application Segment
By application, actuators and motors lead in market adoption due to strong demand from the automotive, aerospace, and industrial machinery sectors. Transducers and sensors are critical to the expanding use of smart materials in medical diagnostics, environmental monitoring, and wearable electronics. The structural materials segment is seeing growth with increased implementation in smart infrastructure and civil engineering projects. The others category includes specialized applications across packaging, consumer products, and defense. The Global Smart Materials Market benefits from this broad and evolving application scope, with each segment contributing to the rising demand for responsive, efficient, and multifunctional materials.
- For instance, Honeywell environmental sensors are deployed in global air quality monitoring networks, delivering real-time, high-uptime data for environmental and health applications.
Segmentation:
By Type
- Piezoelectric Materials
- Shape Memory Materials
- Electro Strictive Materials
- Magneto Strictive Materials
- Phase Change Materials
- Electrochromic Materials
- Others
By Application
- Actuators & Motors
- Transducers
- Sensors
- Structural Materials
- Others
By Region
- North America
- Europe
- Asia Pacific
- Latin America
- Middle East
- Africa
Regional Analysis:
North America
The North America Smart Materials Market size was valued at USD 21,616.30 million in 2018 to USD 28,024.56 million in 2024 and is anticipated to reach USD 51,529.36 million by 2032, at a CAGR of 8.0% during the forecast period. North America leads the Global Smart Materials Market with a 36% share in 2024. Strong demand from aerospace, defense, healthcare, and automotive sectors continues to drive adoption. The U.S. dominates regional growth due to high R&D activity and integration of smart technologies into advanced manufacturing. Applications in energy harvesting, adaptive structures, and biomedical devices remain prominent. It benefits from robust innovation ecosystems and government-backed research funding. Market maturity and early adoption place the region at the forefront of global deployment.
Europe
The Europe Smart Materials Market size was valued at USD 12,698.84 million in 2018 to USD 15,873.07 million in 2024 and is anticipated to reach USD 27,230.69 million by 2032, at a CAGR of 7.0% during the forecast period. Europe holds about 21% of the market, supported by high standards in precision engineering and sustainability-focused policies. Germany, the U.K., and France are major contributors due to their strong industrial bases and smart infrastructure initiatives. The region is actively applying smart materials in green buildings, EVs, aerospace structures, and energy-efficient systems. It leverages EU-backed programs and collaborative research hubs. Demand for responsive materials is rising across automotive and construction applications. It continues to advance through strong regulatory frameworks and innovation-led strategies.
Asia Pacific
The Asia Pacific Smart Materials Market size was valued at USD 17,552.20 million in 2018 to USD 23,870.41 million in 2024 and is anticipated to reach USD 47,715.41 million by 2032, at a CAGR of 9.1% during the forecast period. Asia Pacific is the fastest-growing region, accounting for 31% of the market in 2024. China, Japan, South Korea, and India are fueling rapid expansion through smart city projects, advanced electronics, and high-volume manufacturing. The region benefits from government incentives, low-cost production, and growing demand for next-generation consumer devices. Adoption of piezoelectric and electrochromic materials is rising in automotive and consumer tech. It is a key production hub for global electronics and is expanding into smart infrastructure and medical applications. Regional players are scaling innovation to meet local and global demand.
Latin America
The Latin America Smart Materials Market size was valued at USD 3,015.68 million in 2018 to USD 3,910.05 million in 2024 and is anticipated to reach USD 6,556.05 million by 2032, at a CAGR of 6.7% during the forecast period. Latin America holds a 5% market share, with Brazil and Mexico leading in automotive, industrial automation, and healthcare applications. Adoption of smart coatings, sensors, and structural materials is growing slowly but steadily. Governments are investing in infrastructure modernization that supports smart technologies. It faces limitations in local production and R&D capacity but gains from technology imports and global partnerships. Energy efficiency initiatives are helping integrate advanced materials in urban development. The region shows promise for long-term market development.
Middle East
The Middle East Smart Materials Market size was valued at USD 2,291.21 million in 2018 to USD 2,820.55 million in 2024 and is anticipated to reach USD 4,696.89 million by 2032, at a CAGR of 6.6% during the forecast period. The Middle East represents 4% of the market and is gaining traction through large-scale infrastructure and diversification initiatives. Countries like the UAE and Saudi Arabia are incorporating smart materials into building technologies, energy projects, and public infrastructure. It supports applications in smart coatings, responsive systems, and advanced materials in defense. Regional governments emphasize digital transformation and sustainable growth. Strategic alliances with international firms are supporting market development. It continues to build capacity through foreign investment and innovation centers.
Africa
The Africa Smart Materials Market size was valued at USD 1,725.77 million in 2018 to USD 2,790.45 million in 2024 and is anticipated to reach USD 4,577.89 million by 2032, at a CAGR of 6.1% during the forecast period. Africa holds 3% of the market, with growth concentrated in South Africa and Egypt. Demand is rising in energy, healthcare, and smart infrastructure sectors. Governments are beginning to adopt smart materials in projects related to sustainability, water management, and resilient construction. It faces structural challenges such as limited R&D funding, reliance on imports, and lower industrial penetration. However, education and innovation programs are expanding. It is gradually positioning itself for long-term participation in the smart materials value chain.
Shape Your Report to Specific Countries or Regions & Enjoy 30% Off!
Key Player Analysis:
- Kyocera Corporation
- TDK Corporation
- CHANNELL COMMERCIAL CORPORATION
- Parker Hannifin Corp (LORD Corporation)
- Wright Medical Group N.V.
- CeramTec GmbH
- APC International Ltd.
- CTS Corporation
Competitive Analysis:
The Global Smart Materials Market is highly competitive, with key players focusing on innovation, product development, and strategic partnerships to strengthen their market position. Companies such as Kyocera Corporation, TDK Corporation, Parker Hannifin Corp (LORD Corporation), and CeramTec GmbH lead the landscape by offering diversified product portfolios across piezoelectric, electrostrictive, and shape memory materials. The market sees constant investment in R&D to support advanced applications in aerospace, healthcare, automotive, and electronics. Players are expanding production capacities and pursuing mergers to gain technological advantages and global reach. It remains dynamic, with both established firms and emerging entrants competing on performance, reliability, and material adaptability. Intellectual property strength and custom-engineered solutions play a crucial role in maintaining competitive differentiation. Regional expansion strategies, especially in Asia Pacific and North America, continue to shape market leadership. The Global Smart Materials Market reflects a technology-driven ecosystem where innovation and application-specific expertise define success.
Recent Developments:
- In June 2025, TDK Corporation completed the acquisition of the RF power business from QEI Corporation, a provider of RF power solutions for semiconductor manufacturing. This strategic acquisition strengthens TDK’s position in the semiconductor equipment market, enhancing its power solution offerings and supporting the expanding needs of AI, IoT, and data center industries.
- In June 2025, Prysmian finalized the acquisition of Channell Commercial Corporation, a leading U.S.-based manufacturer of thermoplastic enclosures and fiber management solutions. This $950 million deal positions Prysmian as a comprehensive provider of end-to-end Fiber-to-the-Home (FTTH) solutions in North America, integrating Channell’s innovative infrastructure components with Prysmian’s optical cable products.
- In May 2025, Kyocera Corporation launched the G7A Series, a new air-cooled UV LED light source. This product stands out as one of the smallest in its class and is designed for high-performance curing applications such as ink, resin, and adhesive processes. The G7A Series, available from June 2025, emphasizes energy efficiency, compactness, and reduced environmental impact, addressing the growing demand for sustainable manufacturing solutions.
- In May 2025, APC International Ltd. entered a new sales cooperation for the Americas with Smart Material Corp. Under this partnership, APC will handle all orders and distribution for Smart Material’s products in the USA, Canada, and South America. This collaboration aims to improve service quality and response times for customers in the region.
Market Concentration & Characteristics:
The Global Smart Materials Market exhibits moderate to high market concentration, with a mix of dominant multinational corporations and specialized niche players. It is characterized by strong technological orientation, high entry barriers, and continuous innovation cycles. Leading companies maintain competitive advantage through proprietary technologies, long-term contracts, and broad application portfolios. The market favors firms with advanced R&D capabilities and the ability to deliver customized solutions across sectors such as aerospace, healthcare, automotive, and electronics. It responds rapidly to shifts in end-user demand, regulatory changes, and material performance standards. The presence of strategic alliances, licensing agreements, and cross-industry collaborations also defines its structural dynamics.
Report Coverage:
The research report offers an in-depth analysis based on product and application. It details leading market players, providing an overview of their business, product offerings, investments, revenue streams, and key applications. Additionally, the report includes insights into the competitive environment, SWOT analysis, current market trends, as well as the primary drivers and constraints. Furthermore, it discusses various factors that have driven market expansion in recent years. The report also explores market dynamics, regulatory scenarios, and technological advancements that are shaping the industry. It assesses the impact of external factors and global economic changes on market growth. Lastly, it provides strategic recommendations for new entrants and established companies to navigate the complexities of the market.
Future Outlook:
- The Global Smart Materials Market is projected to experience steady growth driven by rising demand across aerospace, automotive, healthcare, and industrial automation sectors.
- Integration of smart materials with AI, IoT, and digital twin technologies will enhance system-level performance and real-time adaptability.
- Miniaturization trends and flexible electronics will expand usage in wearable devices, soft robotics, and consumer applications.
- Governments and private sectors will increase funding in smart infrastructure and sustainable construction using advanced materials.
- Healthcare applications will continue to grow, with smart polymers and shape memory alloys supporting personalized treatment and minimally invasive devices.
- Emerging economies in Asia Pacific, Middle East, and Africa will see rapid adoption due to infrastructure expansion and rising manufacturing capabilities.
- Environmental regulations will accelerate demand for energy-efficient, recyclable, and self-healing materials in packaging and building sectors.
- Market players will prioritize R&D partnerships and licensing deals to commercialize new materials faster and secure IP advantages.
- Automation and digital manufacturing will reduce production costs, allowing broader accessibility for mid-tier industries.
- Competitive intensity will increase as startups and research institutions introduce disruptive technologies targeting niche applications.


