Market Overview
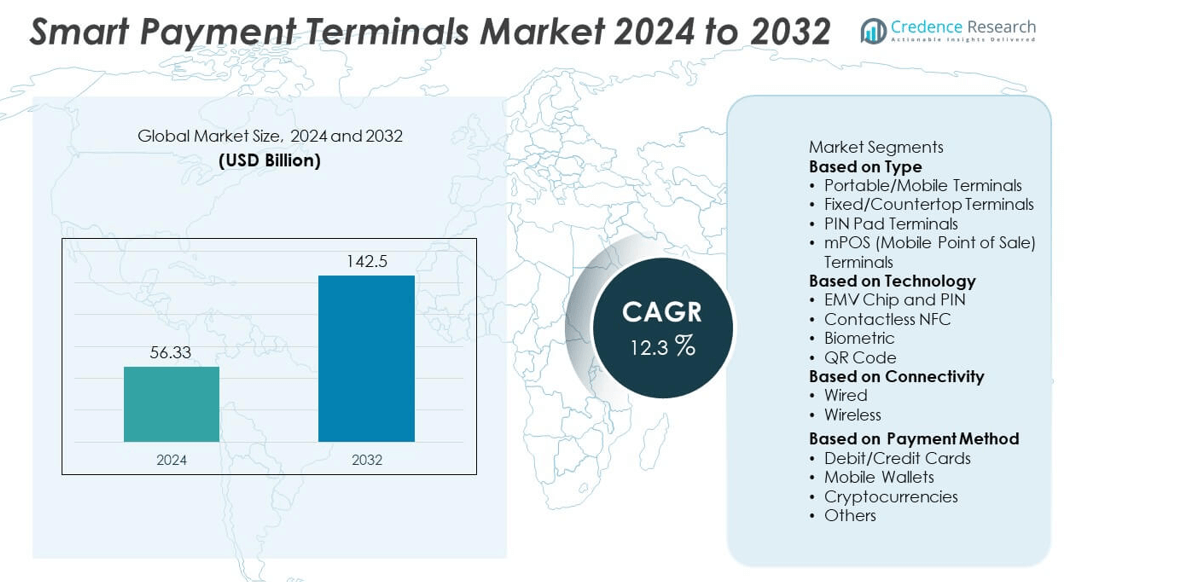
The Smart Payment Terminals market size was valued at USD 56.33 billion in 2024 and is projected to reach USD 142.5 billion by 2032, growing at a CAGR of 12.3% during the forecast period.
| REPORT ATTRIBUTE |
DETAILS |
| Historical Period |
2020-2023 |
| Base Year |
2024 |
| Forecast Period |
2025-2032 |
| Smart Payment Terminals Market Size 2024 |
USD 56.33 billion |
| Smart Payment Terminals Market, CAGR |
12.3% |
| Smart Payment Terminals Market Size 2032 |
USD 142.5 billion |
The Smart Payment Terminals market is led by key players such as Verifone, Ingenico, PAX Global Technology, Square (Block, Inc.), Clover Network, NCR Corporation, Diebold Nixdorf, SumUp, Castles Technology, and PayPal Zettle. These companies focus on delivering advanced payment solutions with strong security, contactless functionality, and omnichannel integration to support global digital payment adoption. Regionally, North America accounted for 34% share in 2024, driven by strong fintech penetration and rapid adoption of contactless transactions. Asia-Pacific followed with 31% share, supported by mobile-first economies and rising e-commerce, while Europe held 28%, reflecting regulatory support and high consumer trust in digital payments.
Market Insights
- The Smart Payment Terminals market was valued at USD 56.33 billion in 2024 and is projected to reach USD 142.5 billion by 2032, expanding at a CAGR of 12.3% during the forecast period.
- Growing demand for contactless and mobile payments is driving adoption, with portable/mobile terminals holding over 40% share in 2024 due to their flexibility and suitability for retail and hospitality sectors.
- Trends highlight the integration of biometric authentication, NFC, and cloud-based payment platforms, enabling faster, more secure, and personalized transactions across global markets.
- Competition is led by Verifone, Ingenico, PAX Global Technology, Square, Clover Network, NCR Corporation, Diebold Nixdorf, and others, with strategies focused on innovation, partnerships, and expanding digital wallet compatibility to strengthen global presence.
- Regionally, North America led with 34% share in 2024, followed by Asia-Pacific at 31% and Europe at 28%, while Latin America and Middle East & Africa accounted for 5% and 2% respectively.
Access crucial information at unmatched prices!
Request your sample report today & start making informed decisions powered by Credence Research Inc.!
Download Sample
Market Segmentation Analysis:
By Type
Portable/mobile terminals dominated the smart payment terminals market in 2024 with over 40% share, driven by their flexibility and growing use in retail, hospitality, and transportation sectors. The rise of small businesses and on-the-go payment solutions boosts adoption, especially in emerging economies where mobile commerce is expanding rapidly. Fixed/countertop terminals remain relevant in supermarkets and large retail chains, while PIN pad terminals serve as add-ons for secure payments. mPOS solutions are gaining momentum due to low setup costs and integration with smartphones, but portable/mobile terminals continue to lead growth.
- For instance, Verifone manufactures and sells a range of portable/mobile payment terminals, including models like the Verifone e285—a standalone mobile point of sale device with Wi-Fi and optional cellular connectivity for secure payments anywhere.
By Technology
EMV chip and PIN technology led the market with over 45% share in 2024, supported by its global standardization for secure card transactions. The shift from magnetic stripe systems to chip-enabled payments has been accelerated by regulatory mandates and fraud reduction initiatives. Contactless NFC technology is gaining rapid traction, fueled by consumer demand for fast, touch-free transactions. Biometric authentication and QR code payments are also emerging, particularly in Asia-Pacific, but remain smaller segments. Despite rising alternatives, EMV chip and PIN maintains dominance due to its proven security and compliance benefits.
- For instance, Ingenico’s smart terminals processed a high volume of EMV chip and PIN payment transactions in 2024 as part of its business operations, with active deployment in over 70 countries worldwide.
By Connectivity
Wireless connectivity dominated the market in 2024 with over 55% share, driven by the expansion of mobile commerce, cloud-based payment platforms, and digital wallets. Wireless-enabled smart terminals offer retailers greater mobility, seamless integration with e-commerce platforms, and improved customer experience. Growth in 4G/5G networks and Wi-Fi availability has accelerated adoption in both developed and emerging markets. Wired terminals continue to serve high-volume, fixed-location businesses such as supermarkets and financial institutions, ensuring reliability. However, wireless solutions remain dominant as businesses increasingly prioritize flexibility, mobility, and integration with omnichannel payment ecosystems.
Market Overview
Rising Adoption of Contactless Payments
The shift toward cashless economies is a major driver for the smart payment terminals market. In 2024, over 55% of global in-store transactions used contactless methods, supported by consumer demand for speed and convenience. Governments and financial institutions are promoting secure digital payment frameworks, further accelerating adoption. Retailers and service providers prefer NFC-enabled and mobile-compatible terminals to enhance customer experience. The widespread use of digital wallets like Apple Pay, Google Pay, and Alipay strengthens this trend, positioning contactless solutions as the primary growth driver for terminal adoption worldwide.
- For instance, Mastercard reported strong growth in contactless transactions in 2024, reflecting widespread consumer preference and enabling millions of merchants to enhance checkout speed and security.
Expansion of E-commerce and mPOS Solutions
The growth of e-commerce and mobile-based transactions is fueling demand for smart payment terminals, particularly mPOS and portable devices. SMEs and micro-merchants increasingly adopt mPOS due to their affordability, ease of integration, and ability to support omnichannel operations. In 2024, mobile terminals accounted for more than 40% of shipments, reflecting their growing preference among small retailers and delivery services. The surge in online-to-offline (O2O) commerce and gig economy transactions further strengthens demand. This expansion drives innovation in portable terminals, enhancing scalability and accessibility for diverse retail environments.
- For instance, Square (Block Inc.) reported that more than 4 million sellers were using its ecosystem in 2024, processing $228 billion in payments. The company provides a variety of mPOS hardware and software options to support these small and micro-businesses
Regulatory Push for Secure Transactions
Regulatory mandates promoting EMV compliance, PCI DSS standards, and fraud-prevention frameworks are significantly driving the smart payment terminals market. EMV chip and PIN solutions held over 45% share in 2024, highlighting regulatory influence on adoption. Governments in regions such as North America, Europe, and Asia-Pacific continue to enforce strict guidelines for transaction security, reducing risks of data theft and card fraud. Compliance requirements encourage businesses to upgrade to advanced terminals with encryption, tokenization, and biometric authentication. This push not only ensures security but also drives steady replacement demand across industries.
Key Trends & Opportunities
Integration of Biometric Authentication
Biometric-enabled smart payment terminals are emerging as a strong trend, enhancing both security and convenience. Fingerprint and facial recognition technologies allow faster, more secure transactions compared to traditional PINs. Adoption is gaining traction in regions like Asia-Pacific and Europe, where biometric authentication is increasingly integrated into banking and retail systems. The growth of identity-based payments in high-security environments, such as airports and government services, presents new opportunities. As consumers prioritize secure yet seamless transactions, biometrics are set to play a vital role in next-generation payment ecosystems.
- For instance, JPMorgan’s proprietary Paypad and Pinpad terminals, which support biometric payments via facial recognition and infrared palm vein scanning, were announced and debuted at the NRF 2025 event in New York City in early 2025.
Rise of Cloud-Based Payment Platforms
Cloud integration is creating opportunities for flexible, scalable smart payment terminals. Retailers and service providers are increasingly adopting cloud-based payment ecosystems that support real-time analytics, remote updates, and multi-device integration. Wireless terminals linked to cloud platforms held over 55% share in 2024, underscoring this trend. Cloud services enable merchants to manage transactions across multiple locations, simplify compliance, and offer personalized promotions. The ability to integrate payments with customer data also supports loyalty programs, making cloud-based terminals a critical enabler of digital transformation in retail and financial services.
- For instance, Shift4’s cloud platform processes billions of transactions annually for hundreds of thousands of businesses globally, and the company confirmed its full-year 2024 end-to-end payment volume was $164.8 billion. This platform integrates payment processing with analytics and marketing tools, enabling merchants to run targeted campaigns.
Key Challenges
High Deployment and Upgrade Costs
The cost of deploying advanced smart payment terminals remains a key challenge, particularly for SMEs and businesses in emerging economies. Hardware, software integration, and compliance upgrades require significant capital investments. For example, transitioning from magnetic stripe readers to EMV-enabled terminals has raised expenses for small retailers. Although long-term benefits include enhanced security and operational efficiency, the upfront costs restrain adoption in price-sensitive markets. The challenge is further intensified by the need for continuous upgrades to support new technologies like NFC, biometrics, and QR-based payments.
Cybersecurity and Data Privacy Risks
Smart payment terminals face growing risks of data breaches, malware, and fraudulent attacks, which undermine consumer trust. The reliance on cloud connectivity and wireless systems increases exposure to cyber threats. In 2024 alone, payment-related cyberattacks rose by over 20% globally, highlighting the severity of this issue. Merchants and providers must invest heavily in encryption, tokenization, and secure networks to protect sensitive customer data. Compliance with global data protection laws, including GDPR and PCI DSS, adds complexity and cost. Failure to ensure security could limit adoption and slow market growth.
Regional Analysis
North America
North America held 34% share of the smart payment terminals market in 2024, driven by strong adoption of contactless payments, EMV chip compliance, and mobile wallet integration. The U.S. leads the region with extensive use of portable and countertop terminals in retail, hospitality, and banking sectors. Canada contributes with accelerated adoption of wireless and NFC-enabled devices supported by government initiatives promoting digital transactions. High consumer preference for secure, cashless payments and strong investments in fintech infrastructure further reinforce North America’s leadership in the global market, supported by established payment solution providers.
Europe
Europe accounted for 28% share in 2024, supported by strict regulatory frameworks such as PSD2, GDPR, and EMV mandates that drive secure transaction adoption. The U.K., Germany, and France dominate demand, particularly with widespread use of mPOS and NFC-based terminals across retail and transport sectors. Growing focus on biometric-enabled payments is further enhancing market growth. Strong partnerships between banks, retailers, and fintech providers expand the use of advanced payment solutions. The increasing shift toward digital banking and cashless societies makes Europe a major contributor to global smart payment terminal adoption.
Asia-Pacific
Asia-Pacific led the smart payment terminals market with 31% share in 2024, driven by rapid urbanization, booming e-commerce, and widespread use of QR code and NFC payments. China dominates with large-scale adoption of mobile and mPOS terminals supported by Alipay and WeChat Pay ecosystems. India shows strong growth through government-backed digital payment initiatives and rising smartphone penetration. Japan and South Korea contribute through advanced biometric and contactless payment innovations. The region’s expanding SME sector and preference for portable and wireless terminals position Asia-Pacific as the fastest-growing market for smart payment solutions globally.
Latin America
Latin America captured 4% share of the smart payment terminals market in 2024, with Brazil and Mexico leading demand due to growing adoption of mobile wallets and government-supported cashless initiatives. Retailers and small businesses increasingly rely on mPOS and wireless terminals to improve accessibility and efficiency. Regional fintech startups and partnerships with global payment providers are accelerating adoption. However, challenges such as infrastructure gaps and cost sensitivity limit widespread penetration. Despite these hurdles, rising e-commerce activity and consumer demand for secure, real-time payments continue to drive gradual market expansion in the region.
Middle East & Africa
The Middle East and Africa accounted for 3% share in 2024, reflecting steady adoption of smart payment terminals supported by rapid digital transformation initiatives. Gulf countries, particularly the UAE and Saudi Arabia, are driving growth with large investments in contactless and biometric-enabled payment systems integrated into retail and hospitality sectors. South Africa leads adoption in Africa through fintech-driven solutions aimed at expanding financial inclusion. While limited infrastructure and affordability remain barriers in several nations, growing government support for cashless economies and mobile-first payment models are creating opportunities for future market expansion.
Market Segmentations:
By Type
- Portable/Mobile Terminals
- Fixed/Countertop Terminals
- PIN Pad Terminals
- mPOS (Mobile Point of Sale) Terminals
By Technology
- EMV Chip and PIN
- Contactless NFC
- Biometric
- QR Code
By Connectivity
By Payment Method
- Debit/Credit Cards
- Mobile Wallets
- Cryptocurrencies
- Others
By Geography
- North America
- Europe
- UK
- France
- Germany
- Italy
- Spain
- Russia
- Belgium
- Netherlands
- Austria
- Sweden
- Poland
- Denmark
- Switzerland
- Rest of Europe
- Asia Pacific
- China
- Japan
- South Korea
- India
- Australia
- Thailand
- Indonesia
- Vietnam
- Malaysia
- Philippines
- Taiwan
- Rest of Asia Pacific
- Latin America
- Brazil
- Argentina
- Peru
- Chile
- Colombia
- Rest of Latin America
- Middle East
- UAE
- KSA
- Israel
- Turkey
- Iran
- Rest of Middle East
- Africa
- Egypt
- Nigeria
- Algeria
- Morocco
- Rest of Africa
Competitive Landscape
Competitive landscape in the Smart Payment Terminals market is shaped by leading players including Diebold Nixdorf, Clover Network, Square (Block, Inc.), Ingenico, PAX Global Technology, NCR Corporation, Verifone, SumUp, Castles Technology, and PayPal Zettle. These companies compete by advancing secure, user-friendly, and multi-functional payment solutions that support EMV, NFC, QR code, and biometric technologies. Their strategies focus on enabling seamless transactions across retail, hospitality, and financial services, while strengthening compliance with global payment security standards. Partnerships with banks, fintech firms, and merchants enhance adoption in developed and emerging markets. Players are investing in wireless and cloud-enabled systems to support mobile commerce and omnichannel payments. Growing demand for contactless payments and digital wallets has further intensified innovation, with companies integrating AI and IoT to improve customer insights and fraud detection. Competitive pressure encourages rapid deployment of affordable and scalable devices, positioning these key players as leaders in the global digital payment transformation.
Shape Your Report to Specific Countries or Regions & Enjoy 30% Off!
Key Player Analysis
- Diebold Nixdorf
- Clover Network
- Square (Block, Inc.)
- Ingenico
- PAX Global Technology
- NCR Corporation
- Verifone
- SumUp
- Castles Technology
- PayPal Zettle
Recent Developments
- In August 2025, PAX Global Technology announced its 2025 interim results, stating it will streamline its terminal portfolio and focus on high-demand Android terminals.
- In July 2025, PAX achieved PCI PTS POI v7.0 certification for its A77 MiniPOS—a leading security milestone in payment devices.
- In January 2025, Verifone launched its Victa device line, including biometric authentication and a SoftPOS “Tap” solution.
- In 2025, Square (Block, Inc.) launched Square Handheld POS, a compact all-in-one terminal running its new unified POS app.
Report Coverage
The research report offers an in-depth analysis based on Type, Technology, Connectivity, Payment Method and Geography. It details leading market players, providing an overview of their business, product offerings, investments, revenue streams, and key applications. Additionally, the report includes insights into the competitive environment, SWOT analysis, current market trends, as well as the primary drivers and constraints. Furthermore, it discusses various factors that have driven market expansion in recent years. The report also explores market dynamics, regulatory scenarios, and technological advancements that are shaping the industry. It assesses the impact of external factors and global economic changes on market growth. Lastly, it provides strategic recommendations for new entrants and established companies to navigate the complexities of the market.
Future Outlook
- Demand for contactless and mobile-based payment terminals will continue to grow rapidly.
- Portable and mPOS devices will dominate adoption due to flexibility in retail and hospitality.
- Integration of biometric authentication will strengthen security and customer trust in transactions.
- Cloud-based payment platforms will expand, supporting real-time data and analytics for merchants.
- Partnerships between fintech firms and terminal providers will drive innovation and accessibility.
- Wireless connectivity will overtake wired systems as businesses shift toward mobile-first solutions.
- Asia-Pacific will emerge as the fastest-growing market, driven by e-commerce and mobile wallets.
- Regulatory compliance and global security standards will shape design and adoption strategies.
- Competitive intensity will rise as global players focus on affordability and scalability.
- AI and IoT integration in payment terminals will enhance fraud detection and customer engagement.


