
Market Overview
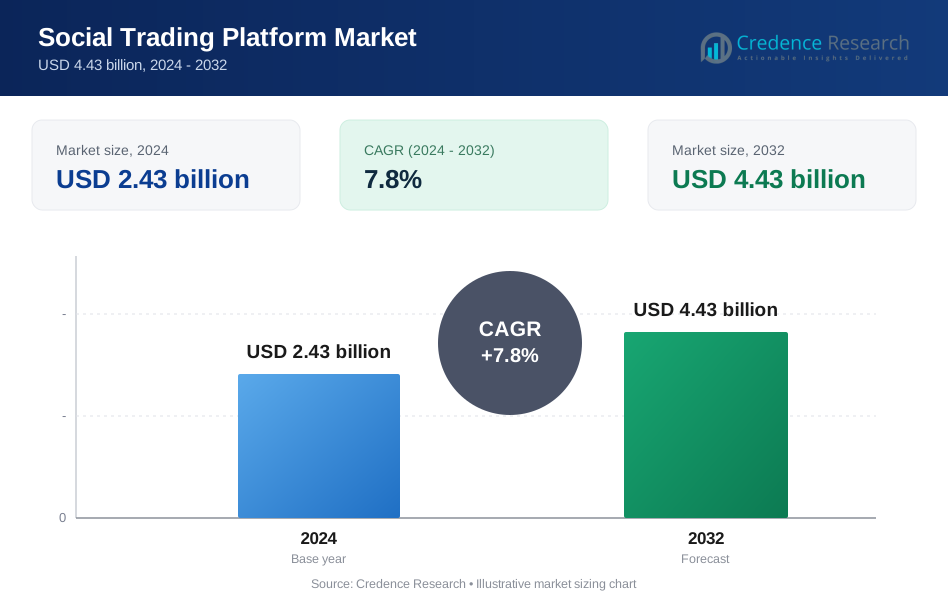
Social trading platform Market was valued at USD 2.43 billion in 2024 and is anticipated to reach USD 4.43 billion by 2032, growing at a CAGR of 7.8% during the forecast period.
| REPORT ATTRIBUTE | DETAILS |
|---|---|
| Historical Period | 2020-2023 |
| Base Year | 2024 |
| Forecast Period | 2025-2032 |
| Social Trading Platform Market Size 2024 | USD 2.43 billion |
| Social Trading Platform Market, CAGR | 7.8% |
| Social Trading Platform Market Size 2032 | USD 4.43 billion |
The Social Trading Platform Market features strong competition among leading players such as TradingView, Pepperstone, AvaTrade, Robinhood, NAGA, Tickmill, Wealthsimple, eToro, MetaTrader 5 (MT5), and OctaFX. These companies focus on expanding user engagement through advanced analytics, community-based trading tools, and multi-asset accessibility. eToro and NAGA lead in copy-trading and social interaction features, while TradingView dominates in collaborative charting and analysis. Robinhood and Wealthsimple drive retail adoption through commission-free models and intuitive interfaces. MetaTrader 5 (MT5) and Pepperstone enhance professional trading with algorithmic and forex capabilities. North America leads the global market with a 37.4% share, supported by high digital penetration, regulatory maturity, and strong adoption among retail investors.
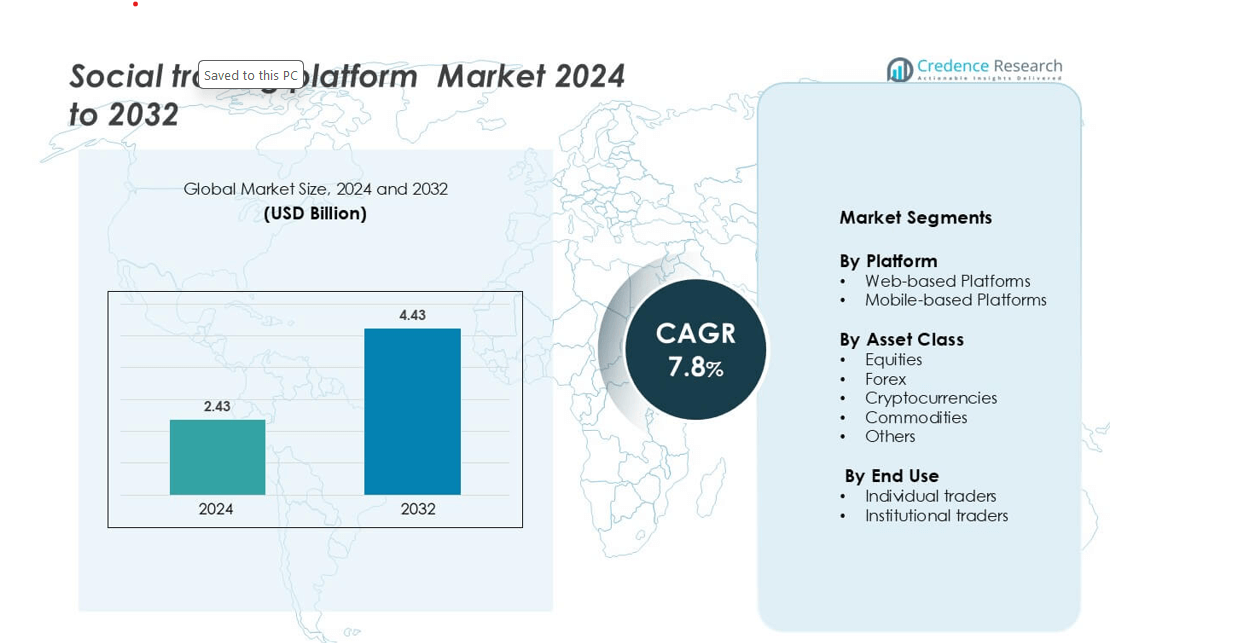
Market Insights
- The Social Trading Platform Market was valued at USD 2.43 billion in 2024 and is projected to grow at a CAGR of 7.8% from 2025 to 2032, driven by expanding digital trading ecosystems.
- Rising retail participation and adoption of AI-powered analytics tools are key market drivers enhancing transparency and decision-making efficiency.
- Growing popularity of mobile-based platforms and cryptocurrency integration defines current market trends, improving accessibility and user engagement.
- Competitive dynamics feature major players such as eToro, TradingView, Robinhood, and NAGA, focusing on innovation, social engagement, and cross-asset integration.
- North America holds the largest regional share of 37.4%, followed by Europe with 29.1%, while web-based platforms lead by 56.3% share and individual traders dominate end-use with 64.1% share globally.
Market Segmentation Analysis:
By Platform
Web-based platforms dominated the Social Trading Platform Market with a 56.3% share in 2024. Their leadership is driven by robust analytics, real-time dashboards, and advanced portfolio tracking. These platforms enable broader accessibility through desktop browsers, supporting institutional and professional users. Seamless integration with brokerage APIs and charting tools enhances user decision-making. The demand for detailed analytics and social features like community leaderboards strengthens engagement. Enhanced security and scalable data infrastructure also boost reliability, making web-based platforms the preferred choice among traders globally.
- For instance, TradingView publicly states it has over 100 million users. Other sources suggest a user base of over 50 million as of 2024, with around 200 million monthly visits.
By Asset Class
The forex segment led the market with a 38.5% share in 2024, supported by high liquidity and 24-hour trading opportunities. Social trading platforms simplify forex strategies through signal copying and algorithmic integration. Users can follow experienced traders and execute synchronized trades in real time. Continuous data flow and rapid execution make forex ideal for active traders. Platform providers offer AI-based predictive analytics and sentiment indicators to improve accuracy. The accessibility of leveraged instruments and diversified currency pairs further strengthens forex dominance within the market.
- For instance, Pepperstone’s trading infrastructure processes over 5.4 billion trades annually with an average execution speed of 30 milliseconds.
By End Use
Individual traders accounted for 64.1% of the market share in 2024, fueled by rising interest in digital investing and peer-learning ecosystems. Social trading platforms enable beginners to replicate expert portfolios and gain exposure to multiple asset classes. User-friendly interfaces, gamified experiences, and mobile accessibility drive adoption. Platform providers support education tools, performance transparency, and low minimum deposits, empowering retail users. The growing presence of influencer-led trading communities and subscription-based mentorship models further accelerates participation among individual investors.
Key Growth Drivers
Expansion of Retail Participation in Online Trading
The Social Trading Platform Market is expanding rapidly due to the surge in retail investor participation. Technological advancements and low entry barriers have made trading accessible to a wider audience. Retail traders now use social platforms to follow professional investors, replicate strategies, and share insights. The rise of commission-free brokerage models and real-time market access enhances engagement. Gamified interfaces and community-driven interactions also attract millennials and Gen Z traders. These factors foster continuous growth in user adoption, increasing overall trading volumes and platform monetization potential across global markets.
- For instance, eToro reported over 35 million registered users across 100 countries, with more than 2.1 million active traders replicating expert portfolios through its CopyTrader feature.
Growing Adoption of Cryptocurrencies and Digital Assets
The increasing popularity of cryptocurrencies significantly drives growth in the Social Trading Platform Market. Digital assets like Bitcoin and Ethereum attract both retail and institutional investors seeking diversification and short-term gains. Social trading platforms simplify crypto trading through copy trading and sentiment-driven strategies. Integrated wallets and real-time blockchain analytics enhance user confidence and transparency. Regulatory acceptance in several economies and the expansion of crypto derivatives trading further support growth. The integration of decentralized finance (DeFi) tools and tokenized asset classes widens platform capabilities and revenue potential.
- For instance, eToro’s crypto-asset offering supports over 100 digital assets and its dedicated exchange arm handles over 100 crypto trading pairs.
Integration of Artificial Intelligence and Analytics Tools
Artificial intelligence (AI) is reshaping the functionality of social trading platforms. AI-driven analytics provide real-time performance tracking, predictive insights, and automated strategy replication. Machine learning models identify successful traders, assess risk exposure, and optimize portfolio allocation. Such integrations enhance transparency and trust among users. Data-driven personalization also improves user retention and engagement. The deployment of AI chatbots for investment guidance and predictive modeling tools empowers both novice and experienced traders, strengthening platform competitiveness. This technological evolution is a key enabler of sustained market expansion.
Key Trends and Opportunities
Rise of Mobile-Based Social Trading Applications
Mobile-based platforms represent a major growth trend in the market. Traders prefer mobile apps for their convenience, speed, and accessibility. Push notifications, in-app analytics, and live market feeds allow users to act instantly. Social integration through chatrooms and influencer-led trade sharing enhances engagement. Fintech developers are focusing on cross-platform synchronization and biometric security to improve user trust. Expanding smartphone penetration and 5G connectivity enable real-time collaboration, providing opportunities for platform providers to attract younger demographics and expand into emerging markets with rising mobile adoption rates.
- For instance, according to TradingView's own Google Play page, the platform provides access to "data in real-time on more than 3,500,000 instruments" from over 100 exchanges worldwide.
Expansion into Emerging Economies and Micro-Investing
Emerging markets present strong opportunities for social trading platforms due to rising financial literacy and digital penetration. Platforms are increasingly targeting users in Asia-Pacific, Latin America, and the Middle East through low-cost trading and micro-investment features. These allow users to start with minimal capital, reducing entry barriers. Strategic partnerships with regional brokers and localized content enhance adoption. Government initiatives promoting digital finance also boost market potential. This expansion broadens the global investor base, driving consistent user growth and fostering inclusivity in digital wealth creation.
- For instance, eToro reported over 40 million registered users across 75 countries and activated its Capital Markets Services licence in Singapore to expand into the Asia-Pacific region.
Key Challenges
Regulatory Compliance and Cross-Border Restrictions
Stringent financial regulations present a major challenge for the Social Trading Platform Market. Platforms must comply with varying jurisdictional laws related to financial advice, licensing, and user data protection. Differences between regulatory frameworks in the U.S., EU, and Asia create operational complexity. Non-compliance can result in penalties, license suspensions, or restricted market access. Adapting to evolving crypto regulations further complicates cross-border operations. To mitigate risks, platforms invest in compliance automation, identity verification systems, and transparent user disclosures. However, these measures increase costs and slow expansion timelines.
Data Privacy and Security Concerns
Data breaches and cyberattacks pose significant risks to social trading platforms. The exchange of sensitive financial data between users, brokers, and third-party systems increases vulnerability. Hackers target platforms to exploit trading APIs or steal crypto assets. Maintaining trust requires strong encryption, two-factor authentication, and real-time fraud detection mechanisms. Ensuring compliance with data privacy regulations like GDPR adds operational pressure. Repeated security lapses can damage reputation and reduce user confidence. Addressing these concerns through advanced cybersecurity frameworks remains crucial for sustainable platform growth and investor protection.
Regional Analysis
North America
North America dominated the Social Trading Platform Market with a 37.4% share in 2024, supported by advanced financial infrastructure and high digital adoption. The U.S. leads the region due to strong participation from retail investors and widespread use of AI-based trading tools. Platforms benefit from favorable fintech regulations and integration with established brokerage systems. Increasing collaboration between financial institutions and technology providers enhances transparency and engagement. The growing popularity of cryptocurrency trading and influencer-led investment communities further drives market expansion, making North America the hub for innovation in social trading solutions.
Europe
Europe accounted for 29.1% of the market share in 2024, driven by high investor confidence and strong regulatory frameworks such as MiFID II. The U.K., Germany, and France remain leading contributors, supported by established fintech ecosystems. European users favor transparency, risk assessment tools, and educational features integrated into social trading platforms. Sustainable investing and ESG-focused portfolios are gaining traction across the region. Cross-border trading collaborations and partnerships with regulated brokers also support growth. Increased mobile adoption and the rise of community-driven investment platforms continue to strengthen Europe’s position in the global market.
Asia-Pacific
Asia-Pacific held a 22.6% share in the Social Trading Platform Market in 2024, led by China, Japan, India, and Australia. Rapid digitalization, smartphone penetration, and the rise of retail trading apps contribute to growth. Millennials and Gen Z investors increasingly adopt social trading for learning and portfolio diversification. Government initiatives promoting digital finance and the popularity of cryptocurrency trading further enhance adoption. Local fintech startups and brokerages collaborate to offer multilingual, low-fee platforms tailored for regional users. Asia-Pacific remains the fastest-growing region, with significant opportunities for expansion in emerging economies.
Latin America
Latin America captured 6.2% of the market share in 2024, with Brazil and Mexico leading adoption. The region’s growth is driven by increasing smartphone usage and rising financial literacy. Social trading platforms appeal to first-time investors through simplified interfaces and community-based learning. Expansion of digital payment systems and lower brokerage costs further encourage participation. Localized content and partnerships with regional financial institutions enhance trust and accessibility. Despite challenges like regulatory uncertainty, the region’s young investor base and growing interest in cryptocurrencies are fueling steady growth in platform engagement and transaction volumes.
Middle East & Africa
The Middle East and Africa accounted for 4.7% of the market share in 2024, driven by increasing demand for online investment and fintech innovation. The UAE, Saudi Arabia, and South Africa are key markets with expanding regulatory support for digital finance. Platforms focusing on Sharia-compliant investment models and low-cost trading gain traction. Rising internet connectivity and smartphone use accelerate adoption among retail investors. Educational initiatives and partnerships with regional brokers foster awareness and trust. Although market maturity remains limited, improving infrastructure and cross-border collaborations position the region for long-term growth.
Market Segmentations:
By Platform
- Web-based Platforms
- Mobile-based Platforms
By Asset Class
- Equities
- Forex
- Cryptocurrencies
- Commodities
- Others
By End Use
- Individual traders
- Institutional traders
By Geography
- North America
- U.S.
- Canada
- Mexico
- Europe
- Germany
- France
- U.K.
- Italy
- Spain
- Rest of Europe
- Asia Pacific
- China
- Japan
- India
- South Korea
- South-east Asia
- Rest of Asia Pacific
- Latin America
- Brazil
- Argentina
- Rest of Latin America
- Middle East & Africa
- GCC Countries
- South Africa
- Rest of the Middle East and Africa
Competitive Landscape
The social trading platform market is dynamic, driven by technological innovation, community engagement, and accessibility-focused strategies. eToro and NAGA lead the market with extensive copy trading networks, integrating advanced analytics and AI-driven portfolio insights to enhance user profitability. TradingView and MetaTrader 5 (MT5) dominate in charting and technical analysis tools, offering seamless social integration for collaborative strategy sharing. Robinhood and Wealthsimple attract retail investors through commission-free trading and user-friendly mobile platforms that blend investing with social interaction. AvaTrade, Tickmill, and OctaFX focus on transparency and regulated environments, appealing to both novice and professional traders. Pepperstone differentiates with low-latency execution and integration of social trading APIs for enhanced trader connectivity. Companies are prioritizing educational tools, gamification, and community engagement features to expand their user base. Strategic partnerships, fintech innovation, and multi-asset support continue to shape competition in this fast-evolving, investor-centric trading ecosystem.
Key Player Analysis
- TradingView
- Pepperstone
- AvaTrade
- Robinhood
- NAGA
- Tickmill
- Wealthsimple
- eToro
- MetaTrader 5 (MT5)
- OctaFX
Recent Developments
- In September 2025, Robinhood launched a new social trading platform explicitly designed to compete with communities like those on Reddit. This platform allows users to share live positions and trading performance, making trading activity more visible and collaborative.
- In November 2024, Solana's Tensor revealed its plans for Vector.fun, a novel vertical in social trading, aimed to dethrone other incumbents such as Pump.fun. The goal is to create a mobile-friendly application that integrates social interactions and trades tokens in all existing Blockchain ecosystems. It will allow people to trade cryptocurrencies while socializing using memes and discussing trading techniques
Report Coverage
The research report offers an in-depth analysis based on Platform, Asset class, End-Use and Geography. It details leading market players, providing an overview of their business, product offerings, investments, revenue streams, and key applications. Additionally, the report includes insights into the competitive environment, SWOT analysis, current market trends, as well as the primary drivers and constraints. Furthermore, it discusses various factors that have driven market expansion in recent years. The report also explores market dynamics, regulatory scenarios, and technological advancements that are shaping the industry. It assesses the impact of external factors and global economic changes on market growth. Lastly, it provides strategic recommendations for new entrants and established companies to navigate the complexities of the market.
Future Outlook
- Social trading platforms will see wider retail participation through simplified user interfaces and mobile access.
- Artificial intelligence will enhance trade automation, performance tracking, and predictive analytics.
- Integration with cryptocurrency exchanges will expand platform utility across digital asset trading.
- Regulatory clarity across major markets will improve investor confidence and cross-border operations.
- Gamified learning tools and community-driven mentorship will attract new and younger investors.
- API-based integrations with brokerage and robo-advisory services will streamline multi-asset trading.
- Increased adoption of decentralized finance features will support tokenized asset sharing and staking.
- Cloud-based infrastructure will improve scalability, data security, and real-time trading reliability.
- Strategic alliances between fintech firms and financial institutions will strengthen ecosystem expansion.
- Growing demand for transparency and ESG-compliant investment strategies will shape future platform offerings.
Request a Free Sample
Fill in your details and we'll send you a free sample report.
- Sample data tables & charts
- Research methodology
Need a Custom Version of This Report?
Tailor the scope, geography, or segments to your exact requirements.
- Custom geography or segment scope
- Direct access to our analyst team
Frequently Asked Questions
What is the current market size for the Social Trading Platform Market, and what is its projected size in 2032?
At what Compound Annual Growth Rate is the Social Trading Platform Market projected to grow between 2025 and 2032?
Which segment held the largest share in 2024?
What are the primary factors fueling the growth of the Social Trading Platform Market?
Who are the leading companies in the Social Trading Platform Market?
Which region commanded the largest share of the Social Trading Platform Market in 2024?
Table of Content
Chapter 1. Report Introduction
- 1.1 Report Description & Purpose
- 1.1.1 Report Title & Market Definition
- 1.1.2 Unique Selling Propositions (USP) & Key Differentiators
- 1.1.3 Value Proposition for Stakeholders
- 1.2 Research Objectives
- 1.2.1 Market Sizing Objectives (Volume & Revenue)
- 1.2.2 Segmentation Objectives
- 1.2.3 Competitive Intelligence Objectives
- 1.2.4 Forecast & Scenario Objectives
- 1.3 Report Scope
- 1.3.1 Social Trading Platform Scope – Types & Subtypes Covered
- 1.3.2 Geographic Scope – Regions & Countries Covered
- 1.3.3 Historical Period, Base Year & Forecast Period (2024; forecast to 2032)
- 1.3.4 Inclusions & Exclusions
- 1.4 HS Code & Classification Framework
- 1.5 Currency, Units & Pricing Basis
- 1.6 Target Stakeholders
- 1.7 Limitations & Assumptions
Chapter 2. Executive Summary
- 2.1 Global Social Trading Platform Market Snapshot
- 2.1.1 Market Size – Historical (2024) & Forecast (2024-2032) (2024: USD 2.43 billion → 2032: USD 4.43 billion)
- 2.1.2 Volume & Revenue – Global Totals
- 2.1.3 Key Market Highlights – Top Five Facts
- 2.2 Social Trading Platform Market Segmentation Snapshot
- 2.2.1 Market Split by Region – 2024 vs. 2032
- 2.3 Competitive Snapshot
- 2.3.1 Top 10 Players by Revenue Share – 2024
- 2.3.2 Top 10 Players by Volume Share – 2024
- 2.3.3 Recent Strategic Developments (18-Month Summary)
- 2.4 Key Investment Highlights & Strategic Conclusions
Chapter 3. Social Trading Platform Market Dynamics & Industry Analysis
- 3.1 Market Overview & Context
- 3.1.1 Social Trading Platform Market Position in the Broader Automotive Value Chain
- 3.1.2 OEM vs. Replacement Market Dynamics
- 3.1.3 Market Maturity & Development Stage by Region
- 3.2 Social Trading Platform Market Drivers
- 3.3 Social Trading Platform Market Restraints & Challenges
- 3.4 Social Trading Platform Market Opportunities
- 3.5 Porter's Five Forces Analysis
- 3.5.1 Threat of New Entrants
- 3.5.2 Bargaining Power of Suppliers
- 3.5.3 Bargaining Power of Buyers
- 3.5.4 Threat of Substitutes
- 3.5.5 Competitive Rivalry – Intensity Assessment
- 3.6 Social Trading Platform Value Chain Analysis
- 3.6.1 Upstream – Raw Material/Input Suppliers
- 3.6.1.1 Raw Material/Input 1
- 3.6.1.2 Raw Material/Input 2
- 3.6.1.3 Raw Material/Input 3
- 3.6.2 Midstream – Production/Manufacturing/Service Delivery
- 3.6.2.1 Production/Process Overview
- 3.6.2.2 Key Facility Locations & Capacity by Manufacturer
- 3.6.3 Downstream – Distribution & End Consumer
- 3.6.3.1 Primary Channel – B2B/OEM
- 3.6.3.2 Secondary Channels – Dealer, Retail, Online, Direct
- 3.6.4 Value Chain Profitability Analysis
- 3.6.1 Upstream – Raw Material/Input Suppliers
- 3.7 PESTEL Analysis
- 3.7.1 Political Factors
- 3.7.2 Economic Factors
- 3.7.3 Social Factors
- 3.7.4 Technological Factors
- 3.7.5 Environmental Factors
- 3.7.6 Legal Factors
- 3.8 Social Trading Platform Supply Chain Analysis
- 3.8.1 Raw Material/Input Supply Risk Assessment
- 3.8.2 Manufacturing Concentration Risk (Geographic Exposure)
- 3.8.3 Trade Disruption Impact Analysis
- 3.9 Regulatory & Policy Landscape
Note: The regulatory and policy landscape section covers regulations based on their applicability to the market, Social Trading Platform category, geography, and scope of the study. Only regulatory frameworks with a material impact on operations, compliance, trade, sustainability, or market access are analyzed in detail.
Chapter 4. Key Investment Pockets & Opportunity Analysis
- 4.1 Social Trading Platform Market Attractiveness Analysis
- 4.1.1 By Region – Investment Attractiveness Matrix (Volume × CAGR)
- 4.2 Absolute Revenue Growth Opportunity
- 4.2.1 By Region – Absolute USD Growth Through 2032
- 4.3 Incremental Volume Opportunity
- 4.3.1 By Region – Incremental Volume Through 2032
- 4.3.2 Segment – Incremental Volume
- 4.4 Emerging Submarket Opportunity Deep Dive (Subject to Applicability)
- 4.5 Emerging Market Opportunity Scorecards
- 4.5.1 United States
- 4.5.2 Europe
- 4.5.3 Asia
- 4.5.4 Middle East & Africa
Note: Emerging Market Opportunity Scorecards will be included based on relevance and strategic importance. Regions listed are indicative and may vary depending on data availability and market dynamics.
Chapter 5. Social Trading Platform Import-Export Analysis & Trade Flows
- 5.1 Global Trade Overview
- 5.1.1 Global Export Value by Country (2024)
- 5.1.2 Global Export Volume by Country (2024)
- 5.1.3 Global Import Value by Country (2024)
- 5.1.4 Global Import Volume by Country (2024)
- 5.1.5 Net Trade Balance by Country (2024)
- 5.2 Export Analysis – Segment
- 5.2.1 Type 1 (HS Code)
- 5.2.2 Type 2 (HS Code)
- 5.2.3 Type 3 (HS Code)
- 5.2.4 Type 4 (HS Code)
- 5.2.5 Type 5 (HS Code)
- 5.3 Import Analysis – Segment
- 5.3.1 Type 1 (HS Code)
- 5.3.2 Type 2 (HS Code)
- 5.3.3 Type 3 (HS Code)
- 5.3.4 Type 4 (HS Code)
- 5.3.5 Type 5 (HS Code)
- 5.4 Average Unit Trade Prices
- 5.4.1 Average Export Price – Segment & Country
- 5.4.2 Average Import Price – Segment & Source Country
- 5.4.3 Price Trends (2024)
- 5.5 Key Trade Route Analysis
- 5.5.1 Trade Route 1
- 5.5.2 Trade Route 2
- 5.5.3 Trade Route 3
- 5.5.4 Trade Route 4
- 5.5.5 Trade Route 5
- 5.6 Trade Policy Impact Assessment
- 5.6.1 US Anti-Dumping & Section 301 Tariffs
- 5.6.2 EU Customs Union Impact
- 5.6.3 Major Free Trade Agreements
- 5.6.4 USMCA Rules of Origin
Note: Trade policy analysis will be included only where relevant to the Social Trading Platform market.
Chapter 6. Competitive Landscape & Company Benchmarking
- 6.1 Social Trading Platform Market Concentration & Structure
- 6.1.1 Herfindahl-Hirschman Index (HHI) – vs. 2024
- 6.1.2 Tier 1, Tier 2 & Tier 3 Market Structure
- 6.1.3 Global, Regional & Local Player Dynamics
- 6.2 Social Trading Platform Market Share Analysis – 2024
- 6.2.1 Global Revenue Share by Company
- 6.2.2 Global Volume Share by Company
- 6.2.3 Regional Revenue Share
- 6.2.4 Market Share Evolution ( vs. 2024)
- 6.2.5 OEM Segment Share by Company
- 6.2.6 Replacement Segment Share by Company
- 6.3 Production/Delivery Capacity & Facility Analysis
- 6.3.1 Global Installed Capacity
- 6.3.2 Capacity Utilization Rates
- 6.3.3 Production/Output Volume
- 6.3.4 Facility Locations & Capacity Map
- 6.3.5 Planned Capacity Additions
- 6.4 Social Trading Platform Competitive Benchmarking Matrix
- 6.4.1 Revenue, Volume, CAGR & Profitability Comparison
- 6.4.2 Channel Revenue Mix
- 6.4.3 Geographic Revenue Exposure
- 6.4.4 R&D Intensity
- 6.4.5 Sustainability Maturity
- 6.5 Strategic Developments in Social Trading Platform (Last 24 Months)
- 6.5.1 Mergers, Acquisitions & Divestments
- 6.5.2 New Social Trading Platform Launches
- 6.5.3 Facility Expansions
- 6.5.4 Strategic Alliances, Joint Ventures & Partnerships
- 6.5.5 Distribution Expansion & Market Entry
- 6.5.6 Sustainability & ESG Initiatives
- 6.6 Competitive Strategy Mapping
- 6.6.1 Leader, Challenger, Follower & Niche Classification
- 6.6.2 Pricing Strategy Comparison
- 6.6.3 Channel Strategy Matrix
Note: Strategic developments are included based on their materiality and the availability of reliable information.
Chapter 7. Global Social Trading Platform Market – By Distribution Channel
- 7.1 Segment Overview
- 7.1.1 Volume & Revenue Split by Channel (2024 & 2032)
- 7.1.2 Channel Mix Evolution (2024-2032)
Chapter 8. Regional Market Analysis – Global Overview
- 8.1 Global Regional Overview
- 8.1.1 Regional Volume Share
- 8.1.2 Regional Revenue Share
- 8.1.3 Regional Volume by Region
- 8.1.4 Regional Revenue by Region
- 8.1.5 Regional Forecast Through 2032
- 8.2 Cross-Regional Segment Analysis
- 8.2.1 By Distribution Channel
- 8.2.2 By Brand/Price Tier
Chapter 9. North America Social Trading Platform Market
- 9.1 United States
- 9.2 Canada
- 9.3 Mexico
Chapter 10. Europe Social Trading Platform Market
- 10.1 Germany
- 10.2 France
- 10.3 Italy
- 10.4 United Kingdom
- 10.5 Spain
- 10.6 Poland
- 10.7 Russia
- 10.8 Netherlands
- 10.9 Belgium
- 10.10 Sweden
- 10.11 Denmark
- 10.12 Norway
- 10.13 Rest of Europe
Chapter 11. Asia Pacific Social Trading Platform Market
- 11.1 China
- 11.2 India
- 11.3 Japan
- 11.4 South Korea
- 11.5 Thailand
- 11.6 Indonesia
- 11.7 Vietnam
- 11.8 Malaysia
- 11.9 Australia
- 11.10 Rest of Asia Pacific
Chapter 12. Latin America Social Trading Platform Market
- 12.1 Brazil
- 12.2 Argentina
- 12.3 Colombia
- 12.4 Chile
- 12.5 Rest of Latin America
Chapter 13. Middle East Social Trading Platform Market
- 13.1 Saudi Arabia
- 13.2 United Arab Emirates
- 13.3 Turkey
- 13.4 Israel
- 13.5 Iran
- 13.6 Rest of the Middle East
Chapter 14. Africa Social Trading Platform Market
- 14.1 South Africa
- 14.2 Egypt
- 14.3 Nigeria
- 14.4 Morocco
- 14.5 Rest of Africa
Chapter 15. Social Trading Platform Company Profiles
- 15.1 [Company 01]
- 15.1.1 Company Overview
- 15.1.2 Key Management Personnel
- 15.1.3 Products & Services Portfolio
- 15.1.4 Financial Performance
- 15.1.5 Key Market Focus & Geographic Presence
- 15.1.6 Recent Developments & Strategic Initiatives
Note: The company profile list is preliminary and may change based on research findings, market developments, data availability, and client requirements.
Chapter 16. Appendices
- Appendix A – List of Abbreviations & Acronyms
- Appendix B – Industry Classification Code Reference – Full Series
- Appendix C – Production & Capacity Data Tables
- Appendix D – End-Use & Demand Base Tables
- Appendix E – Consumption & Replacement Rate Assumptions
- Appendix F – ASP Reference Tables
- Appendix G – Manufacturing & Facility Database
- Appendix H – Import-Export Data Tables
- Appendix I – Regulatory Summary Tables
- Appendix J – Primary Research Participant List (Anonymized)
- Appendix K – Primary Research Questionnaire Framework
- Appendix L – Data Sources & Bibliography
- Appendix M – Market Size Divergence & Source Comparison
Chapter 17. Research Methodology
- 17.1 Research Framework & Philosophy
- 17.2 Secondary Research – Sources, Hierarchy & Data Extraction
- 17.3 Data Modeling – Bottom-Up & Top-Down Market Sizing
- 17.4 Primary Research – Stakeholder Framework, LOI & Sample Sizes
- 17.5 Forecast Methodology – Regression, Scenario & Sensitivity Analysis
- 17.6 Quality Control – Four-Layer Validation Framework
- 17.7 Limitations & Standard Assumptions
- 17.8 Disclaimer
