
Market Overview
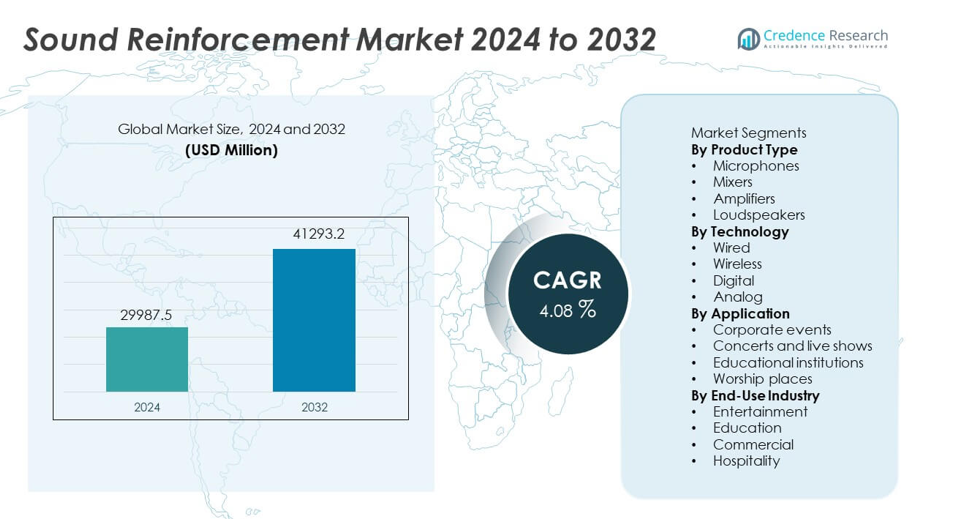
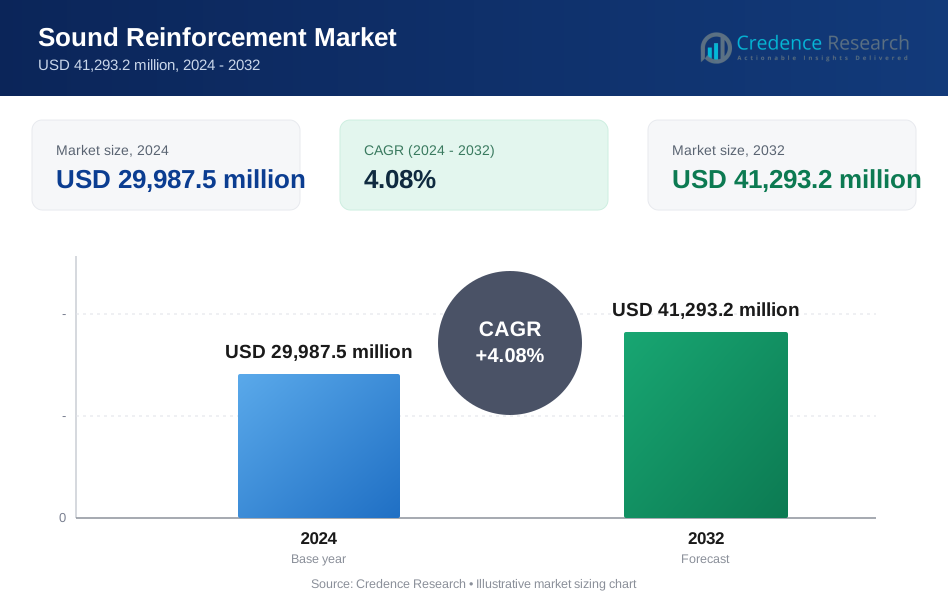
Sound Reinforcement market size was valued at USD 29,987.5 million in 2024 and is projected to reach USD 41,293.2 million by 2032, registering a CAGR of 4.08% during the forecast period.
| REPORT ATTRIBUTE | DETAILS |
|---|---|
| Historical Period | 2020-2023 |
| Base Year | 2024 |
| Forecast Period | 2025-2032 |
| Sound Reinforcement market Size 2024 | USD 29,987.5 million |
| Sound Reinforcement market, CAGR | 4.08% |
| Sound Reinforcement market Size 2032 | USD 41,293.2 million |
The top players in the Sound Reinforcement market include Shure Incorporated, Yamaha Corporation, Bose Corporation, Harman International, Sennheiser Electronic GmbH & Co. KG, QSC LLC, Audio-Technica Corporation, Meyer Sound Laboratories, RCF S.p.A, and Loud Technologies Inc. These companies lead through strong product portfolios, continuous R&D investment, and advanced digital and wireless technologies that improve sound quality and system efficiency. North America stands as the leading region with a 34% market share, driven by high adoption of professional audio systems in concerts, sports arenas, corporate events, and educational institutions. Europe and Asia Pacific follow with strong demand from entertainment and infrastructure development projects.
Market Insights
- The Sound Reinforcement market reached USD 29,987.5 million in 2024 and will grow at a CAGR of 4.08 percent through 2032.
- Demand rises as live events expand, and microphones lead the product segment with a 34 percent share driven by increased use in concerts and corporate setups.
- Wireless technology gains strong traction, holding a 41 percent share as venues shift toward flexible, low-clutter audio systems with advanced digital control features.
- Competition intensifies as major players enhance portfolios with lightweight speakers, energy-efficient amplifiers, and AI-supported tuning solutions to strengthen performance in large venues.
- North America leads with a 34 percent share, followed by Europe at 28 percent and Asia Pacific at 29 percent, supported by strong entertainment activity, infrastructure upgrades, and rising adoption in education and corporate environments.
Market Segmentation Analysis:
By Product Type
Microphones lead this segment with a 34% share, supported by strong demand from live concerts, corporate events, and broadcast studios. Growth in smart microphone technology and rising adoption of noise-cancellation features strengthen this category. Mixers and amplifiers gain traction as event organizers prefer advanced control systems for large venues. Loudspeakers also expand due to multizone audio setups in arenas and stadiums. Rising investments in event production and improvements in acoustic performance support overall segment growth.
- For instance, Shure introduced the Axient Digital platform with a 184 MHz tuning range and AES-256 encryption. The system supports up to 47 compatible channels in one frequency band.
By Technology
Wireless systems dominate the technology segment with a 41% share, driven by demand for flexible setups in concerts, conferences, and worship centers. Wireless platforms reduce cable clutter, improve mobility, and support fast installation across events. Digital solutions also gain momentum as audio engineers prefer enhanced signal processing and remote control. Analog systems continue to serve small venues that prioritize affordability. Advancements in frequency management and low-latency transmission drive higher adoption of modern wireless systems.
- For instance, Sennheiser’s Digital 6000 wireless system operates with very low latency. The platform supports a wide switching bandwidth for complex environments.
By Application
Concerts and live shows hold the largest share at 38%, as large venues require high-power reinforcement systems to deliver clear and consistent sound. Corporate events grow due to rising conferences, product launches, and hybrid meeting formats. Educational institutions adopt reinforcement systems for lecture halls and auditoriums. Worship places expand their use of loudspeakers, amplifiers, and microphones to improve clarity during services. Rising event frequency and investment in high-quality audio systems strengthen this segment.
Key Growth Drivers
Growing Demand for Large-Scale Live Events
Rising global interest in concerts, festivals, and sports events drives strong adoption of advanced sound reinforcement systems. Event organizers invest in high-capacity loudspeakers, digital mixers, and wireless microphones to deliver clear audio across large venues. Growth in arena upgrades and outdoor event infrastructure improves system penetration. Advancements in acoustic engineering help reduce distortion and enhance audience experience. Increased spending on entertainment boosts long-term demand for professional sound solutions.
- For instance, Meyer Sound’s LEO line array delivers a peak sound pressure level of 140 dB for stadium events. The system supports long-throw coverage beyond 300 meters with uniform sound dispersion.
Rapid Adoption of Digital and Wireless Technologies
Digital processing platforms and wireless transmission systems reshape modern event setups. Users prefer wireless microphones and speakers due to flexible placement, reduced clutter, and faster installation. Digital audio networks enable real-time monitoring, remote control, and advanced tuning across different zones. Integration with IP-based systems enhances scalability in corporate and institutional applications. These capabilities raise efficiency and support greater use of high-performance reinforcement equipment across diverse venues.
- For instance, Sennheiser’s Digital 6000 system offers a switching bandwidth of 244 MHz for complex RF environments. QSC’s Q-SYS platform manages over 250 networked audio endpoints through a single control core.
Expansion of Corporate and Educational Applications
Corporate events, training programs, and hybrid meetings increase demand for reliable sound systems in conference halls and studios. Educational institutions also adopt reinforcement setups for lecture theatres, auditoriums, and e-learning environments. Growth in corporate communication tools supports deployment of professional-grade microphones and digital mixers. Universities invest in upgraded AV infrastructure to enhance student engagement. These factors broaden market reach beyond entertainment, adding steady demand from formal and structured environments.
Key Trends & Opportunities
Integration of Smart and Networked Audio Systems
Manufacturers introduce smart sound systems with networked control, AI-based optimization, and remote configuration. These innovations allow engineers to adjust audio parameters in real time and coordinate multiple devices from a single interface. Networked audio supports large venue synchronization and reduces manual intervention. AI-driven tuning features enhance clarity and reduce background noise. This shift creates strong opportunities for cloud-connected reinforcement systems across arenas, corporate centers, and modern educational campuses.
- For instance, QSC’s Q-SYS platform supports many networked audio endpoints on a single Core processor. The system processes audio with centralized control and monitoring.
Increasing Use of Lightweight and Energy-Efficient Equipment
Demand grows for compact, lightweight speakers and amplifiers that simplify transport and reduce installation time. Manufacturers adopt advanced materials and efficient power modules to improve durability and lower energy use. These systems support mobile event companies that require quick setup and dismantling. Reduced power consumption also appeals to sustainability-focused venues. This trend opens opportunities for eco-friendly product lines that support long-term operational savings.
- For instance, RCF’s HDL 6-A line array weighs a specific amount and uses a powerful digital amplifier module. Powersoft’s X4 amplifier delivers substantial power across multiple channels in a single rack space form factor with active power factor correction.
Key Challenges
High Installation and Maintenance Costs
Professional sound reinforcement setups require significant investment in amplifiers, mixers, signal processors, and cabling. Large venues often face higher installation costs due to complex zoning and system calibration. Maintenance demands also rise with continuous usage in concerts and corporate events. These expenses limit adoption in small and mid-sized facilities. Budget constraints in schools and community centers further slow replacement cycles, affecting market expansion.
Interference and Signal Reliability Issues in Wireless Systems
Growing reliance on wireless microphones and speakers increases the risk of signal interference, especially in crowded frequency environments. Congested urban areas, overlapping frequencies, and equipment incompatibility can affect audio stability during live events. Engineers must manage frequency planning, shielding, and device coordination to maintain consistent performance. These challenges raise operational complexity and may result in disruptions during critical event moments, impacting user confidence.
Regional Analysis
North America
North America holds a 34% share due to its strong entertainment industry and high investment in advanced audio infrastructure. Growing demand for concerts, sports events, and corporate functions supports widespread adoption of digital and wireless systems. Venues upgrade reinforcement equipment to enhance audience experience and meet modern acoustic standards. Educational institutions and worship centers also drive consistent system replacement cycles. Strong presence of leading manufacturers further supports market expansion across the region.
Europe
Europe accounts for a 28% share, driven by a mature live event ecosystem and steady growth in cultural festivals and professional conferences. Countries upgrade sound infrastructure in stadiums, opera houses, and public venues to meet evolving acoustic requirements. Corporate events and broadcast studios add steady demand for high-performance microphones and digital mixers. Strict regulations on audio quality and noise control ensure wider adoption of modern reinforcement systems. Advancements in wireless technology also support long-term market growth.
Asia Pacific
Asia Pacific leads in growth momentum with a 29% share, supported by rising investments in entertainment venues, expanding corporate sectors, and rapid urban development. Concerts, exhibitions, and large public gatherings fuel strong demand for high-capacity reinforcement systems. Educational institutions and places of worship adopt advanced audio solutions to enhance communication and engagement. Expanding media production and e-sports industries add new opportunities. Government infrastructure projects also boost installations in stadiums and convention centers across major economies.
Latin America
Latin America captures an 5% share, driven by increasing adoption of audio systems in concerts, sports events, and community festivals. Urban centers invest in upgraded reinforcement setups to support large-scale gatherings and cultural programs. Corporate events and educational institutions contribute to steady demand for microphones, amplifiers, and digital mixers. Growth remains moderate due to budget constraints, yet rising entertainment activity and modernization of public venues support long-term expansion.
Middle East & Africa
The Middle East & Africa region holds a 4% share, supported by growing investments in hospitality, religious gatherings, and large event venues. Countries in the Gulf prioritize advanced audio systems for conferences, tourism spaces, and high-profile events. Expanding construction of stadiums and cultural centers stimulates demand for professional reinforcement systems. Adoption increases in educational institutions and corporate facilities. Market growth remains gradual in Africa, but rising urbanization and public infrastructure upgrades provide emerging opportunities.
Market Segmentations:
By Product Type
- Microphones
- Mixers
- Amplifiers
- Loudspeakers
By Technology
- Wired
- Wireless
- Digital
- Analog
By Application
- Corporate events
- Concerts and live shows
- Educational institutions
- Worship places
By End-Use Industry
- Entertainment
- Education
- Commercial
- Hospitality
By Geography
- North America
- U.S.
- Canada
- Mexico
- Europe
- Germany
- France
- U.K.
- Italy
- Spain
- Rest of Europe
- Asia Pacific
- China
- Japan
- India
- South Korea
- South-east Asia
- Rest of Asia Pacific
- Latin America
- Brazil
- Argentina
- Rest of Latin America
- Middle East & Africa
- GCC Countries
- South Africa
- Rest of the Middle East and Africa
Competitive Landscape
Competitive landscape in the market is shaped by leading companies such as Shure Incorporated, Yamaha Corporation, Bose Corporation, Harman International, Sennheiser Electronic GmbH & Co. KG, QSC LLC, Audio-Technica Corporation, Meyer Sound Laboratories, RCF S.p.A, and Loud Technologies Inc. These players compete through continuous innovation in digital processing, wireless technologies, and networked audio systems. Many firms enhance product durability, sound clarity, and system integration to meet growing demand across concerts, corporate events, and educational venues. Strategic partnerships with event organizers and AV integrators help expand market reach. Companies also focus on lightweight, energy-efficient designs that support fast deployment and reduce operational load. Ongoing R&D investment strengthens their ability to deliver high-performance solutions that suit large and complex venue requirements.
Key Player Analysis
- Shure Incorporated
- Yamaha Corporation
- Bose Corporation
- Harman International
- Sennheiser Electronic GmbH & Co. KG
- QSC, LLC
- Audio-Technica Corporation
- Meyer Sound Laboratories
- RCF S.p.A
- Loud Technologies Inc.
Recent Developments
- In 2025, Yamaha Music India hosted the Yamaha Audio Engineers Forum in Mumbai, focusing on live sound and pro audio trends.
- In June 2025, Yamaha Corporation opened a new Experience Center in Bengaluru featuring integrated pro audio solutions for sound reinforcement.
- In January 2025, Shure Incorporated unveiled new professional audio gear at NAMM 2025, including Nexadyne instrument microphones and SLX-D quad-channel receivers.
Report Coverage
The research report offers an in-depth analysis based on Product Type, Technology, Application, End-Use Industry and Geography. It details leading market players, providing an overview of their business, product offerings, investments, revenue streams, and key applications. Additionally, the report includes insights into the competitive environment, SWOT analysis, current market trends, as well as the primary drivers and constraints. Furthermore, it discusses various factors that have driven market expansion in recent years. The report also explores market dynamics, regulatory scenarios, and technological advancements that are shaping the industry. It assesses the impact of external factors and global economic changes on market growth. Lastly, it provides strategic recommendations for new entrants and established companies to navigate the complexities of the market.
Future Outlook
- Demand for advanced digital mixers will rise as venues upgrade event infrastructure.
- Wireless audio systems will expand due to faster setup needs and flexible stage layouts.
- Smart and networked sound systems will gain adoption in large multi-zone venues.
- Lightweight loudspeaker designs will support growth in mobile event production.
- AI-based tuning and real-time monitoring will improve sound accuracy across applications.
- Corporate and educational sectors will invest more in modern reinforcement systems.
- Stadiums and entertainment arenas will drive demand for high-capacity audio setups.
- Energy-efficient amplifiers and eco-focused designs will influence new product development.
- Integration with cloud-based control platforms will enhance remote management.
- Expanding events and tourism activities in emerging markets will support long-term growth.
Request a Free Sample
Fill in your details and we'll send you a free sample report.
- Sample data tables & charts
- Research methodology
Need a Custom Version of This Report?
Tailor the scope, geography, or segments to your exact requirements.
- Custom geography or segment scope
- Direct access to our analyst team
Frequently Asked Questions
What is the current market size for the Sound Reinforcement market, and what is its projected size in 2032?
At what Compound Annual Growth Rate is the Sound Reinforcement market projected to grow between 2024 and 2032?
Which Sound Reinforcement market segment held the largest share in 2024?
Who are the leading companies in the Sound Reinforcement market?
Which region commanded the largest share of the Sound Reinforcement market in 2024?
Table of Content
Chapter 1. Report Introduction
- 1.1 Report Description & Purpose
- 1.1.1 Report Title & Market Definition
- 1.1.2 Unique Selling Propositions (USP) & Key Differentiators
- 1.1.3 Value Proposition for Stakeholders
- 1.2 Research Objectives
- 1.2.1 Market Sizing Objectives (Volume & Revenue)
- 1.2.2 Segmentation Objectives
- 1.2.3 Competitive Intelligence Objectives
- 1.2.4 Forecast & Scenario Objectives
- 1.3 Report Scope
- 1.3.1 Sound Reinforcement Scope – Types & Subtypes Covered
- 1.3.2 Geographic Scope – Regions & Countries Covered
- 1.3.3 Historical Period, Base Year & Forecast Period (2024; forecast to 2032)
- 1.3.4 Inclusions & Exclusions
- 1.4 HS Code & Classification Framework
- 1.5 Currency, Units & Pricing Basis
- 1.6 Target Stakeholders
- 1.7 Limitations & Assumptions
Chapter 2. Executive Summary
- 2.1 Global Sound Reinforcement Market Snapshot
- 2.1.1 Market Size – Historical (2024) & Forecast (2024-2032) (2024: USD 29,987.5 million → 2032: USD 41,293.2 million)
- 2.1.2 Volume & Revenue – Global Totals
- 2.1.3 Key Market Highlights – Top Five Facts
- 2.2 Sound Reinforcement Market Segmentation Snapshot
- 2.2.1 Market Split by Region – 2024 vs. 2032
- 2.3 Competitive Snapshot
- 2.3.1 Top 10 Players by Revenue Share – 2024
- 2.3.2 Top 10 Players by Volume Share – 2024
- 2.3.3 Recent Strategic Developments (18-Month Summary)
- 2.4 Key Investment Highlights & Strategic Conclusions
Chapter 3. Sound Reinforcement Market Dynamics & Industry Analysis
- 3.1 Market Overview & Context
- 3.1.1 Sound Reinforcement Market Position in the Broader Automotive Value Chain
- 3.1.2 OEM vs. Replacement Market Dynamics
- 3.1.3 Market Maturity & Development Stage by Region
- 3.2 Sound Reinforcement Market Drivers
- 3.3 Sound Reinforcement Market Restraints & Challenges
- 3.4 Sound Reinforcement Market Opportunities
- 3.5 Porter's Five Forces Analysis
- 3.5.1 Threat of New Entrants
- 3.5.2 Bargaining Power of Suppliers
- 3.5.3 Bargaining Power of Buyers
- 3.5.4 Threat of Substitutes
- 3.5.5 Competitive Rivalry – Intensity Assessment
- 3.6 Sound Reinforcement Value Chain Analysis
- 3.6.1 Upstream – Raw Material/Input Suppliers
- 3.6.1.1 Raw Material/Input 1
- 3.6.1.2 Raw Material/Input 2
- 3.6.1.3 Raw Material/Input 3
- 3.6.2 Midstream – Production/Manufacturing/Service Delivery
- 3.6.2.1 Production/Process Overview
- 3.6.2.2 Key Facility Locations & Capacity by Manufacturer
- 3.6.3 Downstream – Distribution & End Consumer
- 3.6.3.1 Primary Channel – B2B/OEM
- 3.6.3.2 Secondary Channels – Dealer, Retail, Online, Direct
- 3.6.4 Value Chain Profitability Analysis
- 3.6.1 Upstream – Raw Material/Input Suppliers
- 3.7 PESTEL Analysis
- 3.7.1 Political Factors
- 3.7.2 Economic Factors
- 3.7.3 Social Factors
- 3.7.4 Technological Factors
- 3.7.5 Environmental Factors
- 3.7.6 Legal Factors
- 3.8 Sound Reinforcement Supply Chain Analysis
- 3.8.1 Raw Material/Input Supply Risk Assessment
- 3.8.2 Manufacturing Concentration Risk (Geographic Exposure)
- 3.8.3 Trade Disruption Impact Analysis
- 3.9 Regulatory & Policy Landscape
Note: The regulatory and policy landscape section covers regulations based on their applicability to the market, Sound Reinforcement category, geography, and scope of the study. Only regulatory frameworks with a material impact on operations, compliance, trade, sustainability, or market access are analyzed in detail.
Chapter 4. Key Investment Pockets & Opportunity Analysis
- 4.1 Sound Reinforcement Market Attractiveness Analysis
- 4.1.1 By Region – Investment Attractiveness Matrix (Volume × CAGR)
- 4.2 Absolute Revenue Growth Opportunity
- 4.2.1 By Region – Absolute USD Growth Through 2032
- 4.3 Incremental Volume Opportunity
- 4.3.1 By Region – Incremental Volume Through 2032
- 4.3.2 Segment – Incremental Volume
- 4.4 Emerging Submarket Opportunity Deep Dive (Subject to Applicability)
- 4.5 Emerging Market Opportunity Scorecards
- 4.5.1 United States
- 4.5.2 Europe
- 4.5.3 Asia
- 4.5.4 Middle East & Africa
Note: Emerging Market Opportunity Scorecards will be included based on relevance and strategic importance. Regions listed are indicative and may vary depending on data availability and market dynamics.
Chapter 5. Sound Reinforcement Import-Export Analysis & Trade Flows
- 5.1 Global Trade Overview
- 5.1.1 Global Export Value by Country (2024)
- 5.1.2 Global Export Volume by Country (2024)
- 5.1.3 Global Import Value by Country (2024)
- 5.1.4 Global Import Volume by Country (2024)
- 5.1.5 Net Trade Balance by Country (2024)
- 5.2 Export Analysis – Segment
- 5.2.1 Type 1 (HS Code)
- 5.2.2 Type 2 (HS Code)
- 5.2.3 Type 3 (HS Code)
- 5.2.4 Type 4 (HS Code)
- 5.2.5 Type 5 (HS Code)
- 5.3 Import Analysis – Segment
- 5.3.1 Type 1 (HS Code)
- 5.3.2 Type 2 (HS Code)
- 5.3.3 Type 3 (HS Code)
- 5.3.4 Type 4 (HS Code)
- 5.3.5 Type 5 (HS Code)
- 5.4 Average Unit Trade Prices
- 5.4.1 Average Export Price – Segment & Country
- 5.4.2 Average Import Price – Segment & Source Country
- 5.4.3 Price Trends (2024)
- 5.5 Key Trade Route Analysis
- 5.5.1 Trade Route 1
- 5.5.2 Trade Route 2
- 5.5.3 Trade Route 3
- 5.5.4 Trade Route 4
- 5.5.5 Trade Route 5
- 5.6 Trade Policy Impact Assessment
- 5.6.1 US Anti-Dumping & Section 301 Tariffs
- 5.6.2 EU Customs Union Impact
- 5.6.3 Major Free Trade Agreements
- 5.6.4 USMCA Rules of Origin
Note: Trade policy analysis will be included only where relevant to the Sound Reinforcement market.
Chapter 6. Competitive Landscape & Company Benchmarking
- 6.1 Sound Reinforcement Market Concentration & Structure
- 6.1.1 Herfindahl-Hirschman Index (HHI) – vs. 2024
- 6.1.2 Tier 1, Tier 2 & Tier 3 Market Structure
- 6.1.3 Global, Regional & Local Player Dynamics
- 6.2 Sound Reinforcement Market Share Analysis – 2024
- 6.2.1 Global Revenue Share by Company
- 6.2.2 Global Volume Share by Company
- 6.2.3 Regional Revenue Share
- 6.2.4 Market Share Evolution ( vs. 2024)
- 6.2.5 OEM Segment Share by Company
- 6.2.6 Replacement Segment Share by Company
- 6.3 Production/Delivery Capacity & Facility Analysis
- 6.3.1 Global Installed Capacity
- 6.3.2 Capacity Utilization Rates
- 6.3.3 Production/Output Volume
- 6.3.4 Facility Locations & Capacity Map
- 6.3.5 Planned Capacity Additions
- 6.4 Sound Reinforcement Competitive Benchmarking Matrix
- 6.4.1 Revenue, Volume, CAGR & Profitability Comparison
- 6.4.2 Channel Revenue Mix
- 6.4.3 Geographic Revenue Exposure
- 6.4.4 R&D Intensity
- 6.4.5 Sustainability Maturity
- 6.5 Strategic Developments in Sound Reinforcement (Last 24 Months)
- 6.5.1 Mergers, Acquisitions & Divestments
- 6.5.2 New Sound Reinforcement Launches
- 6.5.3 Facility Expansions
- 6.5.4 Strategic Alliances, Joint Ventures & Partnerships
- 6.5.5 Distribution Expansion & Market Entry
- 6.5.6 Sustainability & ESG Initiatives
- 6.6 Competitive Strategy Mapping
- 6.6.1 Leader, Challenger, Follower & Niche Classification
- 6.6.2 Pricing Strategy Comparison
- 6.6.3 Channel Strategy Matrix
Note: Strategic developments are included based on their materiality and the availability of reliable information.
Chapter 7. Global Sound Reinforcement Market – By Distribution Channel
- 7.1 Segment Overview
- 7.1.1 Volume & Revenue Split by Channel (2024 & 2032)
- 7.1.2 Channel Mix Evolution (2024-2032)
Chapter 8. Regional Market Analysis – Global Overview
- 8.1 Global Regional Overview
- 8.1.1 Regional Volume Share
- 8.1.2 Regional Revenue Share
- 8.1.3 Regional Volume by Region
- 8.1.4 Regional Revenue by Region
- 8.1.5 Regional Forecast Through 2032
- 8.2 Cross-Regional Segment Analysis
- 8.2.1 By Distribution Channel
- 8.2.2 By Brand/Price Tier
Chapter 9. North America Sound Reinforcement Market
- 9.1 United States
- 9.2 Canada
- 9.3 Mexico
Chapter 10. Europe Sound Reinforcement Market
- 10.1 Germany
- 10.2 France
- 10.3 Italy
- 10.4 United Kingdom
- 10.5 Spain
- 10.6 Poland
- 10.7 Russia
- 10.8 Netherlands
- 10.9 Belgium
- 10.10 Sweden
- 10.11 Denmark
- 10.12 Norway
- 10.13 Rest of Europe
Chapter 11. Asia Pacific Sound Reinforcement Market
- 11.1 China
- 11.2 India
- 11.3 Japan
- 11.4 South Korea
- 11.5 Thailand
- 11.6 Indonesia
- 11.7 Vietnam
- 11.8 Malaysia
- 11.9 Australia
- 11.10 Rest of Asia Pacific
Chapter 12. Latin America Sound Reinforcement Market
- 12.1 Brazil
- 12.2 Argentina
- 12.3 Colombia
- 12.4 Chile
- 12.5 Rest of Latin America
Chapter 13. Middle East Sound Reinforcement Market
- 13.1 Saudi Arabia
- 13.2 United Arab Emirates
- 13.3 Turkey
- 13.4 Israel
- 13.5 Iran
- 13.6 Rest of the Middle East
Chapter 14. Africa Sound Reinforcement Market
- 14.1 South Africa
- 14.2 Egypt
- 14.3 Nigeria
- 14.4 Morocco
- 14.5 Rest of Africa
Chapter 15. Sound Reinforcement Company Profiles
- 15.1 [Company 01]
- 15.1.1 Company Overview
- 15.1.2 Key Management Personnel
- 15.1.3 Products & Services Portfolio
- 15.1.4 Financial Performance
- 15.1.5 Key Market Focus & Geographic Presence
- 15.1.6 Recent Developments & Strategic Initiatives
Note: The company profile list is preliminary and may change based on research findings, market developments, data availability, and client requirements.
Chapter 16. Appendices
- Appendix A – List of Abbreviations & Acronyms
- Appendix B – Industry Classification Code Reference – Full Series
- Appendix C – Production & Capacity Data Tables
- Appendix D – End-Use & Demand Base Tables
- Appendix E – Consumption & Replacement Rate Assumptions
- Appendix F – ASP Reference Tables
- Appendix G – Manufacturing & Facility Database
- Appendix H – Import-Export Data Tables
- Appendix I – Regulatory Summary Tables
- Appendix J – Primary Research Participant List (Anonymized)
- Appendix K – Primary Research Questionnaire Framework
- Appendix L – Data Sources & Bibliography
- Appendix M – Market Size Divergence & Source Comparison
Chapter 17. Research Methodology
- 17.1 Research Framework & Philosophy
- 17.2 Secondary Research – Sources, Hierarchy & Data Extraction
- 17.3 Data Modeling – Bottom-Up & Top-Down Market Sizing
- 17.4 Primary Research – Stakeholder Framework, LOI & Sample Sizes
- 17.5 Forecast Methodology – Regression, Scenario & Sensitivity Analysis
- 17.6 Quality Control – Four-Layer Validation Framework
- 17.7 Limitations & Standard Assumptions
- 17.8 Disclaimer
