
| REPORT ATTRIBUTE | DETAILS |
|---|---|
| Historical Period | 2019-2022 |
| Base Year | 2023 |
| Forecast Period | 2024-2032 |
| South Africa Dark Fiber Network Market Size 2023 | USD 16.15 million |
| South Africa Dark Fiber Network Market, CAGR | 10.86% |
| South Africa Dark Fiber Network Market Size 2032 | USD 41.36 million |
Market Overview
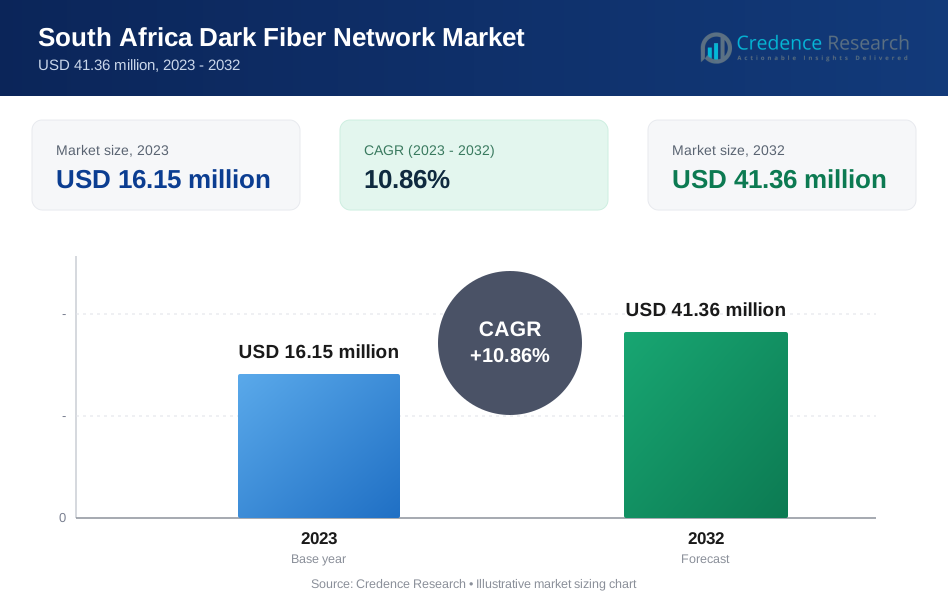
The South Africa Dark Fiber Network Market is projected to grow from USD 16.15 million in 2023 to an estimated USD 41.36 million by 2032, with a compound annual growth rate (CAGR) of 10.86% from 2024 to 2032. This significant growth is driven by the increasing demand for high-speed internet connectivity and the rising adoption of cloud-based services, which are critical for both businesses and consumers.
Market drivers include the growing need for reliable and high-capacity networks to support the increasing data traffic and the proliferation of connected devices. The trend towards remote working, online education, and digital entertainment further fuels the demand for enhanced network infrastructure. Additionally, government initiatives aimed at expanding digital access in rural and underserved areas are expected to positively impact market growth.
Geographically, the dark fiber network market in South Africa is concentrated in major urban centers, where the demand for high-speed connectivity is highest. However, the market is gradually expanding into rural regions as network providers seek to broaden their coverage. Key players in the market include companies such as Dark Fibre Africa (DFA), Liquid Telecom, and Vodacom, which are investing heavily in expanding their dark fiber networks to meet the growing demand for high-speed internet connectivity.
Market Drivers
Growing Demand for High-Speed Internet Connectivity
One of the primary drivers of the South Africa Dark Fiber Network Market is the increasing demand for high-speed internet connectivity across various sectors. With the rapid digital transformation of businesses, organizations are increasingly reliant on robust and scalable network infrastructure to support their operations. According to a survey conducted by the Independent Communications Authority of South Africa (ICASA), fixed broadband subscriptions in the country grew by 10.6% between 2019 and 2020. The shift to cloud computing, big data analytics, and the Internet of Things (IoT) has intensified the need for faster and more reliable data transmission. As a result, businesses are turning to dark fiber networks, which offer higher bandwidth and lower latency compared to traditional networks, to meet their connectivity needs. Moreover, the growing popularity of video streaming services, online gaming, and remote work has further driven the demand for high-speed internet among consumers. For instance, a study by Statistics South Africa found that 64.7% of South African households had at least one member who used the internet in 2020[2]. This surge in demand is pushing telecom operators and internet service providers (ISPs) to invest in dark fiber networks, which can handle the increased data traffic and provide seamless connectivity.
Expansion of Cloud-Based Services and Data Centers
The expansion of cloud-based services and data centers in South Africa is another significant driver of the dark fiber network market. As businesses continue to migrate their operations to the cloud, the need for reliable, high-capacity networks has become critical. Dark fiber networks provide the necessary infrastructure to support the large volumes of data being transmitted to and from cloud-based platforms. A survey conducted by World Wide Worx revealed that 88% of South African enterprises increased their use of cloud computing services in 2020. Additionally, the growth of data centers in South Africa, driven by increasing data storage and processing needs, is further boosting the demand for dark fiber networks. These data centers require high-bandwidth, low-latency connections to ensure optimal performance and meet the stringent requirements of their clients. As more global tech giants and local enterprises establish data centers in the region, the demand for dark fiber networks is expected to rise significantly. For instance, Amazon Web Services (AWS) launched its first African cloud region in Cape Town in 2020, highlighting the growing importance of data centers in the country. Furthermore, the trend towards edge computing, which involves processing data closer to the source to reduce latency, is also contributing to the growth of the dark fiber market, as it requires a robust and extensive network infrastructure.
Government Initiatives and Policies Supporting Digital Transformation
Government initiatives and policies aimed at promoting digital transformation in South Africa are playing a crucial role in driving the dark fiber network market. The South African government has recognized the importance of digital infrastructure in fostering economic growth and improving the quality of life for its citizens. As part of its efforts to bridge the digital divide, the government is implementing various initiatives to expand broadband access, particularly in rural and underserved areas. These initiatives include the rollout of the National Broadband Plan, which aims to provide high-speed internet access to all citizens by 2030. According to the Department of Communications and Digital Technologies, the government has set a target of connecting 80% of the population to the internet by 2024. The plan involves significant investments in fiber-optic infrastructure, including dark fiber networks, to ensure that even the most remote regions have access to reliable connectivity. Moreover, the government is encouraging public-private partnerships to accelerate the deployment of dark fiber networks across the country. These partnerships are essential for pooling resources and expertise to overcome the challenges of building and maintaining such infrastructure. For instance, the South African National Research Network (SANReN) has partnered with various institutions to expand its national backbone network, which includes dark fiber infrastructure. As a result, the supportive regulatory environment and government-led initiatives are expected to drive the growth of the dark fiber network market in South Africa over the coming years.
Increasing Adoption of 5G Technology
The increasing adoption of 5G technology in South Africa is another key driver of the dark fiber network market. 5G networks require a dense network of small cells and base stations to deliver the promised ultra-fast speeds and low latency. Dark fiber networks are ideally suited to support the backhaul requirements of 5G, providing the necessary bandwidth and reliability to ensure the smooth functioning of these advanced networks. As telecom operators in South Africa continue to roll out 5G services, the demand for dark fiber networks is expected to grow in tandem. Additionally, the deployment of 5G is expected to spur innovation and the development of new applications and services, such as autonomous vehicles, smart cities, and augmented reality, all of which will require robust and high-capacity network infrastructure. Dark fiber networks will play a critical role in enabling these technologies, further driving their adoption. Moreover, as 5G becomes more widespread, the demand for dark fiber networks is likely to extend beyond urban areas, as operators seek to provide seamless coverage across the country. This expansion will create new opportunities for market players and contribute to the overall growth of the South Africa Dark Fiber Network Market.
Market Trends
Increased Investment in Fiber Infrastructure Expansion
One of the most prominent trends in the South Africa Dark Fiber Network Market is the significant increase in investment in fiber infrastructure expansion. With the growing demand for high-speed internet and the advent of advanced technologies like 5G, telecom operators and infrastructure providers are heavily investing in expanding their fiber-optic networks. Companies such as Dark Fibre Africa (DFA), Liquid Telecom, and Vodacom are leading the charge by laying extensive fiber-optic cables across urban and rural areas. This expansion is crucial for meeting the rising data traffic demands driven by cloud computing, video streaming, and the proliferation of connected devices. For instance, the "Internet of things" (IoT), through sensing, is contributing to the increased need for robust fiber networks. Additionally, the push towards smart city initiatives and the increased adoption of digital services in both the public and private sectors are further driving the need for robust and expansive fiber networks. As a result, the market is witnessing a wave of new projects and collaborations aimed at enhancing network capacity and coverage, particularly in underserved regions.
Growing Adoption of Open Access Fiber Networks
Another key trend in the South Africa Dark Fiber Network Market is the growing adoption of open access fiber networks. This model allows multiple service providers to share the same physical fiber infrastructure, promoting competition and reducing costs for consumers. Open access networks are gaining traction in South Africa as they align with the government's objectives of increasing broadband penetration and ensuring affordable internet access for all. By enabling multiple ISPs and telecom operators to offer their services over a shared network, open access networks are fostering a more competitive market environment. This, in turn, is driving down prices and making high-speed internet more accessible to a broader population. For instance, the impact of this trend is affecting various industries, including the small stock industry in both Namibia and South Africa. Furthermore, the open access model is attracting significant interest from international investors and infrastructure funds, who see it as a viable way to participate in the growing African telecommunications market. The success of open access networks in South Africa is likely to set a precedent for other African countries, potentially leading to wider adoption of this model across the continent.
Market Restraints and Challenges
High Initial Capital Expenditure
A significant restraint in the South Africa Dark Fiber Network Market is the high initial capital expenditure required for the deployment and maintenance of fiber-optic infrastructure. Establishing dark fiber networks involves substantial investments in laying fiber cables, acquiring rights-of-way, and building the necessary network equipment. These costs are particularly burdensome in a country like South Africa, where geographical challenges, such as rugged terrain and the vast distances between urban centers and rural areas, can complicate infrastructure development. The high upfront costs make it difficult for smaller players and new entrants to compete, limiting the market to a few dominant operators. For instance, companies often face challenges in securing funding for large-scale fiber deployments, especially in less economically developed regions. Additionally, the return on investment (ROI) for dark fiber networks can be slow, especially in less densely populated regions where demand for high-speed connectivity is lower. This financial barrier can deter potential investors and slow down the overall expansion of the dark fiber network market in South Africa.
Regulatory and Bureaucratic Hurdles
Another challenge facing the South Africa Dark Fiber Network Market is the complex regulatory and bureaucratic environment. While the government has shown a commitment to expanding digital infrastructure, navigating the regulatory landscape remains a significant challenge for market players. Obtaining the necessary permits and approvals for laying fiber cables can be a time-consuming and cumbersome process, often involving multiple government agencies. Delays in securing these approvals can stall infrastructure projects, increasing costs and hindering market growth. Additionally, regulatory inconsistencies between different municipalities can create further complications, as companies may need to comply with varying local regulations across the country. For instance, operators often face difficulties in obtaining rights-of-way for fiber deployment, which can significantly delay project timelines. These bureaucratic hurdles not only slow down the deployment of dark fiber networks but also increase operational risks for companies, potentially discouraging investment in the sector. Addressing these regulatory challenges will be crucial for unlocking the full potential of the South Africa Dark Fiber Network Market and ensuring its sustainable growth in the future.
Market Segmentation Analysis
By Type
Single mode fiber dominates the South Africa Dark Fiber Network Market due to its superior long-distance data transmission capabilities with minimal signal loss. This type of fiber is particularly favored for long-haul communication and high-speed data transmission applications across various industries. The South African government's focus on improving national broadband infrastructure has led to increased deployment of single mode fiber networks, especially in urban areas and along major transportation routes. Step-index multimode fiber, while less common, finds its niche in short-distance communication scenarios where cost-effectiveness is a priority, such as local area networks and data centers. Graded-index multimode fiber occupies a middle ground, offering better performance than step-index multimode fiber due to reduced modal dispersion, making it suitable for medium-range communication in enterprise networks and campus environments.
By Application
Data transmission represents the largest application segment in the South Africa Dark Fiber Network Market, driven by the growing demand for high-speed internet and increased adoption of cloud services. The South African National Research Network (SANReN) has been instrumental in deploying dark fiber networks to connect research institutions and universities across the country, significantly boosting the data transmission segment. The networking infrastructure segment is also substantial, providing the backbone for telecom operators, ISPs, and data centers. South Africa's position as a regional hub for data centers has further fueled the demand for robust dark fiber networks in this segment. The ongoing expansion of digital services and the rollout of 5G technology are major factors contributing to the growth of the networking infrastructure segment, with several municipalities investing in their own fiber networks to improve connectivity and attract businesses.
Segments
Based on Type
- Single Mode Fiber
- Step-Index Multimode Fiber
- Graded-Index Multimode Fiber
Based on Application
- Data Transmission
- Networking Infrastructure
Based on End User
- Telecom
- Oil & Gas
- Military & Aerospace
- BFSI
- Others
Based on Network Type
- Metro
- Long-Haul
Based on Material
- Glass
- Plastic
Based on Region
- Rural
- Urban
Regional Analysis
Urban Regions (70%):
Urban regions, particularly major metropolitan areas such as Johannesburg, Cape Town, and Durban, dominate the South Africa Dark Fiber Network Market, accounting for approximately 70% of the total market share. These cities are the economic hubs of South Africa, with a high concentration of businesses, government institutions, and residential customers that require reliable and high-speed internet connectivity. The demand for dark fiber networks in these urban areas is driven by the proliferation of data centers, corporate networks, and the rollout of 5G infrastructure. Telecom operators and infrastructure providers are heavily investing in expanding and upgrading their fiber-optic networks in these regions to meet the growing demand. Moreover, the presence of numerous multinational corporations and financial institutions in these cities further amplifies the need for robust network infrastructure, contributing to the dominance of urban regions in the market.
Rural Regions (30%):
Rural regions, while currently accounting for around 30% of the South Africa Dark Fiber Network Market, are expected to experience significant growth in the coming years. The South African government has initiated various programs aimed at improving digital access in rural and underserved areas, which is driving the expansion of dark fiber networks into these regions. The National Broadband Plan is a key initiative focused on providing high-speed internet access to all citizens by 2030, with a particular emphasis on rural areas. As a result, telecom operators and infrastructure providers are increasingly looking to tap into the rural market by extending their fiber networks beyond urban centers. However, the deployment of dark fiber networks in rural regions faces challenges such as high costs, logistical difficulties, and lower population densities, which can slow down the pace of expansion. Despite these challenges, the rural segment is expected to grow as government support and technological advancements make it more feasible to deploy fiber-optic infrastructure in these areas.
Key players
- Telkom SA SOC Limited
- Vodacom Group Limited
- MTN Group Limited
- Liquid Telecom South Africa
- Dark Fibre Africa (DFA)
- Vumatel (part of Vodacom Group)
- MetroFibre Networx (Pty) Ltd.
- Cell C (part of Blue Label Telecoms)
- Internet Solutions (Dimension Data)
- Rain (Pty) Ltd
Competitive Analysis
The South Africa Dark Fiber Network Market is highly competitive, with several key players vying for market share. Telkom SA SOC Limited, Vodacom Group Limited, and MTN Group Limited dominate the market due to their extensive infrastructure and established customer bases. Liquid Telecom South Africa and Dark Fibre Africa (DFA) are strong contenders, leveraging their extensive fiber networks and focus on expanding coverage. Vumatel, now part of Vodacom Group, has gained significant traction in the residential market, offering high-speed fiber to the home (FTTH) services. MetroFibre Networx, Cell C, and Internet Solutions (Dimension Data) also play crucial roles, focusing on niche markets and enterprise solutions. Rain (Pty) Ltd is emerging as a key player, particularly in the 5G space, enhancing its competitive position. The market is characterized by strategic partnerships, continuous infrastructure investment, and a focus on expanding into underserved regions.
Recent Developments
- In August 2024, Telkom SA SOC Limited reported its annual results for the year ended March 31, 2024, showing revenue growth of 1.6% to R43.23 billion, driven by increases in mobile service revenue and next-generation revenue.
- In April 2024, Vodacom donated R3 million to help with humanitarian aid due to devastating fires in Cape Town.
- In August 2024, MTN Group reported solid underlying operational performance for the first half of 2024, with data service revenue increasing 21% and fintech service revenue climbing 27% in constant currency.
- In July 2024, Liquid Intelligent Technologies Rwanda expanded fixed broadband connectivity to users in upcountry regions.
Market Concentration and Characteristics
The South Africa Dark Fiber Network Market is moderately concentrated, with a few key players holding significant market shares, including Telkom SA SOC Limited, Vodacom Group Limited, and MTN Group Limited. These companies dominate due to their extensive infrastructure, established customer bases, and strong financial resources. The market is characterized by high barriers to entry, driven by the substantial capital investment required for network deployment and maintenance. Additionally, the market exhibits characteristics of a competitive environment, with players continually investing in expanding their fiber networks and innovating to enhance service offerings. The presence of niche players like Dark Fibre Africa (DFA) and Vumatel adds a layer of competition, particularly in specialized segments such as fiber to the home (FTTH) and business services. The market is also marked by strategic collaborations and partnerships, aimed at overcoming regulatory challenges and expanding coverage into underserved regions.
Report Coverage
The research report offers an in-depth analysis based on Type, Application, End User, Network Type, Material and Region. It details leading market players, providing an overview of their business, product offerings, investments, revenue streams, and key applications. Additionally, the report includes insights into the competitive environment, SWOT analysis, current market trends, as well as the primary drivers and constraints. Furthermore, it discusses various factors that have driven market expansion in recent years. The report also explores market dynamics, regulatory scenarios, and technological advancements that are shaping the industry. It assesses the impact of external factors and global economic changes on market growth. Lastly, it provides strategic recommendations for new entrants and established companies to navigate the complexities of the market.
Future Outlook
- The South Africa Dark Fiber Network Market will see ongoing expansion, with key players investing in extending their fiber networks to meet the rising demand for high-speed internet across urban and rural areas.
- The deployment of 5G technology will drive increased demand for dark fiber networks, as telecom operators require robust backhaul solutions to support the high data throughput and low latency of 5G services.
- Government initiatives aimed at expanding broadband access in underserved and rural areas will significantly contribute to the growth of dark fiber networks, reducing the digital divide.
- The increasing adoption of cloud-based services by businesses and consumers will further propel the demand for reliable and high-capacity dark fiber networks to ensure seamless data transmission.
- As smart city initiatives gain momentum in South Africa, the need for extensive fiber-optic networks will rise, driving growth in the dark fiber market to support connected infrastructure and services.
- The market will witness more strategic partnerships and collaborations among telecom operators, ISPs, and infrastructure providers to share resources and accelerate the deployment of fiber networks.
- Ongoing innovation in fiber-optic technologies, such as higher bandwidth fibers and advanced network management solutions, will enhance the efficiency and scalability of dark fiber networks.
- The demand for dark fiber networks will increase across various industries, including finance, oil and gas, and manufacturing, as businesses seek secure and high-speed communication solutions.
- The market may experience consolidation as larger players acquire smaller companies to expand their network reach and enhance their competitive positioning in the growing market.
- As environmental concerns rise, there will be a growing focus on developing energy-efficient fiber networks, with players adopting greener technologies and practices to reduce their carbon footprint.
Request a Free Sample
Fill in your details and we'll send you a free sample report.
- Sample data tables & charts
- Research methodology
Need a Custom Version of This Report?
Tailor the scope, geography, or segments to your exact requirements.
- Custom geography or segment scope
- Direct access to our analyst team
Frequently Asked Questions
What is the projected growth of the South Africa Dark Fiber Network Market?
What are the key drivers of the South Africa Dark Fiber Network Market?
Which regions in South Africa are leading in dark fiber network deployment?
Who are the major players in the South Africa Dark Fiber Network Market?
How is the adoption of 5G technology impacting the dark fiber market?
Table of Content
Chapter 1. Report Introduction
- 1.1 Report Description & Purpose
- 1.1.1 Report Title & Market Definition
- 1.1.2 Unique Selling Propositions (USP) & Key Differentiators
- 1.1.3 Value Proposition for Stakeholders
- 1.2 Research Objectives
- 1.2.1 Market Sizing Objectives (Volume & Revenue)
- 1.2.2 Segmentation Objectives
- 1.2.3 Competitive Intelligence Objectives
- 1.2.4 Forecast & Scenario Objectives
- 1.3 Report Scope
- 1.3.1 South Africa Dark Fiber Network Scope – Types & Subtypes Covered
- 1.3.2 Geographic Scope – Regions & Countries Covered
- 1.3.3 Historical Period, Base Year & Forecast Period (2023; forecast to 2032)
- 1.3.4 Inclusions & Exclusions
- 1.4 HS Code & Classification Framework
- 1.5 Currency, Units & Pricing Basis
- 1.6 Target Stakeholders
- 1.7 Limitations & Assumptions
Chapter 2. Executive Summary
- 2.1 Global South Africa Dark Fiber Network Market Snapshot
- 2.1.1 Market Size – Historical (2023) & Forecast (2023-2032) (2023: USD 16.15 million → 2032: USD 41.36 million)
- 2.1.2 Volume & Revenue – Global Totals
- 2.1.3 Key Market Highlights – Top Five Facts
- 2.2 South Africa Dark Fiber Network Market Segmentation Snapshot
- 2.2.1 Market Split by Region – 2023 vs. 2032
- 2.3 Competitive Snapshot
- 2.3.1 Top 10 Players by Revenue Share – 2023
- 2.3.2 Top 10 Players by Volume Share – 2023
- 2.3.3 Recent Strategic Developments (18-Month Summary)
- 2.4 Key Investment Highlights & Strategic Conclusions
Chapter 3. South Africa Dark Fiber Network Market Dynamics & Industry Analysis
- 3.1 Market Overview & Context
- 3.1.1 South Africa Dark Fiber Network Market Position in the Broader Automotive Value Chain
- 3.1.2 OEM vs. Replacement Market Dynamics
- 3.1.3 Market Maturity & Development Stage by Region
- 3.2 South Africa Dark Fiber Network Market Drivers
- 3.3 South Africa Dark Fiber Network Market Restraints & Challenges
- 3.4 South Africa Dark Fiber Network Market Opportunities
- 3.5 Porter's Five Forces Analysis
- 3.5.1 Threat of New Entrants
- 3.5.2 Bargaining Power of Suppliers
- 3.5.3 Bargaining Power of Buyers
- 3.5.4 Threat of Substitutes
- 3.5.5 Competitive Rivalry – Intensity Assessment
- 3.6 South Africa Dark Fiber Network Value Chain Analysis
- 3.6.1 Upstream – Raw Material/Input Suppliers
- 3.6.1.1 Raw Material/Input 1
- 3.6.1.2 Raw Material/Input 2
- 3.6.1.3 Raw Material/Input 3
- 3.6.2 Midstream – Production/Manufacturing/Service Delivery
- 3.6.2.1 Production/Process Overview
- 3.6.2.2 Key Facility Locations & Capacity by Manufacturer
- 3.6.3 Downstream – Distribution & End Consumer
- 3.6.3.1 Primary Channel – B2B/OEM
- 3.6.3.2 Secondary Channels – Dealer, Retail, Online, Direct
- 3.6.4 Value Chain Profitability Analysis
- 3.6.1 Upstream – Raw Material/Input Suppliers
- 3.7 PESTEL Analysis
- 3.7.1 Political Factors
- 3.7.2 Economic Factors
- 3.7.3 Social Factors
- 3.7.4 Technological Factors
- 3.7.5 Environmental Factors
- 3.7.6 Legal Factors
- 3.8 South Africa Dark Fiber Network Supply Chain Analysis
- 3.8.1 Raw Material/Input Supply Risk Assessment
- 3.8.2 Manufacturing Concentration Risk (Geographic Exposure)
- 3.8.3 Trade Disruption Impact Analysis
- 3.9 Regulatory & Policy Landscape
Note: The regulatory and policy landscape section covers regulations based on their applicability to the market, South Africa Dark Fiber Network category, geography, and scope of the study. Only regulatory frameworks with a material impact on operations, compliance, trade, sustainability, or market access are analyzed in detail.
Chapter 4. Key Investment Pockets & Opportunity Analysis
- 4.1 South Africa Dark Fiber Network Market Attractiveness Analysis
- 4.1.1 By Region – Investment Attractiveness Matrix (Volume × CAGR)
- 4.2 Absolute Revenue Growth Opportunity
- 4.2.1 By Region – Absolute USD Growth Through 2032
- 4.3 Incremental Volume Opportunity
- 4.3.1 By Region – Incremental Volume Through 2032
- 4.3.2 Segment – Incremental Volume
- 4.4 Emerging Submarket Opportunity Deep Dive (Subject to Applicability)
- 4.5 Emerging Market Opportunity Scorecards
- 4.5.1 United States
- 4.5.2 Europe
- 4.5.3 Asia
- 4.5.4 Middle East & Africa
Note: Emerging Market Opportunity Scorecards will be included based on relevance and strategic importance. Regions listed are indicative and may vary depending on data availability and market dynamics.
Chapter 5. South Africa Dark Fiber Network Import-Export Analysis & Trade Flows
- 5.1 Global Trade Overview
- 5.1.1 Global Export Value by Country (2023)
- 5.1.2 Global Export Volume by Country (2023)
- 5.1.3 Global Import Value by Country (2023)
- 5.1.4 Global Import Volume by Country (2023)
- 5.1.5 Net Trade Balance by Country (2023)
- 5.2 Export Analysis – Segment
- 5.2.1 Type 1 (HS Code)
- 5.2.2 Type 2 (HS Code)
- 5.2.3 Type 3 (HS Code)
- 5.2.4 Type 4 (HS Code)
- 5.2.5 Type 5 (HS Code)
- 5.3 Import Analysis – Segment
- 5.3.1 Type 1 (HS Code)
- 5.3.2 Type 2 (HS Code)
- 5.3.3 Type 3 (HS Code)
- 5.3.4 Type 4 (HS Code)
- 5.3.5 Type 5 (HS Code)
- 5.4 Average Unit Trade Prices
- 5.4.1 Average Export Price – Segment & Country
- 5.4.2 Average Import Price – Segment & Source Country
- 5.4.3 Price Trends (2023)
- 5.5 Key Trade Route Analysis
- 5.5.1 Trade Route 1
- 5.5.2 Trade Route 2
- 5.5.3 Trade Route 3
- 5.5.4 Trade Route 4
- 5.5.5 Trade Route 5
- 5.6 Trade Policy Impact Assessment
- 5.6.1 US Anti-Dumping & Section 301 Tariffs
- 5.6.2 EU Customs Union Impact
- 5.6.3 Major Free Trade Agreements
- 5.6.4 USMCA Rules of Origin
Note: Trade policy analysis will be included only where relevant to the South Africa Dark Fiber Network market.
Chapter 6. Competitive Landscape & Company Benchmarking
- 6.1 South Africa Dark Fiber Network Market Concentration & Structure
- 6.1.1 Herfindahl-Hirschman Index (HHI) – vs. 2023
- 6.1.2 Tier 1, Tier 2 & Tier 3 Market Structure
- 6.1.3 Global, Regional & Local Player Dynamics
- 6.2 South Africa Dark Fiber Network Market Share Analysis – 2023
- 6.2.1 Global Revenue Share by Company
- 6.2.2 Global Volume Share by Company
- 6.2.3 Regional Revenue Share
- 6.2.4 Market Share Evolution ( vs. 2023)
- 6.2.5 OEM Segment Share by Company
- 6.2.6 Replacement Segment Share by Company
- 6.3 Production/Delivery Capacity & Facility Analysis
- 6.3.1 Global Installed Capacity
- 6.3.2 Capacity Utilization Rates
- 6.3.3 Production/Output Volume
- 6.3.4 Facility Locations & Capacity Map
- 6.3.5 Planned Capacity Additions
- 6.4 South Africa Dark Fiber Network Competitive Benchmarking Matrix
- 6.4.1 Revenue, Volume, CAGR & Profitability Comparison
- 6.4.2 Channel Revenue Mix
- 6.4.3 Geographic Revenue Exposure
- 6.4.4 R&D Intensity
- 6.4.5 Sustainability Maturity
- 6.5 Strategic Developments in South Africa Dark Fiber Network (Last 24 Months)
- 6.5.1 Mergers, Acquisitions & Divestments
- 6.5.2 New South Africa Dark Fiber Network Launches
- 6.5.3 Facility Expansions
- 6.5.4 Strategic Alliances, Joint Ventures & Partnerships
- 6.5.5 Distribution Expansion & Market Entry
- 6.5.6 Sustainability & ESG Initiatives
- 6.6 Competitive Strategy Mapping
- 6.6.1 Leader, Challenger, Follower & Niche Classification
- 6.6.2 Pricing Strategy Comparison
- 6.6.3 Channel Strategy Matrix
Note: Strategic developments are included based on their materiality and the availability of reliable information.
Chapter 7. Global South Africa Dark Fiber Network Market – By Distribution Channel
- 7.1 Segment Overview
- 7.1.1 Volume & Revenue Split by Channel (2023 & 2032)
- 7.1.2 Channel Mix Evolution (2023-2032)
Chapter 8. Regional Market Analysis – Global Overview
- 8.1 Global Regional Overview
- 8.1.1 Regional Volume Share
- 8.1.2 Regional Revenue Share
- 8.1.3 Regional Volume by Region
- 8.1.4 Regional Revenue by Region
- 8.1.5 Regional Forecast Through 2032
- 8.2 Cross-Regional Segment Analysis
- 8.2.1 By Distribution Channel
- 8.2.2 By Brand/Price Tier
Chapter 9. North America South Africa Dark Fiber Network Market
- 9.1 United States
- 9.2 Canada
- 9.3 Mexico
Chapter 10. Europe South Africa Dark Fiber Network Market
- 10.1 Germany
- 10.2 France
- 10.3 Italy
- 10.4 United Kingdom
- 10.5 Spain
- 10.6 Poland
- 10.7 Russia
- 10.8 Netherlands
- 10.9 Belgium
- 10.10 Sweden
- 10.11 Denmark
- 10.12 Norway
- 10.13 Rest of Europe
Chapter 11. Asia Pacific South Africa Dark Fiber Network Market
- 11.1 China
- 11.2 India
- 11.3 Japan
- 11.4 South Korea
- 11.5 Thailand
- 11.6 Indonesia
- 11.7 Vietnam
- 11.8 Malaysia
- 11.9 Australia
- 11.10 Rest of Asia Pacific
Chapter 12. Latin America South Africa Dark Fiber Network Market
- 12.1 Brazil
- 12.2 Argentina
- 12.3 Colombia
- 12.4 Chile
- 12.5 Rest of Latin America
Chapter 13. Middle East South Africa Dark Fiber Network Market
- 13.1 Saudi Arabia
- 13.2 United Arab Emirates
- 13.3 Turkey
- 13.4 Israel
- 13.5 Iran
- 13.6 Rest of the Middle East
Chapter 14. Africa South Africa Dark Fiber Network Market
- 14.1 South Africa
- 14.2 Egypt
- 14.3 Nigeria
- 14.4 Morocco
- 14.5 Rest of Africa
Chapter 15. South Africa Dark Fiber Network Company Profiles
- 15.1 [Company 01]
- 15.1.1 Company Overview
- 15.1.2 Key Management Personnel
- 15.1.3 Products & Services Portfolio
- 15.1.4 Financial Performance
- 15.1.5 Key Market Focus & Geographic Presence
- 15.1.6 Recent Developments & Strategic Initiatives
Note: The company profile list is preliminary and may change based on research findings, market developments, data availability, and client requirements.
Chapter 16. Appendices
- Appendix A – List of Abbreviations & Acronyms
- Appendix B – Industry Classification Code Reference – Full Series
- Appendix C – Production & Capacity Data Tables
- Appendix D – End-Use & Demand Base Tables
- Appendix E – Consumption & Replacement Rate Assumptions
- Appendix F – ASP Reference Tables
- Appendix G – Manufacturing & Facility Database
- Appendix H – Import-Export Data Tables
- Appendix I – Regulatory Summary Tables
- Appendix J – Primary Research Participant List (Anonymized)
- Appendix K – Primary Research Questionnaire Framework
- Appendix L – Data Sources & Bibliography
- Appendix M – Market Size Divergence & Source Comparison
Chapter 17. Research Methodology
- 17.1 Research Framework & Philosophy
- 17.2 Secondary Research – Sources, Hierarchy & Data Extraction
- 17.3 Data Modeling – Bottom-Up & Top-Down Market Sizing
- 17.4 Primary Research – Stakeholder Framework, LOI & Sample Sizes
- 17.5 Forecast Methodology – Regression, Scenario & Sensitivity Analysis
- 17.6 Quality Control – Four-Layer Validation Framework
- 17.7 Limitations & Standard Assumptions
- 17.8 Disclaimer
