
Market Overview
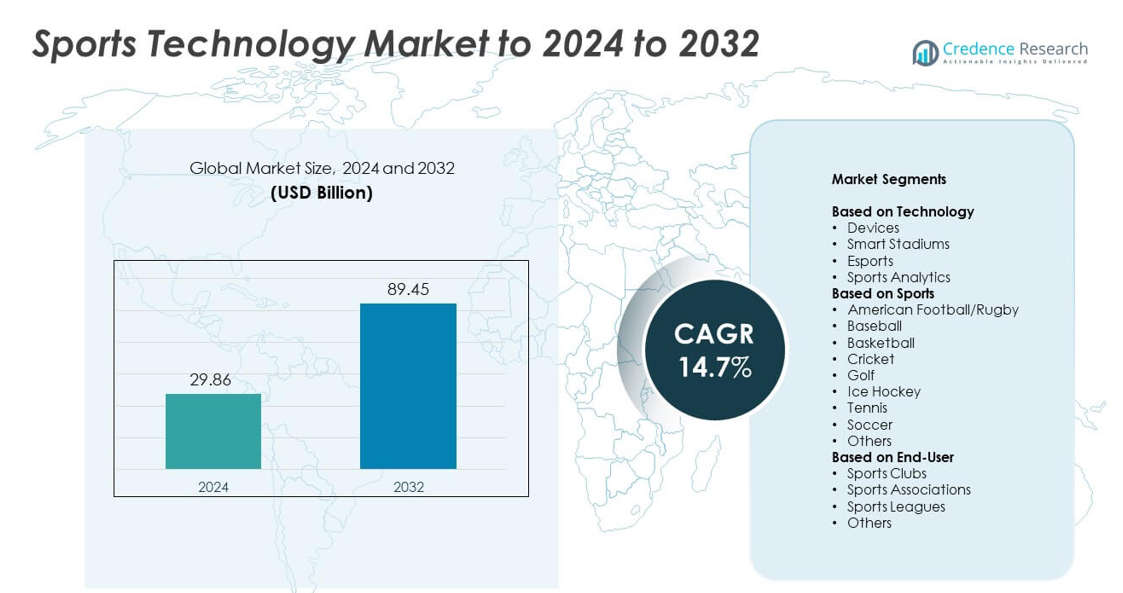
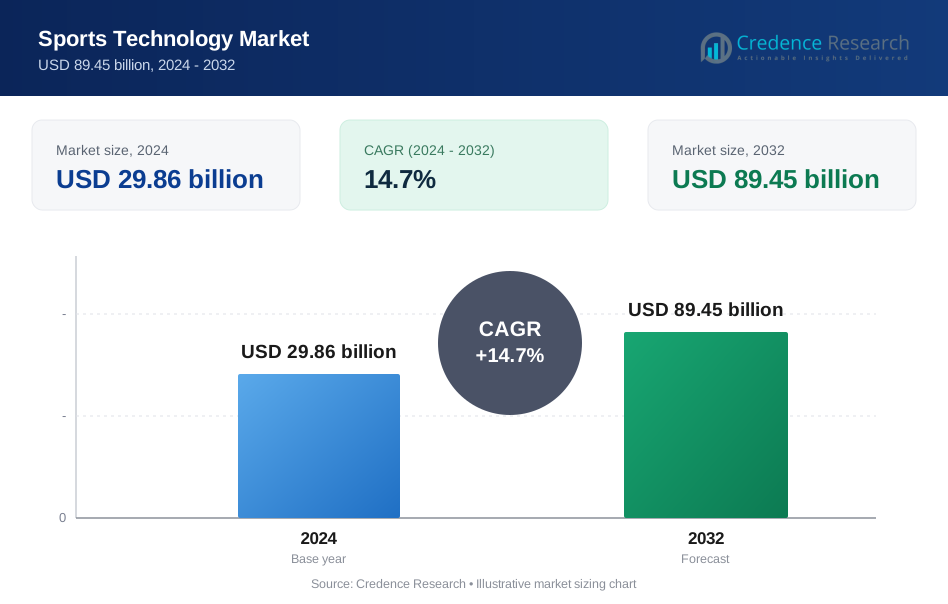
Sports Technology Market size was valued USD 29.86 billion in 2024 and is anticipated to reach USD 89.45 billion by 2032, at a CAGR of 14.7% during the forecast period.
| REPORT ATTRIBUTE | DETAILS |
|---|---|
| Historical Period | 2020-2023 |
| Base Year | 2024 |
| Forecast Period | 2025-2032 |
| Sports Technology Market Size 2024 | USD 29.86 billion |
| Sports Technology Market, CAGR | 14.7% |
| Sports Technology Market Size 2032 | USD 89.45 billion |
The Sports Technology Market is driven by major players such as IBM Corporation, Panasonic Corporation, Infosys Limited, Apple Inc., Oracle Corporation, Cisco Systems, Inc., SAP SE, HCL Technologies Limited, Modern Times Group MTG, and ChyronHego Corporation. These companies expand their presence through advanced analytics platforms, connected wearables, smart stadium systems, and AI-enabled performance tools. Their solutions support player monitoring, tactical planning, and fan engagement across global sports ecosystems. North America leads the market with about 37% share due to strong digital adoption in major leagues, followed by Europe with nearly 29% share, supported by heavy investment in football and stadium modernization.
Market Insights
- The Sports Technology Market was valued at USD 29.86 billion in 2024 and is projected to reach USD 89.45 billion by 2032, growing at a CAGR of 14.7%.
- Demand rises due to strong use of analytics, with the sports analytics segment holding about 38% share in 2024 as teams adopt data tools for performance, injury prevention, and tactical planning.
- Key trends include rapid growth of smart stadium upgrades, wider adoption of wearables, and fast expansion of esports technology as digital engagement becomes central to fan experience.
- Competition strengthens as global technology leaders invest in AI systems, cloud platforms, and connected devices to support training, venue operations, and broadcast enhancement across major sports ecosystems.
- North America leads with 37% share, followed by Europe at 29% and Asia Pacific at 24%, while Latin America holds 6% and the Middle East and Africa account for 4%, driven by rising digital transformation in stadiums and leagues.
Market Segmentation Analysis:
By Technology
Sports analytics held the dominant share in 2024 with about 38% of the Sports Technology Market. Strong demand came from real-time performance tracking, video review systems, and AI-based decision tools used by teams and leagues. Analytics platforms support injury prevention and performance planning, which drives rapid adoption across professional and semi-professional sports. Smart stadiums and devices grew as clubs invested in connected infrastructure, wearables, and fan-engagement tools. Esports recorded fast expansion due to rising viewership and digital tournaments worldwide.
- For instance, Catapult Sports reports that its performance analytics and wearable systems are used by more than 4,200 elite teams across over 40 sports in more than 100 countries as of its 2024 annual report.
By Sports
Soccer led the market in 2024 with nearly 34% share due to its large global audience, heavy investment by top leagues, and high use of tracking systems and VAR technologies. Teams adopt data tools, video systems, and smart wearables to improve match preparation and player health. Basketball and cricket also show rapid growth as franchises upgrade training systems and analytics platforms. Other sports adopt technology at a steady pace as digital solutions enhance fairness, safety, and fan engagement.
- For instance, Hawk-Eye goal-line systems in football use seven high-speed cameras per goal, for a total of 14 cameras per match.
By End-User
Sports leagues accounted for the largest share in 2024 with close to 41% of the Sports Technology Market. Leagues invest heavily in analytics, broadcast technologies, VAR systems, and stadium upgrades to improve match quality and commercial reach. Sports clubs follow with rising adoption of wearables, training software, and talent-tracking tools to enhance player performance. Sports associations adopt technology for event management, compliance, and competition monitoring. Wider digital transformation across global tournaments continues to support long-term demand.
Key Growth Drivers
Rising Demand for Data-Driven Performance Optimization
Teams adopt advanced sensors, analytics platforms, and video systems to improve player output and reduce injury risks. Clubs and leagues rely on AI tools to track movement, strength levels, and training loads in real time. This shift helps coaches make fast decisions and upgrade tactical planning. Growing dependence on accurate data strengthens demand for integrated performance technologies across major sports.
- For instance, STATS SportVU optical tracking in the NBA uses six specialised cameras in each arena to track the ball and all players at 25 samples per second, generating roughly one million data records per game for performance analysis.
Expansion of Smart Stadium Infrastructure
Smart stadium projects grow as venues install connected seating, automated ticketing, and real-time fan engagement systems. High-speed networks and IoT sensors support crowd management and enhanced safety. Broad digital upgrades help leagues offer immersive viewing and seamless operations. This expansion drives large-scale adoption of integrated sports technologies across new and existing venues.
- For instance, Cisco states that SoFi Stadium in California runs one of the world’s largest Wi-Fi 6 deployments, with approximately 2,500 Cisco access points supporting high-bandwidth applications such as uncompressed 4K video across the venue
Growth of Esports and Digital Sports Experiences
Esports gains strong traction due to rising global audiences and widespread streaming access. New tournaments create demand for advanced gaming hardware, AI-based event management, and audience analytics. Digital engagement platforms support better viewer interaction and sponsorship value. Rapid commercialization of esports accelerates investment in modern sports technology tools.
Key Trends & Opportunities
Adoption of AI and Machine Learning in Sports
AI systems help teams analyze tactical patterns, forecast injuries, and evaluate player performance with high precision. Machine learning models support scouting and lineup decisions through continuous data processing. Broad use of predictive insights creates strong adoption opportunities. As AI tools become easier to integrate, more leagues invest in automated decision systems.
- For instance, the NBA's current optical tracking system, provided by Hawk-Eye since the 2023-2024 season, is deployed across all 29 NBA arenas.
Growth in Wearable and Connected Athlete Devices
Wearables track biometric, motion, and fatigue metrics to support personalized training. Demand increases as clubs focus on athlete health and reliable workload management. Advances in miniaturized sensors and cloud dashboards enable real-time monitoring during training and games. This trend expands opportunities for companies offering smart devices and integrated analytics.
- For instance, WHOOP confirms that its performance strap measures key physiological and motion variables more than 100 times per second, 24 hours a day, for athletes including those covered under its data agreement with the NFL Players Association.
Rising Focus on Fan Engagement Technologies
Teams use AR, VR, and digital platforms to improve fan interaction. Enhanced match-day experiences, interactive content, and personalized updates lift user engagement. Strong investment in digital engagement tools supports revenue growth for leagues and clubs. This trend brings new opportunities for tech players delivering immersive fan solutions.
Key Challenges
High Cost of Advanced Sports Technologies
Teams face heavy investment needs for analytics software, AI systems, and smart stadium upgrades. Smaller clubs struggle to adopt premium solutions due to limited budgets. High maintenance costs add pressure on long-term spending. These financial barriers slow technology penetration in developing sports markets.
Data Privacy and Integration Complexities
Sports organizations collect large volumes of player and fan data, raising concerns about privacy and secure storage. Integrating multiple technologies across stadiums, clubs, and leagues also creates compatibility issues. Managing cross-platform data flow requires strong cybersecurity and technical expertise. These challenges slow smooth adoption of modern sports technology systems.
Regional Analysis
North America
North America held the leading share of about 37% of the Sports Technology Market in 2024 due to strong adoption of analytics platforms, wearables, and smart stadium systems across major leagues. High investment by NFL, NBA, and MLS teams drives steady demand for performance tools and fan-engagement technologies. Broad digital infrastructure and early use of AI-based training systems strengthen regional dominance. Expanding esports activity and rising commercialization of data-driven platforms continue to support long-term growth across the United States and Canada.
Europe
Europe accounted for nearly 29% share in 2024, supported by strong adoption across football clubs, racing events, and tennis tournaments. Premier League, Bundesliga, and La Liga teams invest heavily in tracking devices, biometric sensors, and match-analysis systems. Smart stadium upgrades and strict player-health monitoring rules boost market expansion. Esports adoption and training digitization further improve growth prospects. Rising innovation from regional tech companies enhances integration of cloud-based sports tools across competitive and recreational sports environments.
Asia Pacific
Asia Pacific captured around 24% share in 2024 and recorded the fastest growth due to rising investments in smart venues, esports tournaments, and advanced athlete-tracking systems. China, Japan, South Korea, and India drive demand through expanding digital sports ecosystems and large fan bases. Wearable devices gain rapid traction as regional leagues use real-time tracking for improved performance analysis. Government-backed sports development programs further accelerate technology adoption across stadiums, clubs, and training centers.
Latin America
Latin America held about 6% share in 2024, driven by growing modernization of football infrastructure and rising adoption of VAR and analytics tools. Brazil, Mexico, and Argentina upgrade training systems to support competitive league performance. Wearables and digital fan-engagement platforms gain popularity as clubs digitize operations. Expansion of esports and strengthening sports investment pipelines contribute to steady growth across the region.
Middle East and Africa
Middle East and Africa accounted for roughly 4% share in 2024, supported by strong government investment in sports development and smart stadium infrastructure. Countries such as the UAE, Qatar, and Saudi Arabia adopt advanced analytics, venue management tools, and athlete-performance systems to support global tournaments and local leagues. Growing interest in esports and rising commercial sports events enhance market penetration. Wider digital transformation efforts continue to expand opportunities across the region.
Market Segmentations:
By Technology
- Devices
- Smart Stadiums
- Esports
- Sports Analytics
By Sports
- American Football/Rugby
- Baseball
- Basketball
- Cricket
- Golf
- Ice Hockey
- Tennis
- Soccer
- Others
By End-User
- Sports Clubs
- Sports Associations
- Sports Leagues
- Others
By Geography
- North America
- U.S.
- Canada
- Mexico
- Europe
- Germany
- France
- U.K.
- Italy
- Spain
- Rest of Europe
- Asia Pacific
- China
- Japan
- India
- South Korea
- South-east Asia
- Rest of Asia Pacific
- Latin America
- Brazil
- Argentina
- Rest of Latin America
- Middle East & Africa
- GCC Countries
- South Africa
- Rest of the Middle East and Africa
Competitive Landscape
The Sports Technology Market is shaped by leading companies such as IBM Corporation, Panasonic Corporation, Infosys Limited, Apple Inc., Oracle Corporation, Cisco Systems, Inc., SAP SE, HCL Technologies Limited, Modern Times Group MTG, and ChyronHego Corporation. The competitive landscape reflects strong investment in AI-based performance systems, real-time analytics platforms, and cloud-integrated solutions that support both team operations and fan engagement. Firms focus on building advanced wearable ecosystems, venue management software, and immersive broadcast technologies to enhance commercial value for leagues and clubs. Many competitors expand through partnerships with sports organizations, enabling faster technology adoption and broader digital transformation. Companies also strengthen portfolios by improving cybersecurity, data accuracy, and predictive modeling capabilities to meet rising expectations across global sports environments. As digital adoption accelerates, competition intensifies around scalable platforms that support training optimization, stadium automation, and interactive viewer experiences.
Key Player Analysis
- IBM Corporation
- Panasonic Corporation
- Infosys Limited
- Apple Inc.
- Oracle Corporation
- Cisco Systems, Inc.
- SAP SE
- HCL Technologies Limited
- Modern Times Group MTG
- ChyronHego Corporation
Recent Developments
- In 2025, Chyron teamed with Asport for a cloud-based live sports production solution featuring AI-driven replay and graphics.
- In 2025, Cisco extended its multi-year partnership with Real Madrid. The agreement focuses on upgrading the Real Madrid Sports City training complex with a new AI-ready data center and the deployment of Wi-Fi 7 connectivity.
- In 2024, Apple launched the Apple Sports app, providing real-time scores, stats, and updates for sports fans on iPhone.
Report Coverage
The research report offers an in-depth analysis based on Technology, Sports, End-User and Geography. It details leading market players, providing an overview of their business, product offerings, investments, revenue streams, and key applications. Additionally, the report includes insights into the competitive environment, SWOT analysis, current market trends, as well as the primary drivers and constraints. Furthermore, it discusses various factors that have driven market expansion in recent years. The report also explores market dynamics, regulatory scenarios, and technological advancements that are shaping the industry. It assesses the impact of external factors and global economic changes on market growth. Lastly, it provides strategic recommendations for new entrants and established companies to navigate the complexities of the market.
Future Outlook
- The market will expand as teams adopt deeper analytics for performance decisions.
- Smart stadium projects will grow as venues upgrade networks and digital systems.
- Esports technology adoption will rise with increasing global viewership.
- Wearables will advance with better sensors and stronger cloud integration.
- AI tools will become standard in scouting, injury prediction, and tactical planning.
- Fan engagement platforms will evolve with immersive AR and VR features.
- Leagues will invest more in cybersecurity to protect athlete and fan data.
- Training environments will shift toward fully connected and automated systems.
- Broadcasting technology will improve with enhanced real-time data overlays.
- Cross-sport technology collaborations will increase product innovation and global reach.
Request a Free Sample
Fill in your details and we'll send you a free sample report.
- Sample data tables & charts
- Research methodology
Need a Custom Version of This Report?
Tailor the scope, geography, or segments to your exact requirements.
- Custom geography or segment scope
- Direct access to our analyst team
Frequently Asked Questions
What is the current market size for Sports Technology Market, and what is its projected size in 2032?
At what Compound Annual Growth Rate is the Sports Technology Market projected to grow between 2025 and 2032
In terms of wearable technology, which market category is in the lead?
Which segment is leading the market in terms of athlete performance analysis?
Who are the key participants in the market for sports technology globally?
Who are the leading companies in the Sports Technology Market?
Table of Content
Chapter 1. Report Introduction
- 1.1 Report Description & Purpose
- 1.1.1 Report Title & Market Definition
- 1.1.2 Unique Selling Propositions (USP) & Key Differentiators
- 1.1.3 Value Proposition for Stakeholders
- 1.2 Research Objectives
- 1.2.1 Market Sizing Objectives (Volume & Revenue) (Volume Where Applicable)
- 1.2.2 Segmentation Objectives
- 1.2.3 Competitive Intelligence Objectives
- 1.2.4 Forecast & Scenario Objectives
- 1.3 Report Scope
- 1.3.1 Sports Technology Scope – Segments & Subsegments Covered
- 1.3.2 Geographic Scope – Regions & Countries Covered
- 1.3.3 Historical Period, Base Year & Forecast Period (2024; forecast to 2032)
- 1.3.4 Inclusions & Exclusions
- 1.4 Industry Classification & Applicable Codes
- 1.5 Currency, Measurement Units & Valuation Basis
- 1.6 Target Stakeholders
- 1.7 Limitations & Assumptions
Chapter 2. Executive Summary
- 2.1 Global Sports Technology Market Snapshot
- 2.1.1 Market Size – Historical (2024) & Forecast (2024-2032) (2024: USD 29.86 billion → 2032: USD 89.45 billion)
- 2.1.2 Volume & Revenue – Global Totals (Volume Where Applicable)
- 2.1.3 Key Market Highlights – Top Five Facts
- 2.2 Sports Technology Market Segmentation Snapshot
- 2.2.1 Market Split by Region – 2024 vs. 2032
- 2.3 Competitive Snapshot
- 2.3.1 Top 10 Players by Revenue Share – 2024
- 2.3.2 Top 10 Players by Volume Share – 2024 (Volume Where Applicable)
- 2.3.3 Recent Strategic Developments (18-Month Summary)
- 2.4 Key Investment Highlights & Strategic Conclusions
Chapter 3. Sports Technology Market Dynamics & Industry Analysis
- 3.1 Market Overview & Context
- 3.1.1 Sports Technology Market Position in the Broader Industry Value Chain
- 3.1.2 Demand Structure & Purchasing Dynamics
- 3.1.3 Market Maturity & Development Stage by Region
- 3.2 Sports Technology Market Drivers
- 3.3 Sports Technology Market Restraints & Challenges
- 3.4 Sports Technology Market Opportunities
- 3.5 Porter's Five Forces Analysis
- 3.5.1 Threat of New Entrants
- 3.5.2 Bargaining Power of Suppliers
- 3.5.3 Bargaining Power of Buyers
- 3.5.4 Threat of Substitutes
- 3.5.5 Competitive Rivalry – Intensity Assessment
- 3.6 Sports Technology Value Chain Analysis
- 3.6.1 Upstream – Key Inputs, Resources & Suppliers
- 3.6.1.1 Key Input/Resource 1
- 3.6.1.2 Key Input/Resource 2
- 3.6.1.3 Key Input/Resource 3
- 3.6.2 Midstream – Core Operations & Value Creation
- 3.6.2.1 Operating Model & Process Overview
- 3.6.2.2 Key Operating Locations & Capabilities by Company
- 3.6.3 Downstream – Market Channels & End Users
- 3.6.3.1 Direct Sales & Customer Engagement Channels
- 3.6.3.2 Indirect Sales, Intermediaries & Partner Channels
- 3.6.4 Value Chain Profitability Analysis
- 3.6.1 Upstream – Key Inputs, Resources & Suppliers
- 3.7 PESTEL Analysis
- 3.7.1 Political Factors
- 3.7.2 Economic Factors
- 3.7.3 Social Factors
- 3.7.4 Technological Factors
- 3.7.5 Environmental Factors
- 3.7.6 Legal Factors
- 3.8 Sports Technology Supply Chain Analysis
- 3.8.1 Critical Input & Resource Availability Risk Assessment
- 3.8.2 Supplier & Operational Concentration Risk (Geographic Exposure)
- 3.8.3 Supply & Service Disruption Impact Analysis
- 3.9 Regulatory & Policy Landscape
Note: The regulatory and policy landscape section covers regulations based on their applicability to the market, Sports Technology category, geography, and scope of the study. Only regulatory frameworks with a material impact on operations, compliance, trade, sustainability, or market access are analyzed in detail.
Chapter 4. Key Investment Pockets & Opportunity Analysis
- 4.1 Sports Technology Market Attractiveness Analysis
- 4.1.1 By Region – Investment Attractiveness Matrix (Market Size × CAGR)
- 4.2 Absolute Revenue Growth Opportunity
- 4.2.1 By Region – Absolute Revenue Growth Through 2032
- 4.3 Incremental Demand Opportunity
- 4.3.1 By Region – Incremental Demand Through 2032
- 4.3.2 Segment – Incremental Demand
- 4.4 Emerging Submarket Opportunity Deep Dive (Subject to Applicability)
- 4.5 Priority Market Opportunity Scorecards
- 4.5.1 United States
- 4.5.2 Europe
- 4.5.3 Asia
- 4.5.4 Middle East & Africa
Note: Priority market opportunity scorecards reflect the geographic scope and strategic relevance of the study. Listed markets are indicative and may be adapted to the industry.
Chapter 5. Sports Technology Cross-Border Trade & Market Access Analysis
- 5.1 International Trade & Cross-Border Activity Overview
- 5.1.1 Global Export Value by Country (2024)
- 5.1.2 Global Export Volume by Country (2024) (Volume Where Applicable)
- 5.1.3 Global Import Value by Country (2024)
- 5.1.4 Global Import Volume by Country (2024) (Volume Where Applicable)
- 5.1.5 Net Trade Balance by Country (2024)
- 5.2 Export Analysis – Segment
- 5.2.1 Category 1 (Applicable Classification Code)
- 5.2.2 Category 2 (Applicable Classification Code)
- 5.2.3 Category 3 (Applicable Classification Code)
- 5.2.4 Category 4 (Applicable Classification Code)
- 5.2.5 Category 5 (Applicable Classification Code)
- 5.3 Import Analysis – Segment
- 5.3.1 Category 1 (Applicable Classification Code)
- 5.3.2 Category 2 (Applicable Classification Code)
- 5.3.3 Category 3 (Applicable Classification Code)
- 5.3.4 Category 4 (Applicable Classification Code)
- 5.3.5 Category 5 (Applicable Classification Code)
- 5.4 Cross-Border Pricing & Transaction Benchmarks
- 5.4.1 Export Pricing – Segment & Country
- 5.4.2 Import Pricing – Segment & Source Country
- 5.4.3 Price Trends (2024)
- 5.5 Key Cross-Border Trade & Delivery Routes
- 5.5.1 Cross-Border Trade/Delivery Route 1
- 5.5.2 Cross-Border Trade/Delivery Route 2
- 5.5.3 Cross-Border Trade/Delivery Route 3
- 5.5.4 Cross-Border Trade/Delivery Route 4
- 5.5.5 Cross-Border Trade/Delivery Route 5
- 5.6 Trade Policy & Market Access Impact Assessment
- 5.6.1 Tariff & Non-Tariff Barriers
- 5.6.2 Regional Trade & Economic Integration Frameworks
- 5.6.3 Bilateral & Multilateral Trade Agreements
- 5.6.4 Cross-Border Operating, Licensing & Localization Requirements
Note: This chapter applies where cross-border trade or delivery is relevant to Sports Technology. Goods, services, and digital offerings are assessed using applicable classifications and transaction measures. Import-export volumes, trade balances, and route analyses are included only where meaningful to the market.
Chapter 6. Competitive Landscape & Company Benchmarking
- 6.1 Sports Technology Market Concentration & Structure
- 6.1.1 Herfindahl-Hirschman Index (HHI) – the historical period vs. 2024
- 6.1.2 Leading, Mid-Sized & Emerging Player Structure
- 6.1.3 Global, Regional & Local Player Dynamics
- 6.2 Sports Technology Market Share Analysis – 2024
- 6.2.1 Global Revenue Share by Company
- 6.2.2 Global Volume Share by Company (Volume Where Applicable)
- 6.2.3 Regional Revenue Share
- 6.2.4 Market Share Evolution (the historical period vs. 2024)
- 6.2.5 Company Market Share by Key Segment
- 6.2.6 Company Market Share by Customer Group
- 6.3 Operating Scale, Capacity & Infrastructure Analysis
- 6.3.1 Global Operating Scale & Supply Capacity
- 6.3.2 Resource Utilization & Operating Efficiency
- 6.3.3 Output, Service Delivery & Activity Metrics
- 6.3.4 Operating Footprint & Infrastructure Map
- 6.3.5 Planned Operational & Capacity Expansion
- 6.4 Sports Technology Competitive Benchmarking Matrix
- 6.4.1 Revenue, Growth, Profitability & Operating Metric Comparison
- 6.4.2 Channel Revenue Mix
- 6.4.3 Geographic Revenue Exposure
- 6.4.4 R&D Intensity
- 6.4.5 Sustainability Maturity
- 6.5 Strategic Developments in Sports Technology (Last 24 Months)
- 6.5.1 Mergers, Acquisitions & Divestments
- 6.5.2 New Products, Services & Solutions in Sports Technology
- 6.5.3 Operational & Infrastructure Expansions
- 6.5.4 Strategic Alliances, Joint Ventures & Partnerships
- 6.5.5 Distribution Expansion & Market Entry
- 6.5.6 Sustainability & ESG Initiatives
- 6.6 Competitive Strategy Mapping
- 6.6.1 Leader, Challenger, Follower & Niche Classification
- 6.6.2 Pricing Strategy Comparison
- 6.6.3 Channel Strategy Matrix
Note: Strategic developments are included based on their materiality and the availability of reliable information.
Chapter 7. Global Sports Technology Market – By Sales & Delivery Channel
- 7.1 Segment Overview
- 7.1.1 Volume & Revenue Split by Channel (2024 & 2032) (Volume Where Applicable)
- 7.1.2 Channel Mix Evolution (2024-2032)
Chapter 8. Regional Market Analysis – Global Overview
- 8.1 Global Regional Overview
- 8.1.1 Regional Volume Share (Volume Where Applicable)
- 8.1.2 Regional Revenue Share
- 8.1.3 Regional Volume by Region (Volume Where Applicable)
- 8.1.4 Regional Revenue by Region
- 8.1.5 Regional Forecast Through 2032
- 8.2 Cross-Regional Segment Analysis
- 8.2.1 By Sales & Delivery Channel
- 8.2.2 By Competitive Positioning & Price Tier
Chapter 9. North America Sports Technology Market
- 9.1 United States
- 9.2 Canada
- 9.3 Mexico
Chapter 10. Europe Sports Technology Market
- 10.1 Germany
- 10.2 France
- 10.3 Italy
- 10.4 United Kingdom
- 10.5 Spain
- 10.6 Poland
- 10.7 Russia
- 10.8 Netherlands
- 10.9 Belgium
- 10.10 Sweden
- 10.11 Denmark
- 10.12 Norway
- 10.13 Rest of Europe
Chapter 11. Asia Pacific Sports Technology Market
- 11.1 China
- 11.2 India
- 11.3 Japan
- 11.4 South Korea
- 11.5 Thailand
- 11.6 Indonesia
- 11.7 Vietnam
- 11.8 Malaysia
- 11.9 Australia
- 11.10 Rest of Asia Pacific
Chapter 12. Latin America Sports Technology Market
- 12.1 Brazil
- 12.2 Argentina
- 12.3 Colombia
- 12.4 Chile
- 12.5 Rest of Latin America
Chapter 13. Middle East Sports Technology Market
- 13.1 Saudi Arabia
- 13.2 United Arab Emirates
- 13.3 Turkey
- 13.4 Israel
- 13.5 Iran
- 13.6 Rest of the Middle East
Chapter 14. Africa Sports Technology Market
- 14.1 South Africa
- 14.2 Egypt
- 14.3 Nigeria
- 14.4 Morocco
- 14.5 Rest of Africa
Chapter 15. Sports Technology Company Profiles
- 15.1 [Company 01]
- 15.1.1 Company Overview
- 15.1.2 Key Management Personnel
- 15.1.3 Products & Services Portfolio
- 15.1.4 Financial Performance
- 15.1.5 Key Market Focus & Geographic Presence
- 15.1.6 Recent Developments & Strategic Initiatives
Note: The company profile list is preliminary and may change based on research findings, market developments, data availability, and client requirements.
Chapter 16. Appendices
- Appendix A – List of Abbreviations & Acronyms
- Appendix B – Industry Classification Code Reference – Full Series
- Appendix C – Supply, Output & Operating Capacity Data Tables
- Appendix D – End-Use & Demand Base Tables
- Appendix E – Demand, Adoption & Usage Assumptions
- Appendix F – Pricing & Revenue Metric Reference Tables
- Appendix G – Company Operations & Infrastructure Database
- Appendix H – Cross-Border Trade & Activity Data Tables (Where Applicable)
- Appendix I – Regulatory Summary Tables
- Appendix J – Primary Research Participant List (Anonymized)
- Appendix K – Primary Research Questionnaire Framework
- Appendix L – Data Sources & Bibliography
- Appendix M – Market Size Divergence & Source Comparison
Chapter 17. Research Methodology
- 17.1 Research Framework & Philosophy
- 17.2 Secondary Research – Sources, Hierarchy & Data Extraction
- 17.3 Data Modeling – Bottom-Up & Top-Down Market Sizing
- 17.4 Primary Research – Stakeholder Framework, LOI & Sample Sizes
- 17.5 Forecast Methodology – Regression, Scenario & Sensitivity Analysis
- 17.6 Quality Control – Four-Layer Validation Framework
- 17.7 Limitations & Standard Assumptions
- 17.8 Disclaimer
