Market Overview
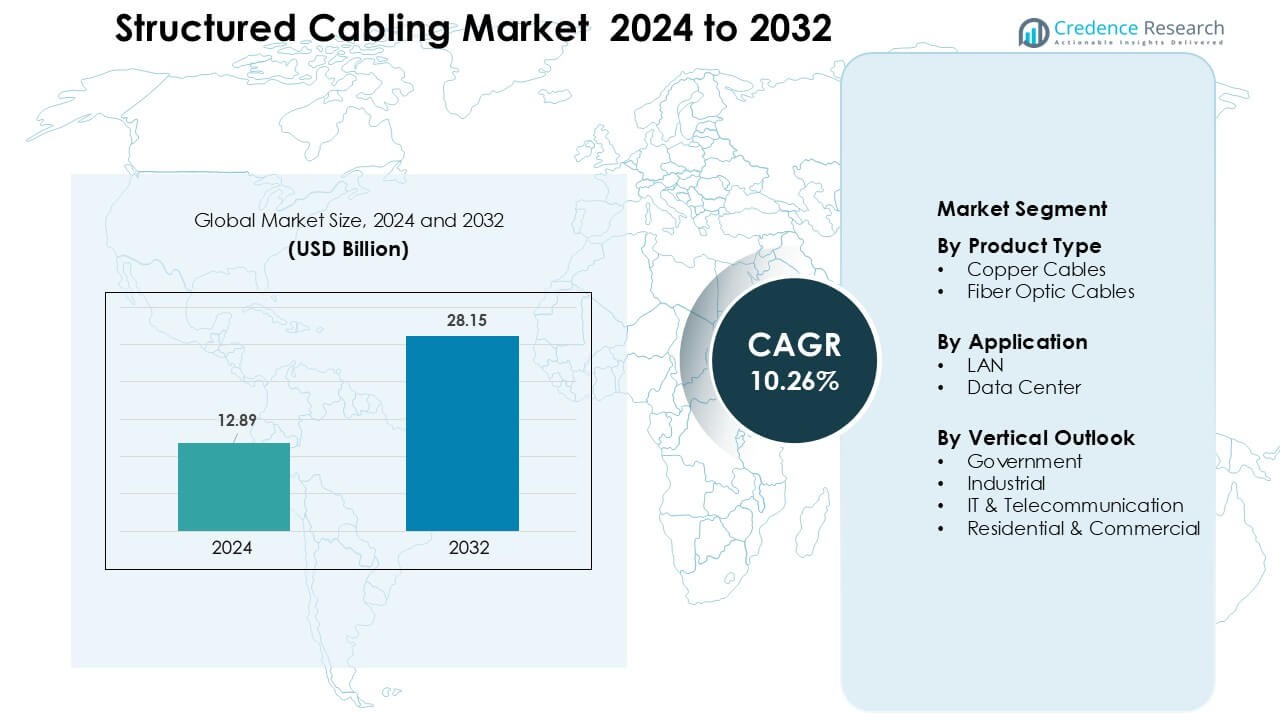
Structured Cabling Market was valued at USD 12.89 billion in 2024 and is anticipated to reach USD 28.15 billion by 2032, growing at a CAGR of 10.26% during the forecast period.
| REPORT ATTRIBUTE |
DETAILS |
| Historical Period |
2020-2023 |
| Base Year |
2024 |
| Forecast Period |
2025-2032 |
| Structured Cabling Market Size 2024 |
USD 12.89 Billion |
| Structured Cabling Market, CAGR |
10.26% |
| Structured Cabling Market Size 2032 |
USD 28.15 Billion |
The Structured Cabling Market is shaped by major players including Nexans, Schneider Electric, CommScope Holding Company, Furukawa Electric, Siemens, Corning, TE Connectivity, Belden, Legrand, and ABB Ltd, each expanding fiber and copper portfolios to support high-speed enterprise and data center networks. These companies invest in advanced Cat6A systems, optical innovations, and intelligent cabling management to strengthen global adoption. Partnerships with telecom operators, hyperscale data centers, and smart-building integrators further enhance competitiveness. North America led the market in 2024 with about 34% share, supported by rapid network modernization, strong IT spending, and large-scale data center expansion.
Access crucial information at unmatched prices!
Request your sample report today & start making informed decisions powered by Credence Research Inc.!
Download Sample
Market Insights
- The Structured Cabling Market reached USD 12.89 billion in 2024 and is projected to hit USD 28.15 billion by 2032, growing at a CAGR of 10.26% during the forecast period.
- Growth is driven by rapid enterprise digitalization, rising data center construction, and increased adoption of high-speed Cat6A and fiber networks supporting cloud, IoT, and 5G applications.
- Key trends include fast transition toward intelligent cabling management, pre-terminated fiber systems, and modernization of LAN infrastructure to handle multi-gigabit workloads.
- Leading players such as Nexans, Schneider Electric, CommScope, Corning, TE Connectivity, and Belden expand portfolios and strengthen partnerships with telecom operators, hyperscale data centers, and smart-building integrators.
- North America led with about 34% share, while Asia-Pacific showed the fastest expansion. By product type, copper cables held around 61% share, and by application, LAN dominated with nearly 58% share.
Market Segmentation Analysis:
By Product Type
Copper cables dominated the product-type segment in 2024 with about 61% share, supported by strong adoption in enterprise LANs and cost-efficient installation across commercial buildings. Businesses preferred copper due to its flexibility, PoE support, and lower deployment cost compared with fiber. The segment advanced as Cat6A and Cat7 upgrades increased bandwidth demand in offices and retail sites. Fiber optic cables grew quickly as cloud migration and high-speed transmission needs expanded; however, copper kept its lead because most existing networks rely on twisted-pair infrastructure and require scalable, low-cost upgrades.
- For instance, the official ISO/IEC 11801 Class F standard for Cat7 cable was designed and ratified to support 10 Gbps Ethernet over the full 100-meter distance.
By Application
LAN held the dominant position in 2024 with nearly 58% share, driven by heavy use in corporate networks, schools, hospitals, and public institutions. Organizations expanded LAN infrastructure to support rising device density, remote-work setups, and VoIP systems. Demand increased as Wi-Fi 6 and 6E deployments required higher-grade cabling to handle multi-gigabit speeds. Data centers grew at a rapid pace fueled by hyperscale expansion, cloud services, and digital workloads, yet LAN kept the largest share because most structured cabling installations occur in office floors, campus networks, and enterprise facilities.
- For instance, enterprises rolling out Wi‑Fi 6E across campuses such as educational institutions upgrading multiple buildings have migrated wiring from CAT-5E to Category 6A cable to ensure stable, multi-gigabit backhaul, enabling reliable connectivity for thousands of simultaneous devices.
By Vertical Outlook
IT & Telecommunication led the vertical segment in 2024 with about 34% share, supported by rapid network modernization and strong bandwidth needs across telecom operators. Fiber-rich upgrades, 5G backhaul expansion, and rising cloud service use pushed structured cabling adoption across switching rooms and central offices. Industrial users increased deployment due to automation and IIoT, while government projects advanced through smart-city and public infrastructure programs. Residential and commercial installations expanded with higher broadband penetration, yet IT & Telecommunication remained the key contributor because digital transformation created sustained demand for high-performance cabling systems.
Key Growth Drivers
Rising Enterprise Digitalization and Network Modernization
Enterprise digitalization expanded rapidly as organizations upgraded networks to support cloud adoption, unified communication systems, and high-bandwidth applications. Businesses deployed advanced cabling to handle higher data loads created by automation, video conferencing, and remote-work models. Companies upgraded from legacy Cat5e or Cat6 systems to Cat6A and fiber to increase speed, reduce latency, and improve long-term scalability. Adoption grew across offices, banks, hospitals, and educational facilities where structured cabling improved operational efficiency and reduced downtime. Demand also rose as enterprises integrated security cameras, IoT sensors, and building management systems that required stable wired networks for power and data. Strong economic benefits encouraged modernization because structured cabling offered low maintenance and higher reliability than wireless alternatives during peak loads. Network refresh cycles across mid-sized and large enterprises strengthened the driver further, making digital transformation a key factor fueling global market expansion.
- For instance, enterprises re-wiring office floors have replaced Cat5e (limited to 1 Gbps) with Cat6A to future-proof infrastructure, enabling support for multi-gigabit Ethernet and ensuring compatibility with next-generation networking demands without frequent re-cabling needs.
Data Center Expansion Driven by Cloud and AI Workloads
Data centers expanded at a strong pace as cloud computing, AI training, and edge computing workloads increased. Global hyperscalers and colocation providers accelerated investments in high-density server racks that required reliable fiber and copper cabling systems. Structured cabling played a central role in enabling fast cooling systems, low-latency switching, and scalable rack-to-rack connections. Cloud service growth boosted demand for cabling that could support multi-gigabit speeds and flexible topologies. AI models required dense GPU clusters, which increased the need for high-performance fiber links with strong noise immunity. Enterprises shifted their IT workloads to hybrid cloud models, pushing demand for structured cabling inside core data centers and distributed micro-data centers. Rising adoption of edge sites for IoT and 5G also expanded the need for compact yet efficient cabling layouts. This consistent infrastructure growth made data centers a major driver of long-term structured cabling demand.
- For instance, high-density data centers in 2025 are increasingly adopting MTP/MPO pre-terminated fiber trunking systems to support massive east–west data flow required for AI clusters enabling interconnectivity between racks across the facility while maintaining manageable cable count and airflow.
Growth of IoT, Smart Buildings, and 5G Infrastructure
IoT adoption surged across manufacturing, healthcare, retail, and government sectors, driving the need for structured cabling that could support high device density. Smart-building platforms used cabling for lighting systems, access control, HVAC monitoring, and energy management, increasing demand for stable wired connectivity. PoE-based devices gained traction, requiring cabling that could power sensors, IP cameras, and wireless access points. The rollout of 5G accelerated fiber deployment to backhaul and edge nodes, where structured cabling ensured dependable high-speed transmission. Smart cities integrated cabling in surveillance systems, traffic management, and public Wi-Fi projects. Industrial IoT systems in factories needed secure and low-latency communication channels to run robotics, predictive maintenance tools, and automated lines. The combined growth of IoT ecosystems and urban digital infrastructure positioned structured cabling as a core enabler of reliable communication networks worldwide.
Key Trend & Opportunity
Shift Toward High-Speed Fiber and Cat6A Upgrades
A major market trend involved the rapid shift from legacy copper grades to high-speed Cat6A and fiber solutions. Enterprises needed cabling that supported 10G and 40G speeds for cloud applications, AI analytics, and large file transfers. Fiber gained momentum due to low signal loss, electromagnetic immunity, and future-proof scalability. Office buildings and commercial campuses used Cat6A upgrades to support Wi-Fi 6 and Wi-Fi 7 deployments, which required multi-gigabit backhaul capacity. Manufacturers launched bend-insensitive fiber and pre-terminated assemblies that reduced installation time and labor costs. This trend created significant opportunities for vendors offering high-performance, easy-to-deploy systems. The growth of fiber-rich smart campuses and hyperconnected spaces also strengthened long-term demand.
- For instance, many commercial campuses upgrading to support 10 Gbps Ethernet have deployed Cat6A cabling over the full 100-meter horizontal distance ensuring consistent 10 Gbps connectivity from switch to endpoint a capability legacy Cat5e/Cat6 often can’t reliably deliver at full length.
Rising Adoption of Intelligent and Automated Cabling Management
Intelligent cabling management systems emerged as a major opportunity as enterprises prioritized operational efficiency and predictive maintenance. Automated cable tracking, real-time port utilization monitoring, and digital mapping helped reduce failure risks and downtime. Large facilities used smart patch panels and sensor-based racks to optimize network paths and detect faults early. These systems improved asset visibility and supported rapid troubleshooting during configuration changes. Vendors integrated analytics tools that recommended network upgrades and ensured compliance with design standards. As networks expanded through IoT devices and automation systems, intelligent management offered a scalable way to maintain reliability. This trend opened growth opportunities for suppliers blending software, sensors, and structured cabling hardware.
- For instance, CommScope reports that its Automated Infrastructure Management (AIM) systems combining intelligent copper or fiber patch panels and controllers offer real-time visibility of connectivity changes, enabling admins to instantly locate and identify active ports across an entire network.
Key Challenge
High Installation Costs and Complex Upgrade Requirements
Structured cabling installation involved significant labor, material, and design costs, especially in large commercial buildings and data centers. Upgrading legacy infrastructures often required extensive rewiring, pathway expansion, and compliance checks, which increased expenses. Older facilities needed redesigning of conduits, cable trays, and server rooms to support higher-density cabling. These challenges slowed modernization efforts for small businesses with limited budgets. Installation delays also occurred due to coordination across contractors, IT teams, and building engineers. High upfront cost restricted adoption in some price-sensitive regions, even though long-term benefits were strong. This financial barrier remained a key challenge affecting growth.
Availability of Skilled Technicians and Compliance Constraints
Many regions experienced a shortage of skilled installation technicians capable of handling advanced fiber, Cat6A, and data center layouts. Incorrect installations increased risks of signal interference, cable damage, and network inefficiencies. Strict standards such as TIA/EIA and ISO/IEC required certified installation practices, adding complexity to projects. Businesses faced delays when sourcing qualified contractors for large upgrades. Compliance audits and testing requirements also raised project timelines. As networks became denser with IoT and 5G integration, maintaining high-quality cabling installation grew more challenging. This shortage of skilled labor and rising compliance pressure continued to impact market expansion.
Regional Analysis
North America
North America dominated the Structured Cabling Market in 2024 with about 34% share, driven by strong IT infrastructure investments and widespread enterprise digitalization. The United States led adoption as data center expansion accelerated across cloud providers, telecom operators, and large corporations. Demand grew as businesses upgraded to Cat6A and fiber to support high-speed networks, Wi-Fi 6E, and hybrid work environments. Government projects in smart cities, security systems, and broadband development further increased structured cabling requirements. Canada contributed steady growth, supported by expanding colocation facilities and increased deployment of intelligent building systems across commercial properties.
Europe
Europe held nearly 27% share in 2024, supported by strong modernization of communication networks and rising deployment of fiber-rich enterprise infrastructures. The region advanced as Germany, the United Kingdom, France, and the Nordics increased investments in data centers and 5G backhaul networks. Manufacturers and financial institutions upgraded structured cabling to manage high-density IoT and automation systems. The European Union’s digital transformation and energy-efficient building initiatives also boosted demand. Large-scale hyperscale data center projects and smart manufacturing hubs across Western Europe strengthened adoption, while Eastern Europe contributed steady growth with expanding commercial and residential fiber networks.
Asia-Pacific
Asia-Pacific emerged as the fastest-growing region with around 31% share in 2024, driven by rapid industrialization, smart-city investments, and massive data center construction. China, India, Japan, and South Korea led adoption as enterprises expanded cloud usage and telecom operators accelerated 5G rollout. Growing penetration of IoT devices in manufacturing, healthcare, and retail increased the need for high-speed structured cabling. Fiber deployment surged across commercial buildings and new residential developments. Multinational technology firms increased colocation capacity across key cities, which further boosted demand for advanced cabling systems supporting scalable server and storage networks.
Latin America
Latin America accounted for roughly 5% share in 2024, supported by growing digital transformation across banking, telecom, and retail. Brazil and Mexico led demand as enterprises expanded data center footprints and upgraded IT infrastructure. Government-backed connectivity programs and rising adoption of cloud services encouraged structured cabling installations in corporate and public sectors. The region also saw increased deployment of fiber and Cat6A systems in smart buildings, universities, and industrial facilities. Despite economic challenges in some nations, investment in digital services and e-commerce growth sustained steady adoption across major metropolitan areas.
Middle East & Africa
The Middle East & Africa region represented nearly 3% share in 2024, yet displayed strong momentum due to expanding smart-city projects and government-led digital infrastructure programs. The UAE, Saudi Arabia, and Qatar drove adoption as they built advanced data centers, modern office complexes, and large-scale 5G networks. Africa saw rising demand in financial services and telecom sectors as enterprises upgraded legacy networks. Investments in security systems, surveillance infrastructure, and commercial real estate developments increased structured cabling installations. Although market penetration remained lower than other regions, strategic national ICT programs continued to strengthen long-term growth prospects.
Market Segmentations:
By Product Type
- Copper Cables
- Fiber Optic Cables
By Application
By Vertical Outlook
- Government
- Industrial
- IT & Telecommunication
- Residential & Commercial
By Geography
- North America
- Europe
- Germany
- France
- U.K.
- Italy
- Spain
- Rest of Europe
- Asia Pacific
- China
- Japan
- India
- South Korea
- South-east Asia
- Rest of Asia Pacific
- Latin America
- Brazil
- Argentina
- Rest of Latin America
- Middle East & Africa
- GCC Countries
- South Africa
- Rest of the Middle East and Africa
Competitive Landscape
The Structured Cabling Market features strong competition among leading players such as Nexans, Schneider Electric, CommScope Holding Company, Furukawa Electric, Siemens, Corning, TE Connectivity, Belden, Legrand, and ABB Ltd, each expanding product portfolios across copper, fiber, and intelligent cabling solutions. These companies strengthen their positions through innovation in high-speed Cat6A, Cat7, and advanced fiber systems that support dense data center and enterprise networks. Vendors invest in PoE-optimized designs, bend-insensitive fiber, and pre-terminated assemblies to reduce installation time and enhance reliability. Strategic moves include partnerships with telecom operators, smart-building integrators, and hyperscale data center providers. Many players also focus on software-enabled cabling management, automation tools, and energy-efficient solutions to meet sustainability goals. Regional expansion, strong distribution networks, and compliance with global standards help these companies maintain a competitive edge as demand rises across IT, telecom, industrial automation, and commercial building projects.
Shape Your Report to Specific Countries or Regions & Enjoy 30% Off!
Key Player Analysis
- Nexans
- Schneider Electric
- CommScope Holding Company, Inc.
- Furukawa Electric Co., Ltd.
- Siemens AG
- Corning Incorporated
- TE Connectivity Ltd.
- Belden Inc.
- Legrand SA
- ABB Ltd
Recent Developments
- In 2025, Nexans reinforced its role as a supplier for large enterprise-grade structured cabling and backbone networks by securing two distinct data center contracts. One was a multi-year contract to supply fiber optic harness assemblies to a leading hyperscale cloud provider in May 2025, while another major multi-site contract was secured in March 2025 to supply Cat6A and Cat8 copper cabling to a leading hyperscale data center operator across Europe and North America.
- In June 2025, CommScope introduced new solutions FiberREACH and CableGuide 360 targeting growing structured cabling needs: high‑power PoE, improved cable management, and denser, more reliable enterprise network deployments.
- In April 2025, Legrand SA announced the acquisition of Computer Room Solutions (CRS) in Australia, strengthening its data center portfolio with integrated power and cabling solutions that support advanced structured cabling deployments in APAC facilities
Report Coverage
The research report offers an in-depth analysis based on Product Type, Application, Vertical Outlook and Geography. It details leading market players, providing an overview of their business, product offerings, investments, revenue streams, and key applications. Additionally, the report includes insights into the competitive environment, SWOT analysis, current market trends, as well as the primary drivers and constraints. Furthermore, it discusses various factors that have driven market expansion in recent years. The report also explores market dynamics, regulatory scenarios, and technological advancements that are shaping the industry. It assesses the impact of external factors and global economic changes on market growth. Lastly, it provides strategic recommendations for new entrants and established companies to navigate the complexities of the market.
Future Outlook
- The market will grow steadily as enterprises modernize networks to support high-speed digital operations.
- Fiber adoption will rise as cloud computing, AI workloads, and 5G networks demand higher bandwidth.
- Data center expansion will drive strong need for advanced cabling in hyperscale and edge facilities.
- Intelligent cabling management systems will gain traction for real-time monitoring and faster troubleshooting.
- Pre-terminated and modular cabling solutions will expand due to reduced installation time and labor needs.
- Smart-building projects will increase demand for PoE-enabled cabling supporting sensors and automation.
- Industrial IoT will push factories to install high-performance cabling for robotics and connected machinery.
- Sustainability requirements will encourage energy-efficient cabling designs and recyclable materials.
- Partnerships between cabling vendors and telecom operators will strengthen to support 5G backhaul.
- Emerging markets will see faster adoption as broadband penetration and commercial infrastructure investments rise.


